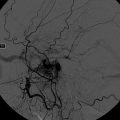
Fig. 5.1
a–c The picture shows an example of the effect of decreasing PRF in the ultrasound preset for venous study in power mode. TCCS from the temporal bone window in axial scanning plane, focused on middle cerebral artery (MCA) and deep middle cerebral vein (dMCV) in power mode, using progressively reduced PRF values from a to c. While MCA seems always easily identifiable, also with PRF values of 1.5 kHz (a), the power signal corresponding to the dMCV does not appear until the PRF value decreases to 0.5 kHz (c) (asterisk)
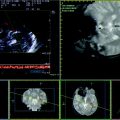
Fig. 5.2


a–c The picture shows an example of the effect of decreasing PRF in the ultrasound preset for venous study in color mode. TCCS from the temporal bone window in axial scanning plane, focused on MCA and dMCV in color mode, using progressively reduced PRF values from a to c. While MCA seems always easily identifiable, also with PRF values of 1.5 kHz (a), the color signal corresponding to the dMCV appears at PRF values of 1.0 kHz (b) (asterisk) and it is more evident at the PRF value of 0.5 kHz (c) (asterisk)
Related posts:

Stay updated, free articles. Join our Telegram channel
Full access? Get Clinical Tree
