Fig. 10.1
Normal cervical length
9.
Obtain at least three measurements and record the shortest best measurement in millimeters.
10.
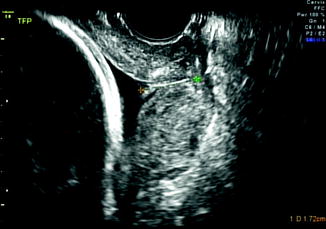
For best results, the internal os should be either flat or at an isosceles angle with respect to the uterus, the whole length of the cervix should be visualized, a symmetric image of the external os should be obtained, and the distance from the surface of the posterior lip to the cervical canal should be equal to the distance from the surface of the anterior lip to the cervical canal.
There should not be any increased echogenicity in the cervix (a sign of excessive pressure).
Table 10.1 shows various studies that had evaluated TVU CL as a predictor for PTB in women presenting with symptoms of PTL. In a recent meta-analysis evaluating TVU CL in prediction of PTB among symptomatic women, 28 studies were analyzed [25].
Table 10.1
Prediction of PTB by TVU CL in patients with symptoms of preterm labor (singleton pregnancies)
Author | Number of patients | PTB (%) | PTB defined (weeks) | GA studied (weeks) | TVU CL cutoff (mm) | % abn | Sens | Spec | PPV | NPV | RR |
|---|---|---|---|---|---|---|---|---|---|---|---|
Murakawa [6] | 32 | 34 | N/A | 25–35 | <30 | 53 | 100 | 71 | 65 | 100 | a |
<25 | 31 | 64 | 86 | 70 | 82 | 3.9 | |||||
Iams [4]b | 60 | 40 | <36 | 24–34 | <30 | 73 | 100 | 44 | 55 | 100 | a |
Gomez [3] | 59 | 37 | <37 | 20–35 | <18 | 41 | 73 | 78 | 67 | 83 | 3.9 |
>0.52c | 31 | 76 | 94 | 89 | 86 | 6.9 | |||||
Timor-Tritsch [7] | 70 | 27 | <37 | 20–35 | Wedging | 54 | 100 | 75 | 59 | 100 | a |
Rizzo [8] | 108 | 44 | <37 | 26–30 | <20 | N/A | 68 | 79 | 71 | 76 | 3 |
Rozenberg [9] | 76 | 26 | <37 | 24–39 | <26 | 39 | 75 | 73 | 50 | 89 | 4.6 |
Crane [5] | 136 | 27 | <37 | 23–33 | <30 | 50 | 81 | 65 | 46 | 90 | 2.3 |
Venditelli ([10])b | 200 | 41 | <37 | 19–36 | <30 | 64 | 83 | 88 | 54 | 80 | 2.8 |
Tekesin [11] | 68 | 41 | <37 | 20–35 | <26 | N/A | 82 | 63 | 63 | 83 | 7.7d |
Tsoi [12] | 216 | 8 | ≤ 7 d | 24–36 | <15 | 20 | 94 | 89 | 37 | 99 | 101d |
Fuchs [13] | 253 | 8 | ≤ 7 d | 24–35 | <15 | 14 | 81 | 92 | 47 | 98 | 4 |
Volumenie [14] | 59 | 39 | <37 | 18–34 | <27 | 49 | 70 | 64 | 55 | 77 | 4d |
Tsoi [15] | 510 | 15 | <35 | 24–34 | <20 | 34 | 76 | N/A | N/A | N/A | N/A |
Gomez [16] | 401 | 21 | <35 | 22–35 | <15 | 67 | 46 | 94 | 67 | 87 | N/A |
Daskalakis [17] | 172 | 37 | <34 | 24–34 | <20 | N/A | N/A | ||||
70e | 60e | 54e | 94e | 81e | |||||||
102f | 98f | 95f | 87f | 77f | |||||||
Jenkins [18] | 66 | 27 | <37 | 23–34 | <20 | 47 | N/A | N/A | N/A | N/A | 7.8d |
Holst [19] | 87 | 39 | <34 | 22–34 | <15 | 62 | 72 | 83 | 78 | 78 | 3.6 |
Palacio [20] | 333 | 23 | <34 | 24–36 | |||||||
116g | <25g | 16g | 50g | 87g | 32g | 94g | N/A | ||||
217h | <15h | 4h | 33h | 97h | 25h | 98h | N/A | ||||
Gramellini [21] | 108 | 23 | <34 | 20–33 | <15 | 78 | 24 | 94 | 54 | 80 | 4.9d |
<25 | 77 | 56 | 83 | 50 | 86 | 6.3d | |||||
Alfirevic [22] | 41 | 12 | ≤ 7 d | N/A | <15 | 17 | N/A | N/A | N/A | N/A | 0.2 |
Schmitz [23] | 395 | 8 | ≤ 7 d | 24–35 | <30 | N/A | 94 | 42 | 12 | 99 | 11.0d |
Adhikari [24] | 100 | 55 | ≤ 7 d | 26–36 | <25 | 23 | 60 | 97 | 91 | 82 | 4.2d |
There is considerable heterogeneity across the studies included. Studies varied in terms of their sample size, inclusion criteria, cervical length cutoffs, and primary outcomes. Mean gestational age (GA) at inclusion among the studies varied between 21.6 and 33.1 weeks. TVU CL cutoff also varied between 15 and 30 mm among these studies. Pooled data suggested that TVU CL < 15 mm, predicted PTB < 34 weeks with sensitivity, specificity, and LR + and LR– of 46.2%, 93.7%, 4.31, and 0.63 respectively.
For the prediction of PTB within 1 week of presentation, TVU CL < 15 mm had sensitivity, specificity, and LR + and LR– of 59.9%, 90.5%, 5.71, and 0.51 respectively.
These authors also reported that TVU CL < 15 mm was present in <10% of women presenting with symptoms of PTL and predicts approximately 60% of women who will deliver within the next one week. The likelihood of delivering within one week of presentation is increased by 5.7 times when TVU CL cutoff of <15 mm was used. Conversely, if TVU CL was > 15 mm, the vast majority of such women presenting with symptoms before 34 weeks will not deliver within the next one week (i.e., for women presenting at <34 weeks with PTL symptoms and with TVU CL > 15 mm, NPV of TVU CL for predicting delivery within the next one week was 96%. In other words, only 4% of women presenting with PTL symptoms before 34 weeks will deliver within the following week if TVU CL was >15 mm.). These findings may be helpful in avoiding admission of patients who are at very low risk for PTB and hence resulting in cost savings.
10.2 Management of PTL Based on TVU CL
There are randomized controlled trials that have been performed incorporating TVU CL in the management of PTL [26].
One of the suggested algorithms for management of patients presenting with symptoms of PTL using TVU CL and FFN is depicted in Fig. 10.4.
Fig. 10.4
Suggested algorithm for use of TVU CL and FFN in women with PTL symptoms
This algorithm is based on high sensitivity and negative predictive value of TVU CL of 30 mm, high positive predictive value of TVU CL of 20 mm (Table 10.1), and the high specificity of FFN.
In summary, TVU CL is a very good predictor of PTB among women presenting with symptoms of PTL. An algorithm such as that shown in Fig. 10.4 can be used for management of PTL according to TVU CL.
10.2.1 Preterm Premature Rupture of Membranes (PPROM)
Preterm premature rupture of membranes (PPROM) is defined as rupture of membranes at least one hour prior to the onset of labor, occurring at <37 weeks. Three percent of all pregnancies [27] and 30% to 45% of all spontaneous preterm deliveries [28] are associated with PPROM.
The time interval between rupture of membranes and delivery is referred to as latency period. About 57% of pregnancies complicated by PPROM < 24 weeks deliver within 1 week [28, 29] and 73% deliver within 2 weeks [29].
If PPROM occurs between 24 and 34 weeks, 50% deliver within 48 hours and 80% within 1 week.
Following PPROM, prediction of this latency period can help to plan administration of antenatal corticosteroids for fetal lung maturity [30] and also for transferring patients to a tertiary care center. Moreover, in cases of PPROM between 24 and 27 weeks, for each additional day of in utero maturation, survival probability is enhanced by approximately 2% [31]. Likewise, survival probability is improved by approximately 10% for each additional week of in utero maturation in cases of PPROM at 30 weeks [31, 32].
Several factors like parity [33], uterine contractions [33], amniotic fluid index [34–36], and maternal white blood cell count [37] have been proven to be poor predictors of duration of latency period between PPROM and preterm delivery. In the absence of active labor, digital examination for cervical assessment is contraindicated in PPROM due to risk of infection and it had been shown to shorten the latency period [38–40].
In contrast, TVU CL measurement has been shown to be safe in the presence of PPROM [41].
As shown in Table 10.2, TVU CL measurement had been investigated by few studies in predicting latency period for preterm delivery following PPROM [33, 41–43].
Table 10.2
Prediction of PTB by TVU CL in patients with PPROM (singleton pregnancies)
Author | Number of patients | GA at TVU CL measurement (weeks) | TVU CL (mm) | Median latency period days (range) | P value | Likelihood of PTB within 7 days |
|---|---|---|---|---|---|---|
Carlan [41] | 45 | 24–34 | ≤30 vs. >30 | 9 ± 5.4 vs. 11 ± 8.6 | NS | N/A |
Rizzo[33] | 92 | 24–32 | ≤20 vs. >20 | 2 (0–14) vs. 6 (0–36) | ≤0.0001 | N/A |
Gire [42] | 101 | 20–34 | ≤20 vs. >20 | 2.5 ± 6.6 vs. 10.0 ± 15.1 | 0.0029 | N/A |
Tsoi [43] | 101 | 24–36 | 30 | N/A | N/A | 6% |
28 | 32% | |||||
14 | 64% |
One study with small sample size showed that there is no significant difference in the latency period among those with and without short cervix, but they showed a trend towards longer latency period in women with a longer cervix [41].
TVU CL is shown to be significantly shorter in women with PPROM occurring after 28 weeks [42], with uterine contractions [33, 42, 43], cervical funneling [33, 42], and vaginal delivery [42] but not with chorioamnionitis [33, 42].
Cervical index (funnel length + 1/cervical length) improves prediction of PTB among women with intact membranes as compared to cervical length alone since it takes funneling also into account [3, 8]. Similarly, cervical index shows higher diagnostic efficacy in predicting PTB following PPROM as well [33].
In summary, TVU CL in women with PPROM is safe and does predict PTB, but no intervention trials have been done based on this information. Therefore, the clinical use of TVU CL in women with PPROM is limited and of unclear significance. It certainly deserves further study.
10.2.2 Induction of Labor
Induction of the labor is one of the frequently performed interventions in obstetrics. Availability of tools for predicting which patients will have a successful induction will help to reduce the cesarean deliveries due to failed induction. Clinical history of prior vaginal delivery, digital examination (Bishop score), TVU CL measurement [44], and fetal fibronectin assay [45] are some of the tools that have been studied to predict successful induction of labor at term.
Traditionally, Bishop score [46] has been used for preinduction cervical assessment and to determine the need for cervical-ripening agents. Accuracy of Bishop score has been questioned by some due to its subjective nature [1, 47] and wide inter- and intraobserver variations [47].
In recent years, objectively measuring CL using TVU has been evaluated in various studies, as a possible tool to predict outcome of labor induction. Moreover, TVU CL measurement has been shown to be better tolerated than digital examination [48].
Several studies evaluating TVU prediction of outcome for induction have looked at different predictive variables, e.g., CL, funneling, cervical angle, cervical position, etc., as well as different outcomes, e.g., vaginal delivery, vaginal delivery less than 24 hours, duration from induction to active labor, failed induction, cesarean, etc., which makes it very difficult to compare studies and to come up with clinical recommendations.
Some studies reported TVU CL as a better predictor [44, 48–54] of successful induction than Bishop score, while others did not [55–60] (Table 10.3).
Table 10.3
 General Intrapartum Sonography Setup and Use in Labor
 Intrapartum Sonography and Clinical Risk Management
 New Technologies for Monitoring Labor Progress
 Clinical Evaluation of Labor and Intrapartum Sonography
 Occiput Posterior Position and Intrapartum Sonography
 Intrapartum Sonography and Labor Progression


Related posts:
General Intrapartum Sonography Setup and Use in Labor
Intrapartum Sonography and Clinical Risk Management
New Technologies for Monitoring Labor Progress
Clinical Evaluation of Labor and Intrapartum Sonography
Occiput Posterior Position and Intrapartum Sonography
Intrapartum Sonography and Labor Progression
Stay updated, free articles. Join our Telegram channel
Full access? Get Clinical Tree
