An introduction to the expanding modality of contrast-enhanced ultrasound is provided, along with basics on contrast agents and technique. The contrast ultrasound findings of multiple renal tumors are reviewed with examples, including clear cell renal cell carcinoma, papillary renal cell carcinoma, chromophobe renal cell carcinoma, other rare renal cell carcinoma subtypes, oncocytoma, upper tract urothelial carcinoma, lymphoma, and angiomyolipoma, followed also by brief discussions of renal infections and pseudolesions.
Key points
- •
Contrast-enhanced ultrasound is useful for the identification and characterization of renal masses, and its use in this regard is increasing.
- •
Clear cell renal cell carcinoma is typically a hypervascular and heterogeneous mass, enhancing earlier and to a greater degree than renal cortex.
- •
Papillary renal cell carcinoma is hypoenhancing throughout, and shows a later peak than clear cell renal cell carcinoma.
- •
Oncocytoma and lipid-poor angiomyolipoma remain difficult to distinguish from clear cell renal cell carcinoma with contrast-enhanced ultrasound.
Introduction
The evaluation of renal masses with contrast has typically been performed with computed tomography (CT) scans or MR imaging in the United States, but the use of contrast-enhanced ultrasound (CEUS) for this purpose is expanding, and will likely continue to increase as familiarity with CEUS and its advantages grow.
With the extensive use of cross-sectional imaging in medicine, incidental renal masses have become a commonly encountered entity; some 13% to 27% of imaging studies of the abdomen will demonstrate an incidental renal lesion. Most of these incidentally detected lesions will be cysts, and many can be confidently diagnosed as such on the imaging study on which they are initially detected. For indeterminate lesions, US has long been used to verify the simple nature of a renal cyst, or alternatively to show its complexity, owing to the high specificity of US for fluid content in general. However, CEUS provides a relatively new addition to the toolkit available when evaluating a renal lesion by US and can be added to the same examination when needed.
Advantages, disadvantages, and safety of contrast-enhanced ultrasound
The advantages of US in general are well-known, such as low cost, real-time imaging, portability, and lack of ionizing radiation, but there are several additional advantages specific to CEUS. US contrast is not nephrotoxic, and therefore not only does not require preadministration laboratory testing, but also can be given multiple times during a study. Additionally, much finer detail of the enhancement characteristics of a lesion over time is shown with CEUS. For example, it is commonplace to acquire 1000 images during a 2-minute observation of a lesion after a contrast bolus, outperforming the number of images acquired during even perfusion studies obtained with CT scans or MR imaging.
US does have disadvantages, however, including operator dependence, habitus-related limitations, and obscuration by bowel gas or dense calcification. Rapid respiratory rate can also at times create difficulty for CEUS.
CEUS maintains an excellent safety profile. In the past there had been some concern over the safety of CEUS in patients with certain cardiovascular diseases such as intracardiac shunts or pulmonary hypertension, but large studies have shown CEUS to be safe even in these populations. Hypersensitivity to an US contrast agent (UCA) or one of its components is currently considered the only contraindication to the use of a UCA.
At the time of this writing, 3 UCAs are approved by the US Food and Drug Administration for intravenous use in echocardiography, for improved delineation of the endocardial border in suboptimal studies: Definity (Lantheus, North Billerica, MA), Lumason (Bracco, Milan, Italy), and Optison (GE Healthcare, Oslo, Norway). Lumason is also approved by the US Food and Drug Administration for characterization of focal liver lesions in adult and pediatric patients. However, “off-label” uses of CEUS are widespread and growing. The constituents of these 3 agents are provided in Table 1 ; in general, UCAs are composed of microbubbles of inert gas surrounded by a stabilizing shell.
| Agent | Gas | Shell |
|---|---|---|
| Definity | Octafluoropropane | Phospholipid |
| Optison | Octafluoropropane | Albumin |
| Lumason (Sonovue in Europe) | Sulfur hexafluoride | Phospholipid |
Contrast-enhanced ultrasound technique
CEUS is performed with a low mechanical index, typically less than 0.1. The low mechanical index minimizes microbubble destruction, and also creates nonlinear echoes from microbubble oscillations, which are detected when a phase inversion technique is used. After establishing an optimal view of the lesion of interest, a contrast bolus is given intravenously, and followed by a 10-mL normal saline flush. Cine acquisition is usually begun with the flush, and typically continues for 90 to 120 seconds. After this, additional cines or still images can be obtained for any length of time desired. Contrast administration can be repeated as needed for additional evaluation; in between in each contrast bolus, bubble destruction is achieved by high mechanical index pulses (“flashes”), or continuous Doppler imaging (for its higher mechanical index).
For renal imaging, it is worth noting that CEUS produces only corticomedullary and nephrographic phases; there is no excretory phase, as occurs with CT scans and MR imaging with contrast. This is due to the size of the UCA microbubbles. Because they are roughly one-half the size of a red blood cell, they remain completely intravascular, and never pass into the extracellular space. Eventually the microbubbles break down, with the gas component excreted by the lungs, and the shell portion typically metabolized by the liver.
Imaging findings
Clear Cell Renal Cell Carcinoma
Of the many subtypes of renal cell carcinoma (RCC), clear cell is the most common, accounting for about 70% of all RCCs, and it also accounts for the majority of metastatic disease from RCC. About 60% of all sporadic clear cell RCCs (ccRCCs) are associated with mutations of the tumor suppressor gene VHL on chromosome 3p, and an inherited mutation of this gene produces Von Hippel Lindau disease.
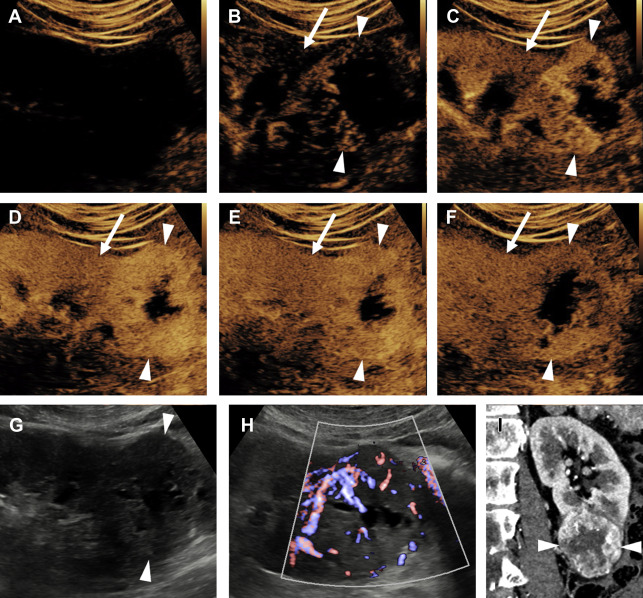
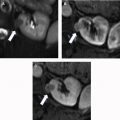
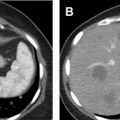
A ccRCC is typically a heterogeneous hypervascular mass, and may demonstrate internal necrosis, hemorrhage, or cystic change. Consequently, at CEUS examination ccRCC typically shows avid hyperenhancement, which is heterogeneous. Compared with normal renal cortex, ccRCC normally begins enhancing slightly earlier, reaches peak enhancement slightly earlier, and reaches a higher peak intensity of enhancement ( Fig. 1 ). Washout of ccRCC is more variable, but at delayed phase is usually either isoenhancing or hypoenhancing relative to cortex.
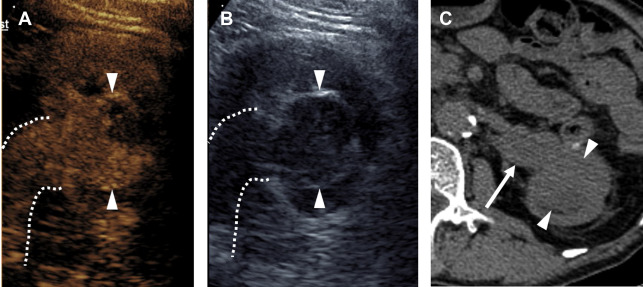
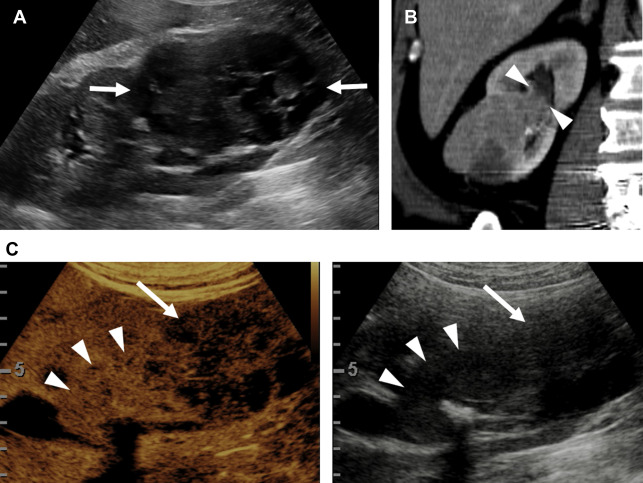
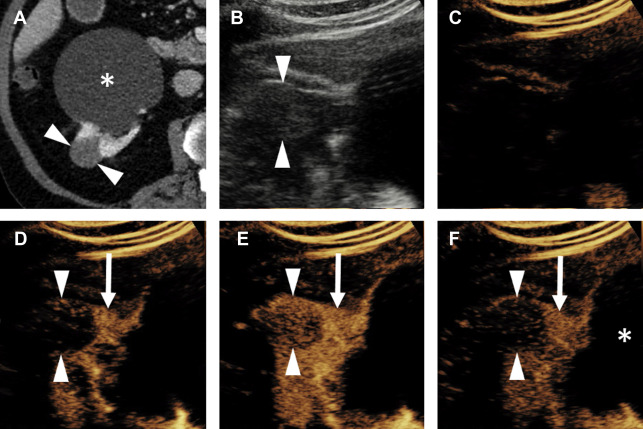
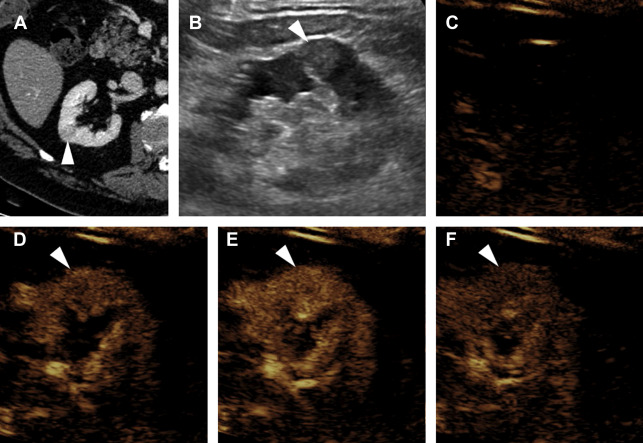
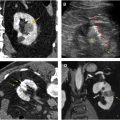
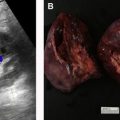
Evaluation for local invasion is key for ccRCC staging, and often in advanced tumors CEUS examination can demonstrate invasion of the renal vein ( Fig. 2 ) or renal collecting system ( Fig. 3 ). However, there may be instances where depth limits evaluation for invasion of these structures at US examination. Furthermore, with more extensive invasion of the renal vein and inferior vena cava, CT scan or MR imaging is preferred to ensure complete coverage for surgical planning.
Partial nephrectomy has become more commonly performed for RCC in general in recent years, and the rates of local recurrence are low. , Evaluation for local recurrence can be performed with CEUS examination, with recurrent masses of ccRCC tending to show more avid enhancement ( Fig. 4 ) than postoperative fibrosis, which is typically hypoenhancing.
Papillary Renal Cell Carcinoma
Papillary RCC (pRCC) is the second most common RCC subtype, constituting about 15% of all RCCs. There are 2 histologically distinct types of pRCCs, and most are type 1, a more indolent tumor with infrequent metastatic disease, and a 5-year survival rate of 95%. The less common type 2 pRCC is a more aggressive tumor with a 5-year survival rate of 66%, a rate more similar to ccRCC.
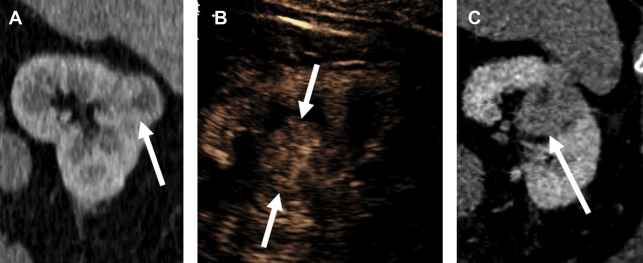
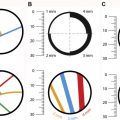
Distinguishing pRCC from ccRCC by enhancement pattern is straightforward with CEUS. Whereas ccRCC enhances earlier, peaks earlier, and reaches a greater peak enhancement than renal cortex, pRCC reaches its peak enhancement later than cortex, and always remains hypoenhancing compared with cortex ( Fig. 5 ). Whether or not the 2 types of pRCC can be distinguished by CEUS examination is currently unknown.
Chromophobe Renal Cell Carcinoma
The third most common subtype, chromophobe RCC (chRCC) represents 5% to 8% of all RCCs, , and is usually a low-grade neoplasm with a better prognosis than ccRCC. chRCC is 1 of 3 renal oncocytic neoplasms, with the other 2 being oncocytoma and hybrid oncocytic/chromophobe tumor. , That this spectrum exists poses a problem for needle biopsy of these lesions; because of the potential for tumor heterogeneity, needle biopsies of these tumors are often interpreted as an “oncocytic renal neoplasm” at pathology, with a definitive diagnosis deferred until complete resection. Essentially, biopsy of these lesions may not always be able to differentiate benign from malignant.
The enhancement pattern of chRCC at CEUS examination typically presents a sort of middle ground between the hyperenhancing ccRCC and the hypoenhancing pRCC. In general, chRCC enhances very similar to renal cortex throughout the contrast bolus ( Fig. 6 ). However, this finding is not actually a helpful distinguishing appearance at CEUS examination, mainly because of the relative rarity of chRCC compared with the fairly common ccRCC. In everyday practice, the observation of a renal tumor that is isoenhancing with cortex is more likely to be a slightly atypical ccRCC, because of its commonness, than the less common chRCC ( Fig. 7 ).
Related posts:
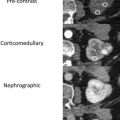 Image Interpretation
 Protocol Optimization for Renal Mass Detection and Characterization
 Radiomics and Artificial Intelligence for Renal Mass Characterization
 Reporting on Renal Masses, Recommendations for Terminology, and Sample Templates
 Percutaneous Thermal Ablation for Treatment of T1a Renal Cell Carcinomas
 Imaging of Renal Infections and Inflammatory Disease
Stay updated, free articles. Join our Telegram channel

Full access? Get Clinical Tree


