and Satoshi Inouye1, 2
(1)
Department of Biochemistry, School of Dentistry, Aichi-Gakuin University, Nagoya, Japan
(2)
Yokohama Research Center, JNC Corporation, Yokohama, Japan
Abstract
We have established a method of video-rate bioluminescence imaging to visualize exocytotic protein secretion from a single living cell using Gaussia luciferase (GLase) as a reporter protein. The luminescence signals produced by the enzymatic reaction of secreted GLase (luciferase) and coelenterazine (luciferin) are detected with an electron-multiplying charge-coupled device camera. An exocytotic event of protein secretion can be visualized using the protein fused to GLase with a time resolution of 30–500 ms. Signal analyses of the bioluminescence video images reveal a number of exocytotic sites, the frequency of exocytotic events, and the amount of secreted protein on a whole cell. Furthermore, the method can distinguish between secreted and cell surface-bound proteins. Our method is a direct approach to investigate the secretion and localization of proteins on the whole surface of living cells.
Key words
Video-rate bioluminescence imaging Gaussia luciferaseProtein secretionExocytosisCell surface1 Introduction
Real-time visualization of protein trafficking and distribution in living cells can provide insights into biological functions of proteins. Bioluminescence imaging of protein secretion from a single living cell has been carried out on the basis of a luciferin-luciferase reaction [1–5]. In mammalian cells, the secretory proteins including peptide hormones are transported by the secretory vesicles and released from cells. To investigate the exocytotic events on the cell surface, we recently developed a method of video-rate bioluminescence imaging using secreted Gaussia luciferase (GLase) as a reporter protein and an electron-multiplying charge-coupled device (EM-CCD) camera as a sensitive detector [4, 5]. Specifically, the secretory protein of interest is fused to GLase and expressed in mammalian cells, and exocytotic events from a whole cell are visualized (Fig. 1a, b). In our imaging system, the fused proteins of GLase to prepro-forms of insulin [4] and matrix metalloproteinase-2 (MMP-2) [5] were expressed in mammalian cells, and the exocytotic secretion of these fusion proteins from single cells was clearly visualized as luminescence spots. These results suggested that the method of video-rate bioluminescence imaging could be applied to investigate the protein secretion and the localization of various types of proteins on the whole surface of a living cell (Fig. 1a).
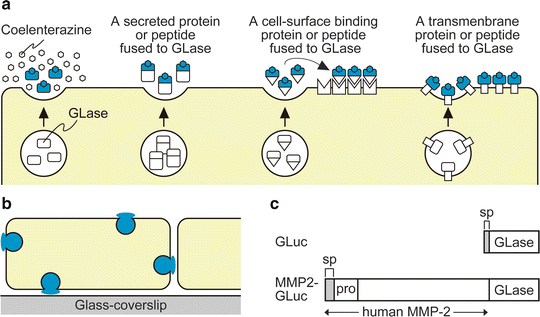

Fig. 1
Bioluminescence imaging of GLase as a reporter protein to visualize exocytotic protein secretion on the surface of mammalian cells. (a) Schematic representation of bioluminescence imaging of GLase and the fusion protein of GLase secreted from mammalian cells and its binding on the cell surface. (b) Detectable area of exocytosis in a single mammalian cell with bioluminescence imaging using secreted GLase. (c) Schematic representation of expression vectors for GLase and MMP2-GLase. GLuc (pcDNA3-GLuc); GLase with the signal peptide sequence, MMP2-GLuc (pcDNA3-hMMP2-GLuc); human MMP-2 preproprotein fused to GLase. Reproduced in part from Suzuki et al. [5] with the author’s copyright under PLoS One editorial policies
Here, we describe the application of video-rate bioluminescence imaging and MMP-2 secretion from HeLa cells using the fusion protein of MMP-2 to GLase (MMP2-GLase).
1.1 GLase and EM-CCD Camera
Secreted GLase is the smallest luciferase (consisting of 168 amino acid residues without the signal peptide sequence) that catalyzes the oxidation of coelenterazine to emit light (λ max = 488 nm) and does not require any cofactors in the luminescence reaction [6, 7]. The codon-optimized gene for GLase was expressed in mammalian cells and showed a high luminescence activity when expressed in the ER-Golgi pathway of mammalian cells [3, 7]. The amino-terminal fusion proteins of GLase to prepro-forms of insulin [4] and MMP-2 (Fig. 1c) [5] were correctly processed and secreted from cells. The EM-CCD camera used in our imaging system has high quantum efficiency and the luminescence video images can be recorded at a full spatial resolution of 32 fps (in a model of 512 × 512 pixels). The video-rate bioluminescence imaging using GLase combined with the EM-CCD camera is currently the most suitable method for visualizing protein secretion from a single cell.
1.2 Advantages of Bioluminescence Imaging for Protein Secretion
By detecting luminescence signals from GLase of fusion protein secreted from the outside of the cell surface, time-dependent changes of the amount of secreted protein can be estimated. Bioluminescence imaging is also advantageous for visualization of protein secretion over the whole surface of a cell (Fig. 1b), whereas the fluorescent imaging methods such as total internal reflection fluorescence and two-photon excitation fluorescence have distinct advantages for investigating the dynamics of exocytotic vesicles at limited areas of the cell surface. Furthermore, the bioluminescence imaging method allows long-term imaging of protein secretion in a nontoxic manner, in contrast to the video-rate fluorescence imaging methods that use continuous irradiation with harmful excitation light. As a result, we demonstrated the oscillatory change in the amount of glucose-induced insulin secretion from individual cells over 30 min [4]. Bioluminescence imaging on the whole cell surface facilitates study of the distribution of protein secretion, and we previously demonstrated that the pro-form of MMP-2 was secreted from the basal side of the cell [5].
The cumulative images of maximum luminescence intensity obtained from the video-rate bioluminescence imaging of protein secretion can be used to determine the exocytotic sites of protein secretion in an individual cell. The frequency of exocytotic events can be estimated by counting the luminescence spots of protein secretion in a cell area or by calculating time-dependent changes of maximum luminescence intensity in a micro domain of hot spots for protein secretion. The time-dependent changes of the amount of secreted protein can be estimated by calculating the average luminescence intensity in a single cell and in a region on a cell surface. Thus, the number of exocytotic sites, frequency of exocytotic events, and the amount of secreted protein can be estimated by video-rate bioluminescence imaging.
1.3 Imaging of Both Secreted and Cell Surface-Bound Proteins
MMPs are enzymes that degrade extracellular matrix proteins and regulate cell adhesion and migration. MMP-2 is one of the enzymes that degrades collagen in the basement membrane and plays a major role in cancer cell invasion. MMP-2 is a cell surface-binding protein secreted as the inactive pro-form. On the cell surface, the inactive pro-form of MMP-2 binds to the tissue inhibitor of metalloproteinase-2 (TIMP-2), which associates with the membrane type 1-matrix metalloproteinase (MT1-MMP, also called MMP-14). The amino-terminal peptide of pro-MMP-2 is cleaved by MT1-MMP to give the intermediate form. The intermediate form binds to integrin αvβ3 at the cell surface, and the fully active MMP-2 is then produced. The polarized localization of MMP-2 on both lamellipodia and invadopodia of a cell has been shown, and activated MMP-2 is localized at the front of migrating cells with protease activity.
In the video-rate bioluminescence imaging of MMP2-GLase expressed in HeLa cells, two distinct types of secreted MMP-2 and membrane-associated MMP-2 can be visualized on the cell surface in real-time [5]. The exocytotic secretion of MMP2-GLase is observed as transient luminescence spots on the basal side of most cells but at the leading edge of migrating cells [5]. The transient luminescence spots of secreted MMP2-GLase during exocytosis disappear in a few seconds [5]. In addition, MMP2-GLase bound to the basal side of cells can be visualized as the continuous luminescence spots after the addition of coelenterazine [5]. These spots of the membrane-associated MMP2-GLase gradually disappear, corresponding with the time-dependent decrease of the luminescence intensity of GLase (Fig. 2) [5, 8]. The analyses of bioluminescence video images of MMP2-GLase showed repeated secretion of MMP-2 from specific sites at the leading edge of the cell, suggesting that the sites of MMP-2 secretion differ from the MMP-2 binding sites (Fig. 3) [5].
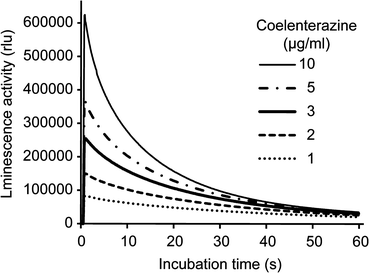
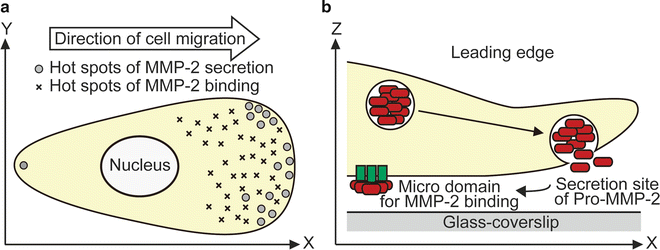

Fig. 2
Luminescence patterns of MMP2-GLase with various concentrations of coelenterazine determined by a luminometer. Luminescence intensity of MMP2-GLase with coelenterazine is recorded for 60 s. HeLa cells were transfected with pcDNA3-hMMP2-GLuc and cultured for 24 h. After removing the medium, the cells were incubated with HBSS for 60 min at 37 °C, and the luminescence activity in HBSS(+) was determined using a luminometer, as described in Note 9

Fig. 3
Schematic representation of MMP-2 secretion and binding on the cell surface in migration cells. (a) Hot spots of both secretion and binding of MMP-2 on the cell surface in a migrating cell. (b) The inactive pro-form of MMP-2 is frequently secreted on the leading edge and then binds to microregions on the cell surface. Reproduced from Suzuki et al. [5] with the author’s copyright under PLoS One editorial policies
The method of bioluminescence imaging has also been applied for visualization of the transmembrane proteins on the surface of living cells [3, 9]. The proteins are transported to the plasma membrane through the exocytotic pathway similar to other secreted proteins. The method of video-rate bioluminescence imaging described here can be used for visualizing both the exocytotic event and the distribution of transmembrane proteins on the surface of living cells.
2 Materials
A schematic representation of our video-rate bioluminescence imaging system is shown in Fig. 4. An inverted microscope equipped with an EM-CCD camera is set in a lightproof box. When a motorized microscope is used, a camera lens adaptor with an infrared (IR)-cut filter should be attached between the microscope and the EM-CCD camera to cut off the light from the pilot lamp in the microscope.
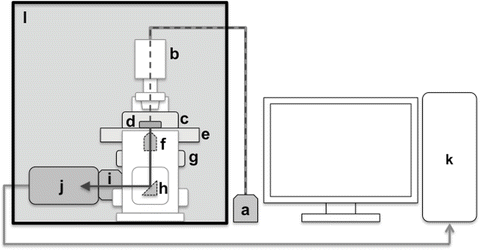

Fig. 4
Video-rate bioluminescence imaging system equipped with EM-CCD camera. A schematic representation of the video-rate bioluminescence imaging system is shown. The inverted microscope equipped with EM-CCD camera is placed in a lightproof box. The representative system consists of halogen lamp (a), inverted microscope (b), thermostat incubator (c), glass-bottom dish (d), stage (e), objective lens (f), ZDC unit (g), prism (h), C-mount adaptor (with an IR-cut filter for the electric motorized microscope) (i), EM-CCD camera (j), the system control computer (k), and lightproof box (l). Dashed and solid arrows indicate the light pathway from halogen lamp (a) to EM-CCD camera (j)
2.1 Bioluminescence Imaging System
1.
Microscope: IX71, IX81-ZDC, or IX81-ZDC2 electric motorized inverted microscope (Olympus, Tokyo, Japan).
2.
Objective lens: High numerical aperture (NA) oil-immersion (O) or water-immersion (W) objective lens (Olympus): UPLSAPO 20× O/NA 0.95; UPLFLN 40× O/NA 1.30; UPLSAPO 60× O/NA 1.35; UPLSAPO 100× O/NA 1.40; UAPO 20× W3/340/NA 0.70; UAPO 40× W3/340/NA 1.15; and UPLSAPO 60× W/NA 1.20 (see Note 1).

