Fig. 27.1
Normal coronary artery. OCT demonstrates good contrast of the three layers of normal vessel. The media (M) is seen as a dark band delimited by the intima (I) and adventitia (A)
4 Atherosclerotic Plaque
OCT has shown effectiveness in characterizing plaque composition. Fibrous plaques are characterized by homogeneous, signal-rich regions, fibrocalcific plaques by signal-poor regions with sharp borders, and lipid-rich plaques by signal-poor regions with diffuse borders (Fig. 27.2). With use of histopathologic diagnosis as the gold standard, these OCT criteria yielded a high sensitivity and specificity ranging from 71 to 79% and 97 to 98% for fibrous plaques, 95 to 96% and 97% for fibrocalcific plaques, and 90 to 94% and 90 to 92% for lipid-rich plaques, respectively [3]. Interobserver and intraobserver agreements for the plaque characterization with OCT were also high (k = 0.88 and 0.91, respectively) [3].
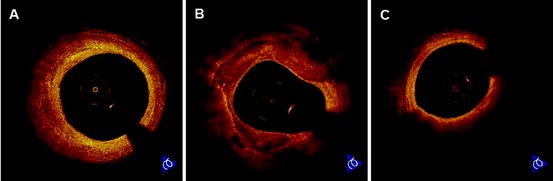
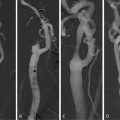
Fig. 27.2
Coronary atherosclerotic plaques. (a) OCT images of fibrous plaque show a homogeneous, signal-rich region. (b) OCT images of fibrocalcific plaque show a signal-poor region with sharply delineated borders. (c) OCT images of lipid-rich plaque show a signal-poor region with poorly delineated borders beneath a thin homogeneous band
5 Vulnerable Plaque
Plaque Rupture:
Plaque rupture is defined as a presence of fibrous-cap discontinuity and a cavity formation of the plaque in OCT (Fig. 27.3). The high resolution of OCT allows for a clear visualization of disrupted fibrous-cap and an accurate measurement of its thickness [4]. OCT revealed that the frequency of plaque rupture was 73% in patients with acute myocardial infarction (AMI) [5]. In patients with unstable angina (UAP), plaque rupture was often observed in Braunwald clinical class III (angina at rest within 48 h) compared with class I (new onset of severe angina or accelerated angina) and II (angina at rest within previous month but not within preceding 48 h) (71% vs. 43% vs. 13%, p < 0.001) [6].
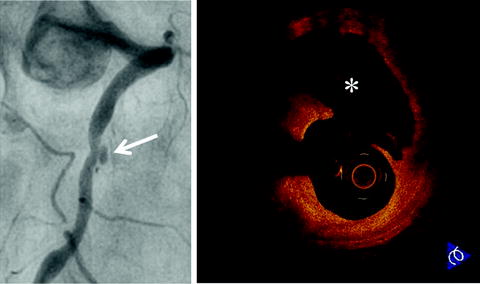
Fig. 27.3
Plaque rupture in patient with acute myocardial infarction. Coronary angiogram shows an ulcerated lesion in the mid right coronary artery (arrow). OCT demonstrates plaque rupture with a disrupted fibrous-cap and core cavity (asterisk) at the lesion site
OCT showed that the morphologies of plaque rupture differed between rest-onset and exertion-triggered rupture in patients with AMI. The thickness of disrupted fibrous-cap was significantly higher in exertion-triggered rupture compared with rest-onset rupture (exertion: 90 μm [interquartile median 65 μm]; rest onset: 50 μm [interquartile median 15 μm], p < 0.01) [7]. OCT suggests that some plaque rupture could occur in thick fibrous-caps >65 μm thick.
OCT proposed two risk factors linking ruptured plaques to ACS: greater degree of plaque rupture and smaller lumen. Ruptured cavity area was significantly larger in AMI compared with UAP (2.52 ± 1.36 mm2 vs. 1.67 ± 1.37 mm2, p = 0.034) [8]. Lumen area at rupture site was significantly smaller in symptomatic plaque rupture in UAP compared with asymptomatic plaque rupture in stable angina pectoris (SAP) (3.00 ± 0.86 mm2 vs. 3.45 ± 1.18 mm2, p = 0.030) [9]. The greater degree of plaque rupture provokes more increased thrombus formation, and the smaller lumen requires less thrombus to precipitate an acute coronary event.
Three-vessel OCT imaging showed multifocal plaque destabilization during ACS [10–12]. Plaque rupture was often detected not only in culprit lesions but also in non-culprit lesions. Although one single lesion is clinically active at the time of ACS, the syndrome is associated with overall coronary instability.
Erosion:
Plaque erosion is defined as a presence of an irregular luminal surface and no evidence of cap rupture evaluated in multiple adjacent frames (Fig. 27.4). Erosion is usually comprised of OCT evidence of thrombus [13]. Conventional imaging techniques are not sensitive enough to detect plaque erosions. OCT revealed that the frequency of plaque erosion was 23% in patients with AMI [5], and this data was comparable with previous autopsy results. Erosion may be less potently thrombogenic and lead smaller infarctions in comparison with plaque rupture.
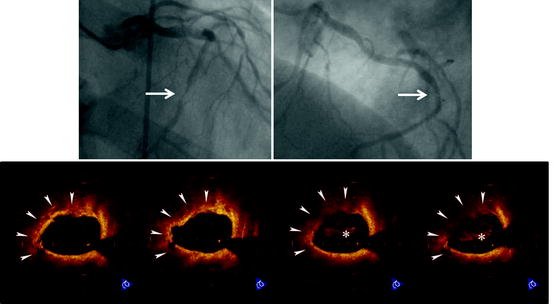
Fig. 27.4
Plaque erosion in patient with unstable angina pectoris. Coronary angiogram shows a subtotal lesion in the mid left circumflex coronary artery (arrow). OCT demonstrates plaque erosion with an irregular lumen surface (arrowheads) and intracoronary thrombus (asterisks) at the lesion site
Calcified Nodule:
Calcified nodule is defined as a protrusion of a signal-poor and heterogeneous region with OCT signal attenuation (Fig. 27.5). Because light penetrates calcium in contrast with ultrasound, OCT allows precise, in vivo assessment of calcified nodules [14]. The origin of this lesion remains unclear, but it appears to be associated with healed thrombus or, potentially, with intraplaque hemorrhage.
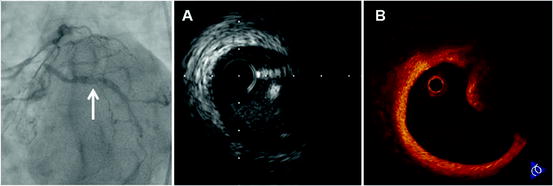
Fig. 27.5
Calcified nodule in patient with accelerated angina. Coronary angiogram shows intraluminal haziness in the proximal left circumflex coronary artery (arrow). (a) IVUS demonstrates a convex lumen surface with bright echo that obstruct the penetration of ultrasound. (b) OCT discloses a protrusion of a heterogeneous region with signal attenuation
Thrombus:
Intracoronary thrombus was defined as a mass protruding into the vessel lumen from the surface of the vessel wall (Fig. 27.6). OCT can determine the presence, location, and size of a thrombus and even discriminate between white and red thrombus [15]. Red thrombus, predominantly consisting of red blood cells, appears in OCT as high backscattering structures with signal-free shadowing while white thrombus, predominantly consisting of platelets and white blood cells, appears as a low backscattering structure [16]. In practice, pure white or red thrombi are rarely found; mixed thrombi, on the other hand, are common.
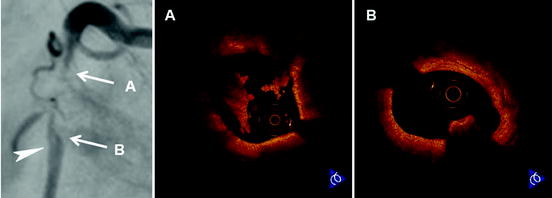
Fig. 27.6
Intracoronary thrombi in patient with acute myocardial infarction. Coronary angiogram shows a subtotal lesion with luminal filling defect (arrowhead) in the proximal right coronary artery. (a) OCT demonstrates white thrombi, predominantly consisting of platelets and white blood cells, which appears as low backscattering structures at the proximal site of the culprit lesion. (b) OCT discloses red thrombus, predominantly consisting of red blood cells, which appears as a high backscattering structure with signal-free shadowing at the distal site of the culprit lesion
A coronary thrombus is observed by OCT even in patients with SAP. This may help to explain the benefit of antiplatelet therapy for the prevention of acute coronary events in the SAP patient population.
TCFA:
OCT-derived TCFA is defined as a plaque with lipid and fibrous-cap of <65 μm thick (Fig. 27.7). OCT is the only modality with the resolution required for direct quantitative measurement of the fibrous-cap thickness [17]. The fibrous-cap thickness is defined as the minimum distance from the coronary artery lumen to inner border of lipid, which is characterized by signal-poor region in OCT image. An excellent correlation was found in the measurements of the fibrous-cap thickness between OCT and histological examination (r = 0.90, p < 0.001) [18].
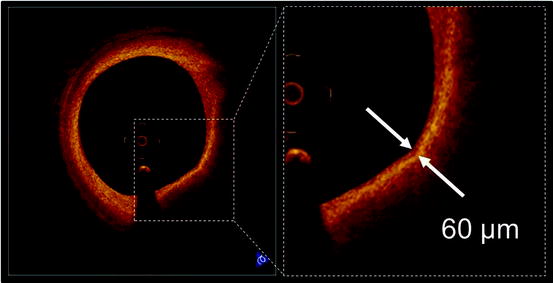
Fig. 27.7
Thin-cap fibroatheroma (TCFA). A fibrous-cap (arrows) is identified as a signal-rich homogenous region overlying a lipid core, which is characterized by a signal-poor region in OCT image. OCT-derived TCFA is defined as a plaque with a fibrous-cap measuring <65 μm
OCT-derived TCFA has been investigated with other imaging techniques to confirm its instability. Recent IVUS studies have demonstrated that hypoechoic plaque with deep ultrasound attenuation is common in ACS. Such “attenuated plaque” is thought to be an IVUS characteristic of unstable lesion. OCT-derived TCFA was more often seen in IVUS-derived attenuated plaques compared with non-attenuated plaques (48% vs. 16%, p < 0.001) [19].
Spectral analysis of the radiofrequency (RF) ultrasound backscatter signals, known as Virtual Histology (VH), offers an in vivo opportunity to identify the four different types of atherosclerotic plaques (e.g., fibrous, fibro-fatty, dense calcium, and necrotic core). A natural history study of atherosclerosis using VH-IVUS showed that VH-derived TCFA, which is characterized by absence of visible fibrous-cap overlying a necrotic core, has a high risk for future adverse cardiovascular events. OCT-derived TCFA is associated with this vulnerable feature of VH-IVUS (diagnostic concordance rate = 86%) [20].
Angioscopy allows direct visualization of the internal surface of a coronary vessel wall. Several angioscopic studies revealed that yellow plaque was common in the culprit lesion of ACS. Therefore, angioscopy-identified yellow plaque has been considered vulnerable. OCT showed significant negative correlation between yellow color intensity and fibrous-cap thickness (p < 0.001) [21]. Furthermore, 80% of intensive yellow plaques were OCT-derived TCFA.
Recent advances in multi-detector computed tomography (CT) technology have allowed for a noninvasive assessment of coronary atherosclerotic plaques. A prospective CT study showed that the low-density plaque with positive vessel remodeling was an independent predictor of subsequent ACS. These CT characteristics were observed more frequently in OCT-derived TCFA compared with non-TCFA (76% vs. 31%, p < 0.001) [22].
OCT has been used to evaluate prevalence of TCFA in vivo. OCT-derived TCFA was more frequently observed in patients with AMI or ACS than SAP (72% vs. 50% vs. 20%, p = 0.012) [23]. In accordance with a previous pathological study [24], OCT-derived TCFA was detected not only in culprit lesions but also in non-culprit segments [10–12]. The distribution of OCT-derived TCFA in the right coronary artery was relatively even (proximal vs. mid vs. distal: 12% vs. 29% vs. 18%, p = 0.420), whereas TCFA in the left coronary artery was common in proximal sites (proximal vs. mid vs. distal: 27% vs. 9% vs. 0%, p = 0.018) [25]. Moreover, OCT-derived TCFA is associated with serum high sensitive C-reactive protein level [26]. These OCT data provide further evidence of the multifocal nature of inflammation in coronary atherosclerosis and support the hypothesis that the inflammation is manifested by thinning of the fibrous-caps of both culprit and non-culprit lesions.
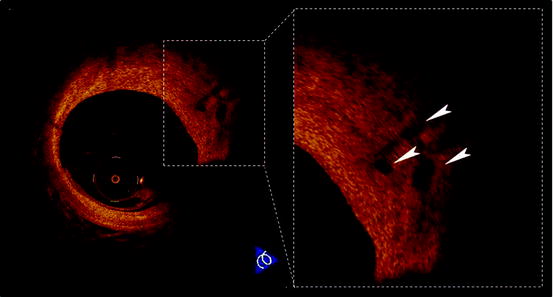
Neovascularization:
Increased microvessels in atherosclerotic plaques are associated with plaque vulnerability. Microvessels could contribute to intraplaque hemorrhage, resulting in expansion of the plaque. The high resolution of OCT offers an opportunity to directly visualize microvessels in the atherosclerotic plaque in vivo. The microvessel in the plaque is defined as a no-signal tubuloluminal structure without a connection to coronary artery lumen in OCT (Fig. 27.8). OCT showed that the microvessel density was increased in TCFAs (54% vs. 21%, p = 0.012) and lesions with positive remodeling (67% vs. 36%, p = 0.020) [27]. In addition, serum high sensitive C-reactive protein levels were significantly different according to the presence or absence of microvessels (median 0.27 mg/dl vs. 0.13 mg/dl, p = 0.015) [27]. Assessment of plaque neovascularization by using OCT might be useful for identifying lesions more prone to destabilization and rupture.
 Relationship Between Plaque Echogenicity and Atherosclerosis Biomarkers
 Quantitative Magnetic Resonance Analysis in the Assessment of Cardiac Diseases
 Quantitative Computed Tomography Analysis in the Assessment of Coronary Artery Disease
 Carotid Angioplasty and Stenting
 Segmentation of Carotid Ultrasound Images
 Carotid Plaque Stress Analysis: Issues on Patient-Specific Modeling


Related posts:
Relationship Between Plaque Echogenicity and Atherosclerosis Biomarkers
Quantitative Magnetic Resonance Analysis in the Assessment of Cardiac Diseases
Quantitative Computed Tomography Analysis in the Assessment of Coronary Artery Disease
Carotid Angioplasty and Stenting
Segmentation of Carotid Ultrasound Images
Carotid Plaque Stress Analysis: Issues on Patient-Specific Modeling
Stay updated, free articles. Join our Telegram channel
Full access? Get Clinical Tree
