(1)
Intelligent Systems Research Centre, University of Ulster, Londonderry, UK
6.1.1 MR Image Segmentation
6.1.2 MR Image Registration
6.2 Enhanced VBM
6.2.1 Histogram Match
6.2.2 Application to AD Study
6.5.1 AD Classification
6.5.2 Structural Covariance
Abstract
Voxel-based morphometry (VBM) is a method for comparing different subject groups, which has many clinical applications. For example, VBM has been applied to study abnormal structures in Alzheimer’s disease (AD). This method is based on high-resolution structural MRI (sMRI) processing. To begin with, we introduce major sMRI preprocessing steps for cross-sectional VBM analysis. Then we provide the statistical method for comparing gray matter images from two different groups. After that, we present an enhanced VBM (eVBM) method for sMRI data analysis. We also compare eVBM with conventional VBM using a large cohort AD dataset.
Apart from introducing cross-sectional VBM, we provide longitudinal VBM method which is superior to cross-sectional VBM method in that it can be used to investigate cause–effect relationship and evaluate the cerebral cortex changes over time. We take AD study as an example to show how to apply this method for clinical study. In addition, we address the cause–effect relationship between different brain regions using causality analysis method. Furthermore, we present the results and discuss the advantages and disadvantages of the method for AD study. Finally, we introduce briefly the AD classification and structural image covariance analysis.
Keywords
Voxel-based morphometry (VBM)Alzheimer’s disease (AD)Longitudinal data analysisHistogram matchStructural MRI (sMRI)6.1 Background for Voxel-Based Morphometry Analysis
Voxel-based morphometry (VBM) is a method that characterizes brain differences in vivo using structural magnetic resonance imaging (sMRI). It has been successful in identifying structure differences since it was established in 1995 [1–4]. The method has been applied in a wide variety of studies, including schizophrenia, developmental and congenital disorders, temporal lobe epilepsy, aging, and Alzheimer’s disease (AD) [3, 5–7]. For example, VBM finds differences in gray matter (GM) concentration between age-matched elderly controls and AD subjects [8, 9].
The major steps for processing sMRI image for VBM analysis is displayed in Fig. 6.1. Conventional VBM usually successively involves brain extraction, nonuniformity correction, segmentation, registration, smoothing and modulation, and statistical inference for groupwise comparison. Due to the scope of this book, we are not going to introduce each step in detail, but we give a brief review on image segmentation and image registration and provide some background of statistical test method for VBM analysis. Since we have presented the method for threshold correction for multiple comparisons (Chap. 2), we only show the statistical test for different group comparison using linear model method.


Fig. 6.1
Major steps for processing sMRI for VBM data analysis
It should be noticed that these steps in Fig. 6.1 are not fixed, i.e., image registration can be done before nonuniformity correction but transformed to the standard space after gray matter segmentation step. It may be necessary to adjust these steps to achieve optimal results. For readers who are interested in brain extraction (brain skull cut) see Ref. [10], for nonuniformity correction see [11], and nonparametric group comparison see [12] for details. For the step in modulation and smoothing in VBM analysis, this can be done after the image has been registered to standard template. After we obtained gray matter image from segmentation and registration steps, we can modulate (to correct for local expansion or contraction) it by dividing them by the Jacobian of the warp field. The segmented and modulated images are then smoothed with an isotropic Gaussian kernel. Finally, statistical methods can be applied to compare different subject groups.
6.1.1 MR Image Segmentation
sMR image segmentation is a very important step for 3D surface reconstruction and VBM analysis. The purpose of MR image segmentation is to classify brain tissue into three groups, i.e., gray matter, white matter, and CSF. Many methods have been developed for sMR image segmentation, including histogram-based method such as Gaussian mixed model method [13], Markov random fields method, and snake method (see reviews and reference therein [14–16]).
6.1.2 MR Image Registration
The objective of image registration in VBM analysis is to match the individual sMRI to a standard template for group comparison. Generally, there are two types of methods for image registration: one is control-point-based method and the other is based on global image intensity. For the former, we need to select features (control points) by manual or by some automatic methods for image match. For the latter, it does not depend on features but on a global objective function using image intensity. This function is used for measure source image and target image similarity. The function can be mean square error of two images, mutual information [17], cross correlation, ratio between two images [18], etc. (for review see [19, 20] and reference therein).
6.1.3 Statistical Methods for VBM Analysis
We often need to compare two groups in VBM analysis, i.e., compare control with patient groups. There are two methods to achieve this goal, one is parametric method such as generalized linear model (GLM) or analysis of variance (ANOVA) method, and the other is the nonparametric method using bootstrap method. We only introduce how to apply GLM method for VBM analysis; for the nonparametric method, see [21].
We give an example to demonstrate the basic statistical idea of this method for group comparison. Suppose we have three control subjects and two patient’s sMRI data, we want to compare the gray matter difference between these two groups. We process the data according to the pipeline as shown in Fig. 6.1. Eventually, we obtain the modulated gray matter concentration for each subject at one voxel; thus, we have

where  is the modulated gray matter concentration for these five subjects (controls and patients) and
  is 5 × 1 vector in this case. For control and patient group comparison, we set matrix
  using only 0 and 1 components, i.e.:
![$$ X=\left[ {\begin{array}{*{20}{c}} 1 & 0 \\ 1 & 0 \\ 1 & 0 \\ 0 & 1 \\ 0 & 1 \\ \end{array}} \right] $$](/wp-content/uploads/2016/04/A317179_1_En_6_Chapter_Equ2.gif)

(6.1)
 is the modulated gray matter concentration for these five subjects (controls and patients) and
  is 5 × 1 vector in this case. For control and patient group comparison, we set matrix
  using only 0 and 1 components, i.e.:
![$$ X=\left[ {\begin{array}{*{20}{c}} 1 & 0 \\ 1 & 0 \\ 1 & 0 \\ 0 & 1 \\ 0 & 1 \\ \end{array}} \right] $$](/wp-content/uploads/2016/04/A317179_1_En_6_Chapter_Equ2.gif)
(6.2)
Then we solve the Eq. (6.1) to obtain  ; after that we set a contrast vector
 ![$$ C=[1,-1] $$](/wp-content/uploads/2016/04/A317179_1_En_6_Chapter_IEq5.gif) for group comparison. Finally, we can apply the t-test (Sect. 2.6.1) and threshold correction method (Sect. 2.6.2) from the second chapter to test the significant difference between two groups. It is easy to see that this is ANOVA in statistics. This method can be extended to compare more than two groups.
for group comparison. Finally, we can apply the t-test (Sect. 2.6.1) and threshold correction method (Sect. 2.6.2) from the second chapter to test the significant difference between two groups. It is easy to see that this is ANOVA in statistics. This method can be extended to compare more than two groups.
 ; after that we set a contrast vector
 ![$$ C=[1,-1] $$](/wp-content/uploads/2016/04/A317179_1_En_6_Chapter_IEq5.gif) for group comparison. Finally, we can apply the t-test (Sect. 2.6.1) and threshold correction method (Sect. 2.6.2) from the second chapter to test the significant difference between two groups. It is easy to see that this is ANOVA in statistics. This method can be extended to compare more than two groups.
for group comparison. Finally, we can apply the t-test (Sect. 2.6.1) and threshold correction method (Sect. 2.6.2) from the second chapter to test the significant difference between two groups. It is easy to see that this is ANOVA in statistics. This method can be extended to compare more than two groups.6.2 Enhanced VBM
Although conventional VBM method is a powerful method to study sMRI difference, it may overestimate some structure differences or detect false-positive regions. The reason for this is that the information of the sMRI may be distorted in the processing steps of the conventional method (brain extraction, nonuniformity correction, segmentation, registration, smoothing and modulation, and statistical multivariate comparison in Fig. 6.1). This information distortion can be due to false-positives in the statistical comparison in the last step [22]; but it can also be due to unequalization of the image histograms of different subjects in the beginning of the preprocessing steps. For example, due to biological variability in morphology across subjects [23], it is generally observed that the GM histogram distribution of sMRI is different across subjects. Furthermore, the GM histogram distribution is often mixed with that of the white matter (WM) even within the same subject, and this could be one of the reasons for the difficulties encountered when segmenting WM from GM in the same sMRI.
To overcome the limitation of image histogram unequalization between subjects, we suggest an enhanced VBM (eVBM) method, which is based on the VBM method. The basic idea of the approach is to enhance the image histogram in conventional VBM before groupwise comparison. All image histograms are adjusted according to the histogram distribution of a template sMRI so that all histograms are matched with each other before further analysis. In this way, the method reduces the drawback of having big histogram differences in the same group data.
6.2.1 Histogram Match
The basic idea of eVBM is to reduce the unequalization of sMRI histograms in the conventional VBM method. This is obtained by transforming each sMRI with a histogram matching algorithm, which is a generalization of histogram equalization. The proposed eVBM approach then consists of introducing the histogram matching step just after brain extraction (Fig. 6.2).


Fig. 6.2
eVBM data analysis protocol proposed in this study. The gray block shows the additional histogram matching step incorporated into the conventional VBM method (Fig. 6.1)
The goal of the histogram matching algorithm is to adjust the histogram distribution of an sMRI to a template histogram distribution. For example, the source images in Fig. 6.3a, b are transformed to a template image histogram distribution (such as that shown in Fig. 6.3c) with a desired brightness distribution over the whole image grayscale, leading to Fig. 6.3d and 6.3e, respectively.
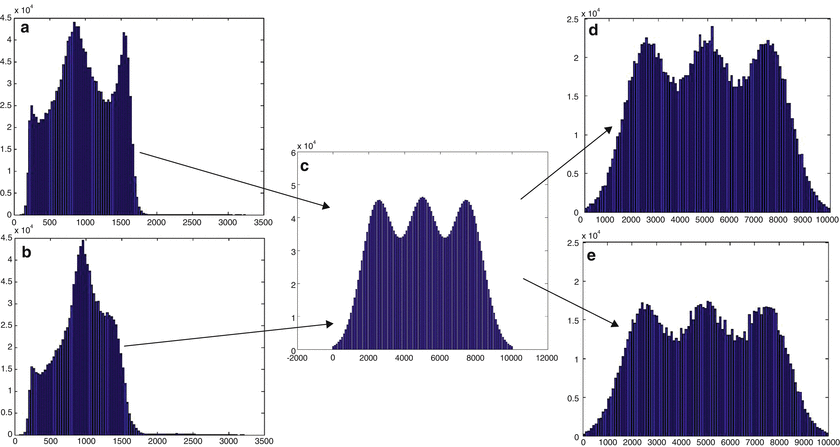

Fig. 6.3
(a) and (b): Histograms of two typical sMRIs from control subjects after removing the background and the brain skull of the images. The histogram in panel (a) shows two peaks, while that in panel (b) shows 1 peak. (c) Template histogram. (d) and (e) represent the matched histogram of (a) and (b), respectively
More formally, let { } be a discrete grayscale image to match to the template histogram distribution and
  be the number of occurrences of gray level
  . The probability of an occurrence of a voxel of level
  in the image {
 } is
} is

where  and
and  are the total number of gray levels in the image and the total number of voxels in the image, respectively.
  is the histogram of the image, normalized to [0,1]. The cumulative distribution function (CDF)
  corresponding to
  is defined as

which is also the image’s accumulated normalized histogram. Let us design a transformation of the form  to produce a new image {
 } such that its CDF
  is linearized across the whole range of values, i.e.,

for some constant  . The properties of the CDF allow to perform the following transformation:

 } be a discrete grayscale image to match to the template histogram distribution and
  be the number of occurrences of gray level
  . The probability of an occurrence of a voxel of level
  in the image {
 } is
} is
(6.3)
 and
and  are the total number of gray levels in the image and the total number of voxels in the image, respectively.
  is the histogram of the image, normalized to [0,1]. The cumulative distribution function (CDF)
  corresponding to
  is defined as
(6.4)
 to produce a new image {
 } such that its CDF
  is linearized across the whole range of values, i.e.,
(6.5)
 . The properties of the CDF allow to perform the following transformation:
(6.6)
Matching the histogram of { } to a given histogram template {
 } then consists of transforming {
 } to {
 } according to [24]

where  represents the CDF of the template histogram {
 } and
} and  denotes the inverse transformation of
  .
.
 } to a given histogram template {
 } then consists of transforming {
 } to {
 } according to [24]
(6.7)
 represents the CDF of the template histogram {
 } and
} and  denotes the inverse transformation of
  .
.A Gaussian mixture template histogram distribution (Fig. 6.3c) was adapted as a reference distribution for histogram matching, with three identical Gaussian laws (from 0 to 10,000 gray levels, of mean 2,500, 5,000, and 7,500, respectively; the standard deviation was 900) regularly spaced to enhance contrast.
6.2.2 Application to AD Study
To demonstrate how to use VBM method and to compare VBM with eVBM, we apply this method for AD study. We studied a group of 69 patients with Alzheimer’s disease (AD) and 79 age-matched elderly controls (data N in the Appendix). As an example, we used FSL toolbox (for details of FSL, see http://www.fmrib.ox.ac.uk/fsl/) and the VBM analysis (Fig. 6.1) for the data processing as follows. First, the BET method [25] was employed to extract the brain from the averaged structural image for each subject. Next, nonuniformity correction was carried out and FAST4 [10] was used to segment tissues according to their type. The segmented GM partial volume images were then aligned to the Montreal Neurological Institute (MNI) standard space (MNI152) by applying the affine registration tool FLIRT [26] and nonlinear registration FNIRT methods, which use a B-spline representation of the registration warp field [27]. The registered images (before smoothing) were averaged to create a study specific template, and the native GM images were then nonlinearly re-registered to the template image. Visual check was performed to control the quality of brain image extraction, segmentation, and registration for each averaged structural image. Mis-extracted, mis-segmented, and misregistered images were then processed again by using different parameter values until the results looked visually satisfactory. The registered GM partial volume images were then modulated (to correct for local expansion or contraction) by dividing them by the Jacobian of the warp field. The segmented and modulated images were then smoothed with an isotropic Gaussian kernel with a standard deviation of 3 mm (full-width-at-half-maximum (FWHM) = 7.05 mm).
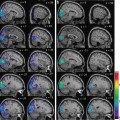
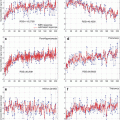
The results obtained by using VBM and eVBM for detecting significant differences between controls and AD patients are given in Fig. 6.4a and 6.4b, respectively. Color areas represent regions in which GM probability was significantly higher in controls than in patients (p < 0.05, corrected), superimposed on a structural image in the MNI space. The color bar denotes the magnitude of the difference in GM concentration as measured by the T values. Figure 6.4a shows the results of the conventional VBM method. Regions of the hippocampus and parahippocampus gyrus, amygdala region, fusiform gyrus, occipital cortex, frontal and temporal lobes, middle cingulum cortex, and caudate nucleus were found significantly different in AD patients compared with controls. Figure 6.4b shows the results obtained with the eVBM method. The most significant GM differences between patients and controls were found in the hippocampus and parahippocampus gyrus and amygdala regions bilaterally, while only parts of the insula and precuneus regions showed significant differences. Other regions in which a significant difference was found included the caudate nucleus, the temporal cortex, and the lingual cortex. These results exhibit conservative structure differences and lower T values than those shown in Fig. 6.4a. Although eVBM method detected a significant difference in the temporal cortex, the size of this region was different, suggesting that eVBM detected less differences in the results. To compare these methods quantitatively, we calculated the total number of voxels above the threshold against the T value; Fig. 6.5a plots the results for the comparison. It is obvious that at the same T value level (e.g., x-axis in Fig. 6.5a), VBM method (Figs. 6.4a and 6.5a) found more voxels above that T value level than the eVBM method (Figs. 6.4b and 6.5b).
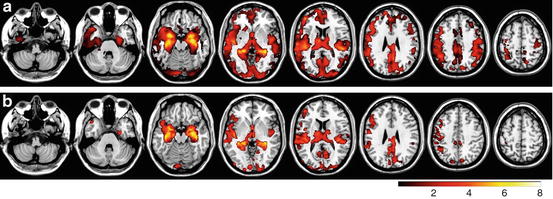
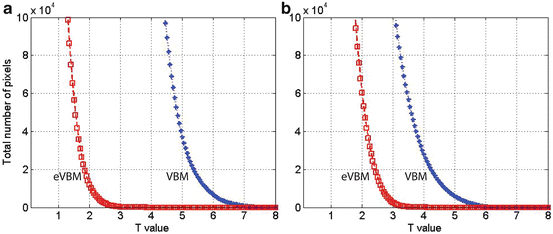

Fig. 6.4
Comparison of FSL-VBM and FSL-eVBM methods. (a) T value maps obtained using the conventional FSL-VBM method. (b) T value maps obtained using the FSL-eVBM method. Color regions show where the GM probability was significantly higher in controls than in patients (p < 0.05, FWE corrected threshold)

Fig. 6.5
Total number of voxels above the threshold plotted against the T value using the two methods. (a) The results of the comparison between controls and AD patients; (b) The results of the comparison between the first group of controls and the second group of controls. The star-dashed curve denotes the conventional VBM results, and the square-dashed curve represents the results of the eVBM method. Randomization method in FSL-VBM was adopted for both VBM and eVBM, and eVBM was conducted according to Fig. 6.2
To better illustrate the behavior of the eVBM method compared with the conventional VBM, we compared the first group of control subjects (one peak in the histogram as shown in Fig. 6.3b) with the second group of controls (two peaks in the histogram, Fig. 6.3a) using VBM and eVBM. Figure 6.5b plots the total number of voxels above the threshold against the T value for both methods. Conventional VBM yielded more supra-threshold voxels than eVBM, suggesting that the conventional method did introduce false-positive results in the analysis. The results show that eVBM can reduce the number of false-positive differences in GM concentration. It demonstrates that this method may be of value in the investigation of sMRI gray and white matter abnormalities in a variety of brain diseases. Because it takes advantage of the properties of VBM while improving sMRI histogram distribution at the same time, the proposed method is a powerful approach for analyzing gray matter differences in sMRI. The suggested eVBM approach has at least two advantages. Firstly, this method is easy to implement and apply to sMRI data. In addition, eVBM is not sensitive to the image histogram difference; this difference includes both within-group and between-group differences. It overcomes the within-group difference, which could cause false-positive results. Histogram matching can be regarded as one method of preprocessing in VBM analysis. In that respect our results show that preprocessing can have a major impact on the VBM results (for more discussion about the method, see [28] and references therein).
6.3 Longitudinal VBM and Its Application to AD Study
We have shown that VBM is a powerful method for studying gray matter differences for clinical study, but this method cannot address the problem of disease progression. As an example, for AD study, although such studies identify regions implicated in the neuropathological processes associated with AD (Fig. 6.4), they can shed no light on individual change over time. To overcome this limitation, great efforts have been devoted to longitudinal sMRI to study AD progression [29–38


Stay updated, free articles. Join our Telegram channel

Full access? Get Clinical Tree


