LEARNING OBJECTIVES
1. Factors to consider when doing breast magnetic resonance imaging (MRI)
• Magnet field strength
• Temporal and spatial resolution
• Scanning plane (axial, sagittal, coronal)
• Unilateral versus bilateral studies
• Contrast administration
• Fat suppression
• Kinetic curve analysis
• Timing of study to the menstrual cycle
Screening versus diagnostic MRIs
• Patient issues (breast size, claustrophobia)
2. Common artifacts that may be seen when doing breast MRI
3. Contraindications to breast MRI
4. Indications for breast MRI
5. Lesion evaluation, description, and differentials considerations
6. Masses (location, size, shape, margins, enhancement features, T1- and T2-signal characteristics)
• Non–mass-like enhancement (distribution modifier, enhancement features)
7. Foci
If one considers the current breast imaging technologies, contrast-enhanced breast MRI has the highest sensitivity rates for the detection of invasive and intraductal cancers. The sensitivity ranges from 89% to 100% (1–3). False-negative MRI studies are not common but have been reported in patients with ductal carcinoma in situ (DCIS), low nuclear grade invasive lesions, or, rarely, in women with early and strong parenchymal enhancement in whom a small enhancing lesion may be masked (4). The reported specificity for breast MRI is variable and ranges from 37% to 97%; this high variation likely relates to differences in imaging protocols and the diagnostic criteria used in the various studies (1–3). The specificity is likely to improve as MR systems improve spatial and temporal resolution, experience with breast MRI increases, and when information other than just the presence of enhancement is factored into the consideration of differentials and management decisions.
In considering a breast MRI program, it is our contention that this is best handled by breast imagers who can provide the needed correlation between physical examination, mammography, ultrasound, MRI, imaging-guided biopsies, and pathology. The integration of breast MRI, and with it MRI-guided breast biopsies, into preexisting breast imaging programs can progress rapidly and seamlessly. The need for concurrently developing MRI-guided biopsy capability is apparent if you consider that breast MRI is done primarily for the early detection of breast cancers not depicted by other modalities. In this situation, patients with enhancing abnormalities not identified mammographically, or on ultrasound, will require biopsies done with MRI guidance (see Chapter 12).
The ability to schedule patients expeditiously is critical, particularly those in whom the MRI is being done for preoperative staging purposes following a breast cancer diagnosis. Likewise, if an MRI-guided biopsy is indicated in any of these patients, scheduling the biopsy needs to be prompt. We schedule all of our patients with a new breast cancer diagnosis for a breast MRI within a day or two of their initial diagnostic biopsy and ahead of the appointment with the surgeon. If, on the basis of the MRI, a biopsy or ultrasound evaluation is indicated, we contact the patient directly to expedite scheduling the needed evaluation. We also contact patients directly when a screening MRI is indicated following a screening mammogram (e.g., known BRCA carrier, first-degree relative of a known BRCA carrier, multiple first-degree relatives with premenopausal breast cancer, and patients with a history of chest wall radiation during adolescence). Our office personnel obtain insurance authorization for these patients prior to scheduling the MRI. In women with a history of claustrophobia we prescribe medications (Ativan, less commonly valium) so as to relax the patient and minimize the likelihood of motion during the study.
TECHNICAL CONSIDERATIONS
When thinking about the implementation of a breast MRI program, several decisions regarding scanning parameters need to be considered. These include field strength, temporal and spatial resolution, scanning plane (sagittal, coronal, and axial), bilateral or unilateral scanning, contrast administration, fat suppression, kinetic analysis, and timing of the study in premenopausal women (1). Analogous to mammography and ultrasound, MRI provides morphologic information regarding lesions in the breast. Unlike these modalities, MR affords functional information (kinetic curves) as well as the T1- and T2-relaxation times of lesions; this functional information is critical in the diagnostic evaluation of lesions.
A characteristic that is universal to viable malignant lesions is the ability to stimulate the development of their own vascular supply (e.g., angiogenesis) that is not under usual physiologic control mechanisms (1,2). The capillary leakage and arteriovenous shunting characteristic of these abnormal vessels underlie the described kinetic features (kinetics) of invasive lesions seen on breast MRI, and provides the needed differentiation from normal tissue and benign lesions. Although certain enhancement patterns are consistently associated with most malignant lesions, they are not a pathognomonic finding for breast cancer. They can also be seen in normal breast tissue under hormonal stimulation, inflammatory processes, lymph nodes, and benign tumors such as papillomas, fat necrosis, and fibroadenomas. Conversely, by virtue of their growth patterns, some breast cancers (DCIS low nuclear grade and rarely invasive lobular and tubular carcinomas) can demonstrate variable angiogenic activity, making detectability on MRI a challenge.
With this in mind, consider the importance of temporal resolution. To image malignant lesions optimally, the breasts need to be scanned rapidly enough to capture their transient enhancement in a background of progressive parenchymal enhancement. Consequently, the kinetic (dynamic) evaluation of lesions is predicated on the ability to rapidly, repeatedly, and with minimal patient motion, obtain the same stack of images several times after the administration of contrast. Similarly, the ability to characterize morphologic features is maximal in the early postcontrast phase of the study before washout of contrast occurs and surrounding parenchyma enhances. For breast MRI, a temporal resolution of 1 to 2 minutes (ideally closer to 1 minute) is optimal (1).
Spatial resolution is important in the morphologic characterization of lesions; however, spatial resolution comes at the expense of temporal resolution. Within the constraints imposed by an optimal temporal resolution (1 to 2 minutes), maximize the matrix for spatial resolution. An acquisition matrix of 512 × 512 for transverse imaging with a field of view (FOV) ranging from 320 to 350 translates into plane pixel sizes of 0.5 × 0.5 to 0.8 × 0.8 mm and a section thickness (through-plane pixel size) of 1 to 3 mm (1).
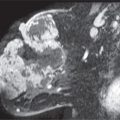
A magnet with field strength of 1.5 T is preferred. As field strength decreases, so does the signal-to-noise ratio, potentially leading to a compromise in diagnostic information. Higher field strengths (e.g., 3 T systems) improve spatial and temporal resolution; however, it is not clear how much additional clinical information is provided by higher field strengths (1). A dedicated breast coil and attention to the positioning of the breasts in the coil are imperative in obtaining optimal images of the breasts. Unfortunately, only one coil size is currently available to encompass the significant variation in breast and lesion size encountered in practice. In patients with large breasts or lesions, positioning may be compromised and artifacts may be seen (Fig. 5.1). Similarly, with some units, patient size and body weight impose limits on our ability to scan all patients.
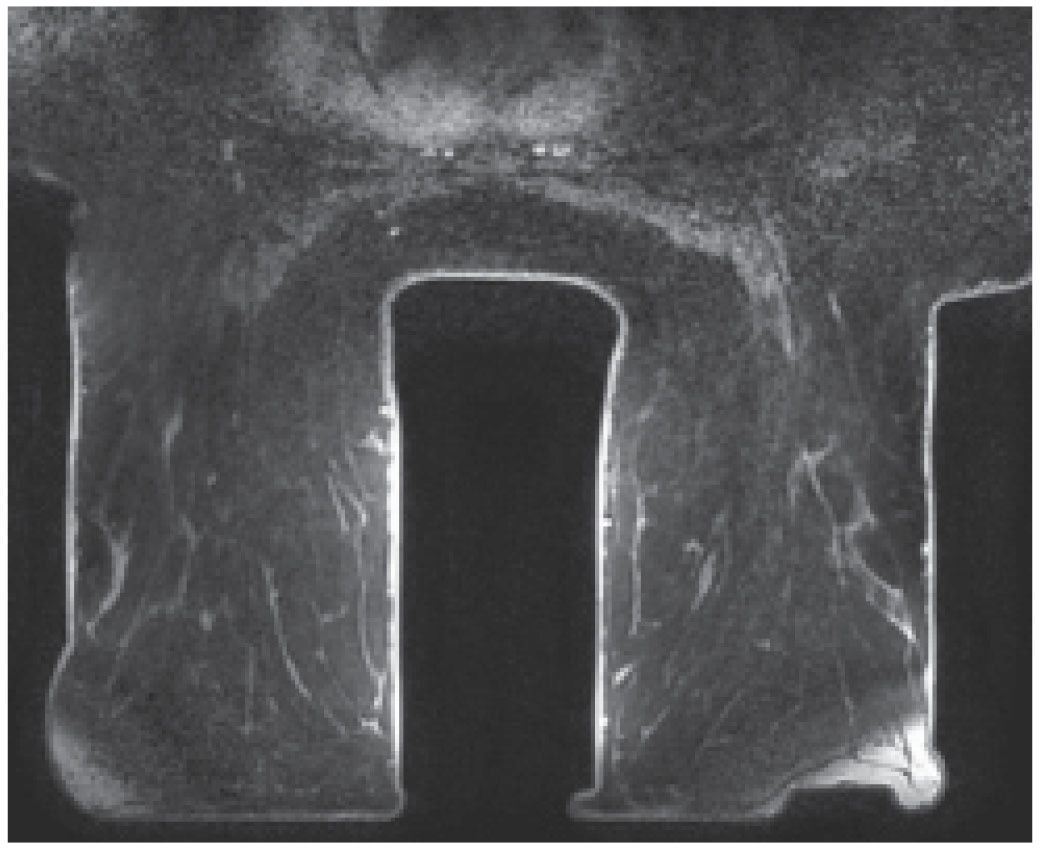
FIG. 5.1 • Coil size limitations. MRI, axial T1-weighted image postcontrast. The anterior aspect of the breasts is compressed and flattened against the coil with associated signal flaring. The distortion and compression of tissue anteriorly in these patients could theoretically impact enhancement and our ability to detect lesions. Currently, the dedicated breast coil comes in one size and shape. For women with larger breasts, large lesions, those with variable amounts of axillary tissue or an increased distance between the breasts, limitations in positioning may be apparent and cannot always be addressed optimally. Sometimes, you can use pads to lift the patient up away from the table; however, this can result in exclusion of axillary and posterior tissue. Ideally, different sized breast coils will be developed.
The dose of gadolinium (T1-shortening agents) used ranges from 0.1 to 0.2 mmol perkg of body weight. A power injector is used at a rate of 2 to 3 mL per second followed by a 20-mL saline flush. These contrast agents are fairly well tolerated with less than 2% likelihood of adverse reactions. Renal excretion of the gadolinium is dependent on glomerular filtration rates (GFR). Contrast administration is contraindicated in patients with GFRs lower than 30 mL per minute/1.73 m2. Nephrogenic systemic fibrosis (NSF) is a rare complication related to gadolinium agents in patients with poor renal function (5,6). Patients with NSF develop skin thickening in the extremities, less commonly the torso, and usually there is sparing of the face. With progression, patients develop joint contractures, and in some, systemic involvement may lead to a cardiomyopathy, pulmonary fibrosis, pulmonary hypertension, diaphragmatic paralysis, and death. Point of care testing for eGFR is done on all patients before a breast MRI is done. In patients with eGFRs less than 30 mL per minute/1.73 m2, MRI is deferred pending discussion with the clinicians and patient. Rarely, if the patient is undergoing dialysis, we do the MRI immediately preceding a scheduled dialysis appointment.
We image the breasts in the axial plane obtaining a precontrast set of axial images (Vibrant) with contiguous 1-mm slice thickness followed by five stacks of images postcontrast for the dynamic T1-weighted fat-suppressed phase of the study. We also obtain axial non–fat-suppressed T2-weighted images as well as sagittal fat-suppressed T2-weighted and non–fat-suppressed T1-weighted images. The axial plane used for the dynamic sequences is analogous to craniocaudal images, and simultaneously scanning the breasts enables us to evaluate for symmetry. We do not do unilateral MRIs. Since contrast is being administered, it makes sense to evaluate both breasts; additionally, the ability to compare one breast with the other is an important reason to do bilateral studies. Scanning in the axial or sagittal planes facilitates characterization of the anterior to posterior extent of disease, a question that is particularly important in patients with DCIS (1,2). In reviewing images, the maximum intensity projection (MIP), subtraction images, multiplanar reconstructions in coronal and sagittal planes, kinetic curves, and color overlays are routinely reviewed for detection and characterization of lesions. Multiplanar reconstructions are particularly helpful in evaluating areas of enhancement to determine whether they represent parenchyma, a mass, or a non–mass-like enhancement. Reconstructions are also helpful in assessing lymph node morphology (e.g., cortical bulging).
Contraindications to breast MRI include the presence of a pacemaker, artificial heart valves, surgical clips in the heart or brain made of MR-incompatible materials, recent heart or brain surgery, cochlear implants, insulin pumps, shrapnel in the orbits, some of the tissue expanders used for breast reconstruction, weight greater than 300 pounds, claustrophobia not controlled with medications, and, as mentioned previously, poor renal function.
When scheduling high-risk premenopausal women for a screening MRI, consider timing it to the menstrual cycle. Breast tissue is most quiescent during the second week of the cycle. Consequently, if a patient’s cycle is predictable, screening MRIs should be timed to the second week of the cycle to minimize the enhancement of breast parenchyma sometimes seen when breast tissue is under hormonal stimulation. For patients with breast cancer, in whom the MRI is being done for staging purposes, it is not usually practical to time the MRI evaluation to the patient’s cycle.
ARTIFACTS
As with any imaging modality, meticulous attention to detail is imperative in obtaining the highest quality images possible. We should never settle for mediocrity or suboptimal image quality and hide behind disclaimers. The technologists need to work closely with the patient so that during positioning the breasts are centered in the coil. Additionally, making sure the patient is comfortable before starting is important in minimizing the likelihood of motion. If the patient is claustrophobic, consider medicating her so she is more relaxed and less likely to move during the study. Patients are given the option of using earplugs or headphones with music to mitigate the noises from the scanner. To the extent that motion can be minimized, particularly during the dynamic portion of the study, the better the quality of the images and resulting subtraction and kinetic curve evaluation.
The presence of ferromagnetic materials (e.g., surgical clips, sternal cerclage wires, etc.) leads to inhomogeneity in the magnetic field, resulting in susceptibility artifacts. These are noted as signal voids with surrounding high signal intensity and distortion of the image; the amount of distortion depends on the shape and composition of the metallic object (Fig. 5.2). Linearly oriented metallic susceptibility artifacts in lesions are common following core needle biopsies; these are not perceptible mammographically but presumably result from tiny metallic fragments deposited in the lesion during the biopsy (Fig. 5.3). Metallic artifacts are more pronounced in higher magnetic fields (e.g., 3 T magnets) (7).
A dedicated breast coil is essential for breast MRI. The technologist needs to make sure the breast coil is plugged in and selected before scanning the patient. If the body coil is inadvertently used, low signal-to-noise ratio will result in grainy images (7). The anatomical area to be imaged must be included in the FOV, keeping in mind that the selected FOV will affect spatial resolution. Too small an FOV, however, may exclude tissue that needs to be evaluated and may result in wraparound artifacts. With a given matrix, a smaller FOV will improve the in-plane spatial resolution. When using the axial scan plane, the FOV needs to include tissue from the level of the clavicle to just below the inframammary fold, thereby enabling evaluation of the axillae and breasts.
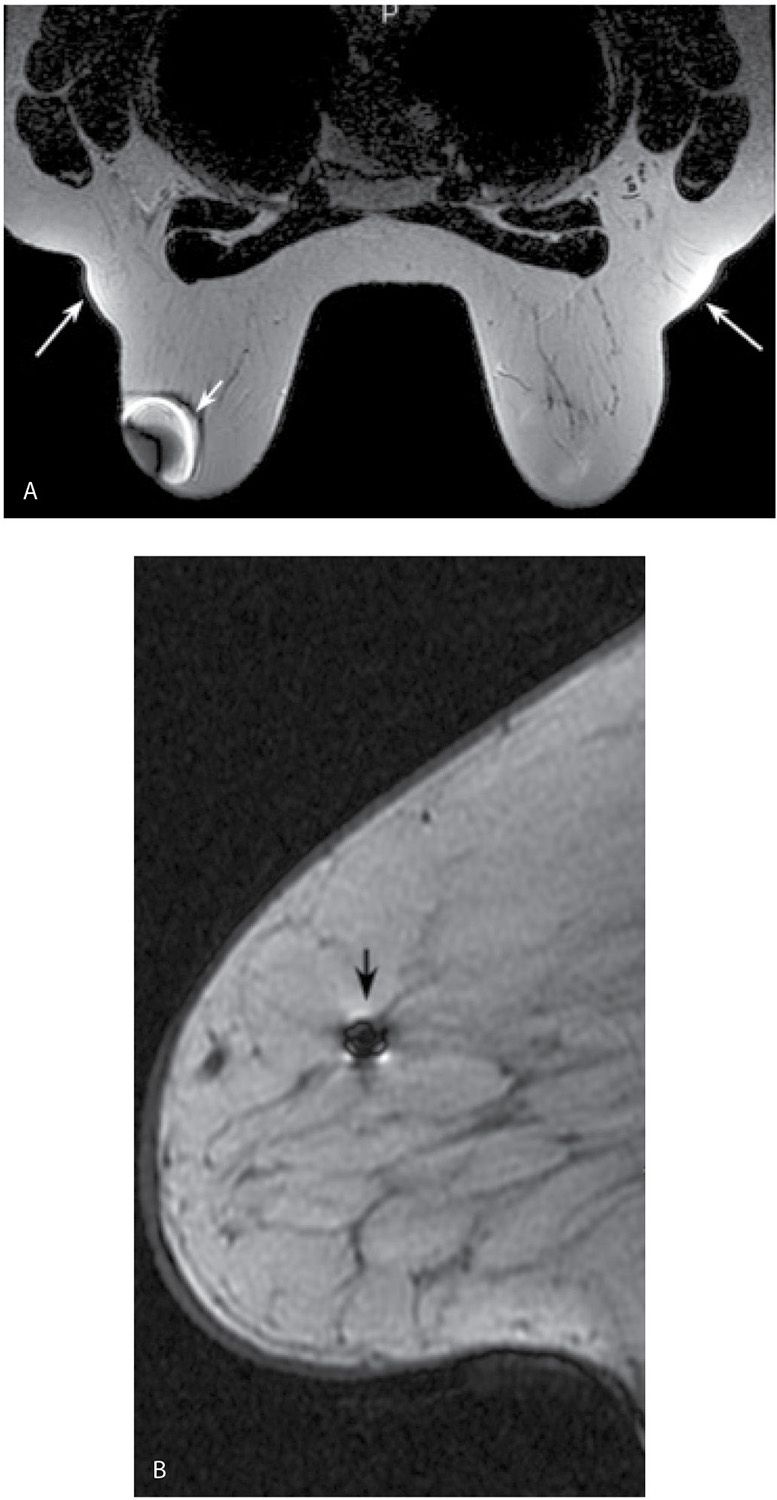
FIG. 5.2 • Bloom artifact resulting from ferromagnetic objects. A: MRI, axial T2-weighted image. Bloom artifact (short arrow) on the left resulting from a metallic BB on the patient’s breast. This limits the evaluation of tissue in this portion of the left breast. The patient’s MRI appointment followed evaluation in breast imaging where a metallic BB was used to mark an area of concern; the metallic BB was not removed after the mammogram. Note axillary fat “bulging” (long arrows) out from the coil with signal flaring. B: MRI, sagittal non–fat-suppressed T1-weighted image in a different patient. Bloom artifact (arrow) resulting from a biopsy clip in the breast.
Fat suppression, particularly for the dynamic portion of a study, facilitates the detection of enhancing lesions. If fat suppression is not used, the subtraction images become critical in the assessment of smaller areas of enhancement (Fig. 5.4); for optimal subtraction, patient motion needs to be minimized. After our initial experience with using no fat suppression for the dynamic sequences and a slice thickness of 2 mm, we have switched to the routine use of fat suppression for the dynamic sequences and a 1-mm slice thickness. Homogeneous fat suppression may be difficult to obtain, particularly in women with predominantly fatty tissue (Fig. 5.5A) and those with implants (Fig. 5.5B). The software in most MRI units automatically identifies the water peak as the highest signal peak and suppresses the fat by applying saturation pulses at a frequency of 3.5 ppm (224 Hz in a 1.5 T magnet), representing the chemical shift between water and the methyl group of fat. In predominantly fatty breasts, the software may incorrectly identify the fat peak as that of the water peak, resulting in the application of fat suppression pulses at an incorrect frequency (7). Suboptimal fat saturation may also result from inhomogeneities in the magnetic field that may be corrected by shimming of the magnet. Signal flaring (Fig. 5.2B; also see Figs. 7.72C–E, 8.13B, and 8.37E) simulates poor fat saturation but is related to the proximity of the breast to the coil; placing a cushion between the breast and the coil can minimize signal flaring (7).
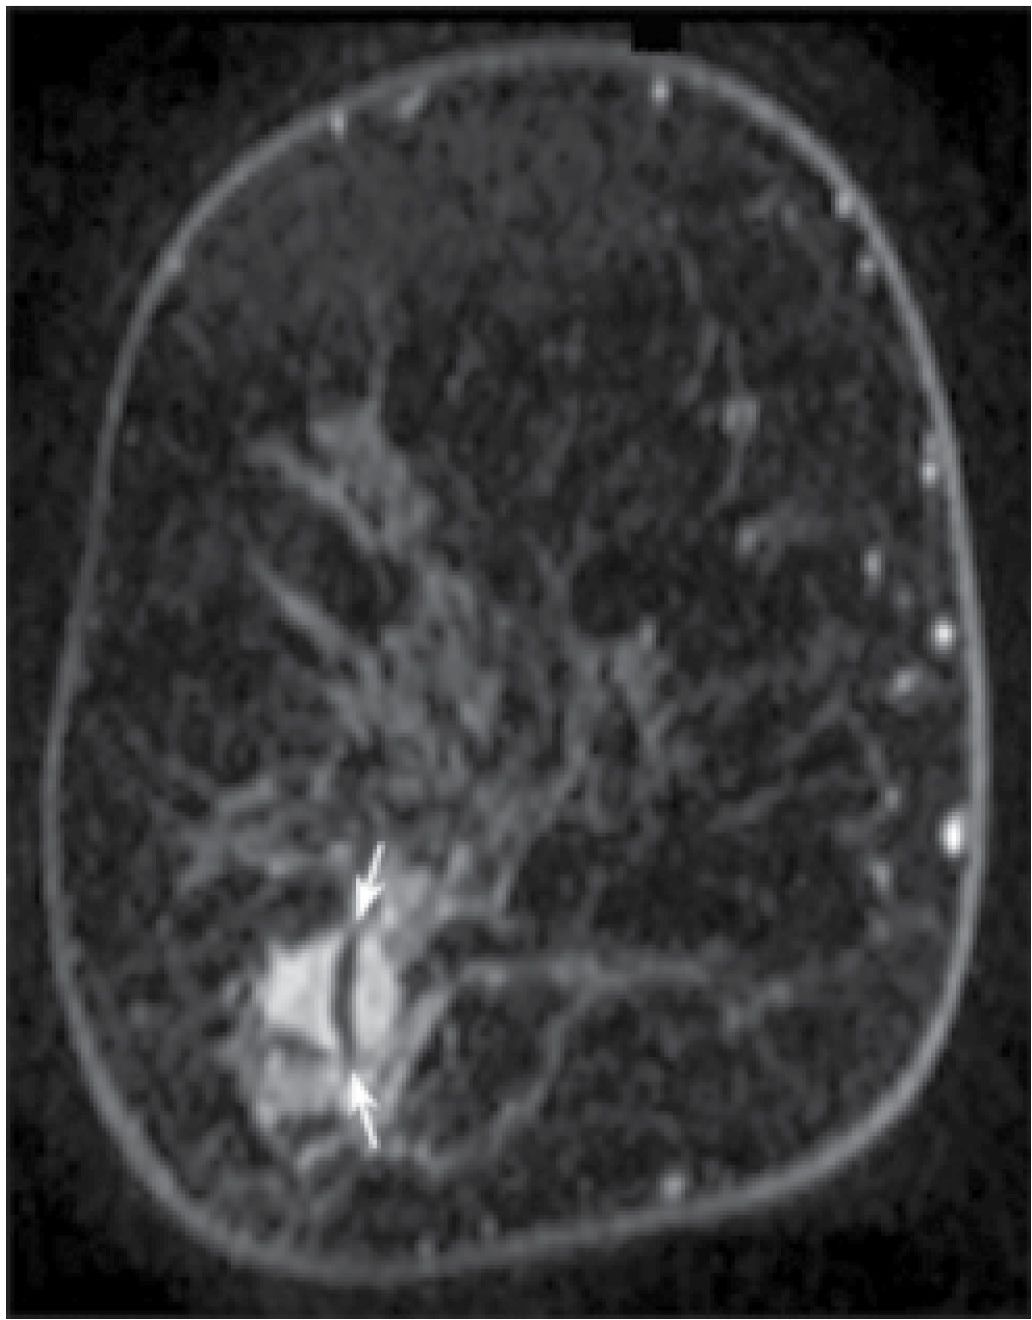
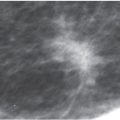
FIG. 5.3 • Post-biopsy needle artifact, invasive ductal carcinoma high nuclear grade. MRI, T1-weighted, postcontrast coronal reconstruction of the right breast posteriorly. An irregular mass with heterogeneous enhancement and spiculated margins is imaged in the lower outer aspect of the right breast corresponding to the site of a known invasive ductal carcinoma diagnosed in a 51-year-old patient following an ultrasound-guided biopsy. A linear signal void (arrows) through the mass is thought to reflect tiny metallic fragments (shavings) from the needle used for the ultrasound-guided core biopsy. This is a common observation if the MRI study is done immediately following imaging-guided biopsies. The size of the signal void varies depending on the size of the needle used for the biopsy (e.g., 14G vs. 12G).
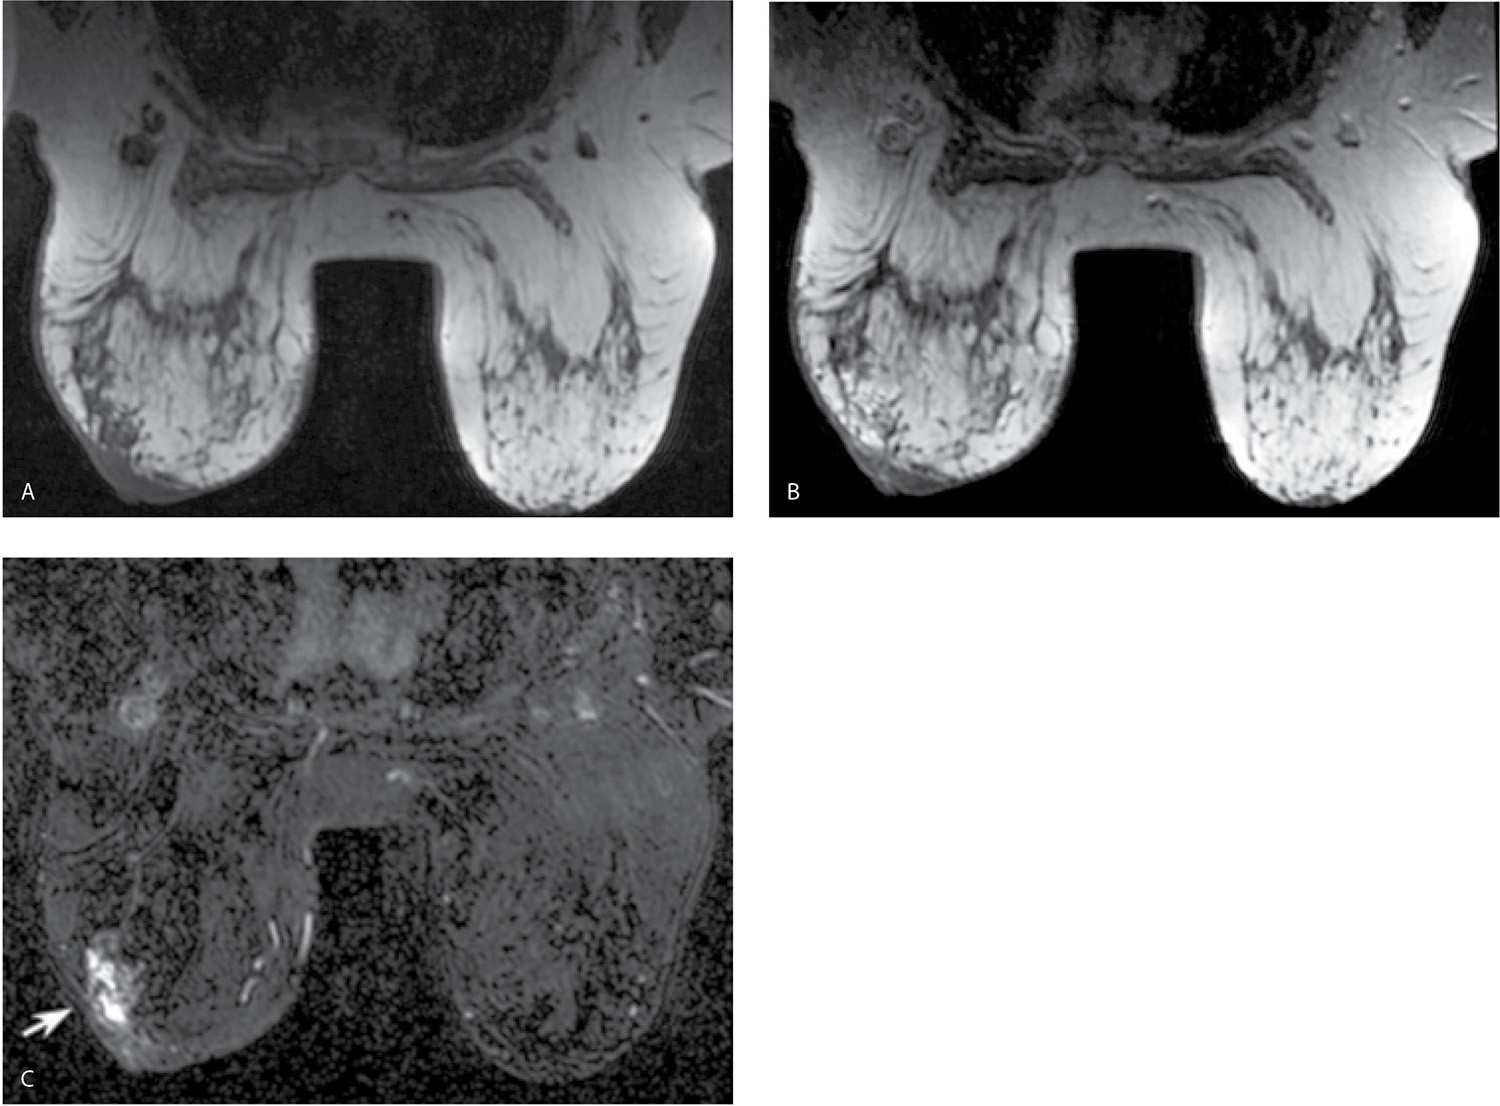
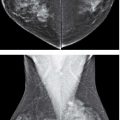
FIG. 5.4 • Non–fat-suppressed T1-weighted images done using a 2-mm slice thickness. A: MRI, axial image, precontrast. The left breast is smaller and wider with skin thickening noted anteriorly. Suboptimal positioning of the right breast in the coil is such that tissue in the axillary tail is bulging out of coil; signal flaring is apparent along the edge of this tissue. B: MRI, axial image, postcontrast at the same level shown in part A. With no fat suppression and 2-mm scan thickness, it can be difficult to establish the presence of enhancement. Similarly, our ability to characterize the morphologic features and distribution of the enhancement is limited. Under these circumstances, subtraction images are critical. C: MRI, subtraction image obtained from the images shown in parts A and B. Non–mass-like enhancement (arrow) is present in the left breast anterolaterally. If, as in this patient, the dynamic sequences are done with no fat suppression, you are largely dependent on the subtraction images. Under these circumstances, patient motion can significantly limit the evaluation of the subtractions. Additionally, the 2-mm slice thickness limits morphologic evaluation of lesions. We are now routinely using fat suppression (Vibrant) for the dynamic sequences and scanning at a slice thickness of 1 mm.
As mentioned previously, the resonant frequency of the hydrogen in fat differs from that in water by 224 Hz in 1.5 T systems. Chemical shift artifacts reflect spatial misregistrations between fat and glandular tissue (water) in the frequency encoding direction. This artifact can be overcome when fat suppression is used or by increasing the bandwidth used in image acquisition (7).
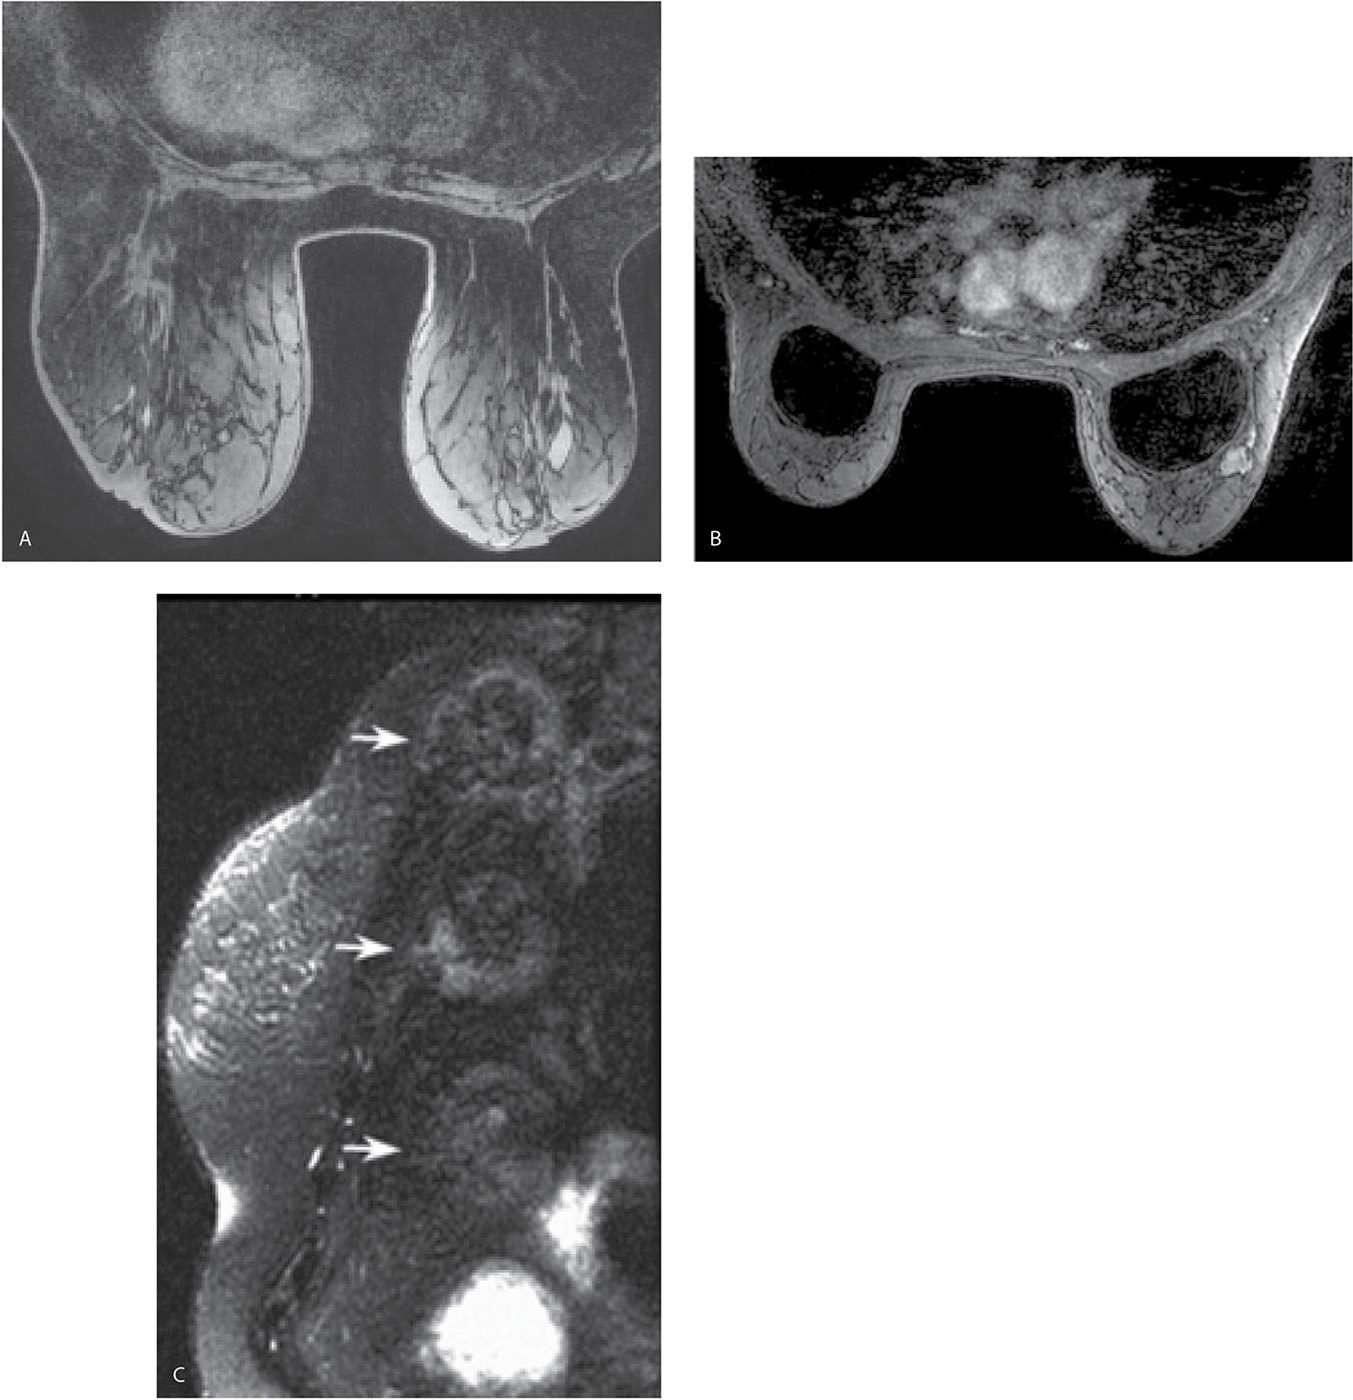
FIG. 5.5 • Poor fat saturation and ghosting. A: MRI, precontrast axial T1-weighted image demonstrating poor fat saturation in a patient with predominantly fatty tissue. B: MRI, T1-weighted image, postcontrast in a patient with implants. Poor fat saturation is present. A mass with heterogeneous enhancement and lobulated margins is present, abutting the right implant anterolaterally. Although adjustments are made in an effort to improve fat saturation before the contrast is given, poor fat saturation persists on the postcontrast images. In patients with implants, adequate fat saturation can be difficult to obtain. C: MRI, sagittal reconstruction. Ghosting resulting from the stomach is seen as a uniformly repeating high signal intensity artifact (arrows) simulating the size and shape of the stomach.
Ghosting artifacts may be apparent related to blood vessel, cardiac, and pulmonary pulsation. High signal intensity, uniform spacing, and sometimes blurring reflecting motion are the characteristics of ghosting artifacts (Fig. 5.5C). These are propagated in the phase-encoding direction so that for breast imaging in the axial and sagittal planes, the left-to-right direction is chosen as opposed to the anterior–posterior direction (e.g., A-P phase encoding results in superimposition of cardiac and vascular pulsations on the breasts). Wraparound artifact is seen when signal-producing tissue is positioned outside the FOV. This type of artifact occurs primarily in the phase-encoding direction and is also known as aliasing or phase wrap (7).
LESION EVALUATION
Analogous to what is discussed with mammography and ultrasound, breast MRIs need to be evaluated for overall quality prior to assessing the images for possible pathology. Are the breasts well positioned in the coil (Fig. 5.6A, B), and has all of the breast tissue been imaged? Is there motion (Fig. 5.6C–E)? Is fat saturation optimal (Fig. 5.5)? Is contrast present (e.g., adequacy of contrast bolus) (Fig. 5.7)? Are there any other artifacts that may affect diagnostic information (Fig. 5.2A)? All MRI studies are reviewed in conjunction with a current mammogram, breast ultrasound, if the patient has had one, and any relevant history (e.g., family history of breast cancer, BRCA testing results, prior breast or axillary surgical procedures with pathology and type of implants in women with implants).
In patients with images of diagnostic quality, I usually start by perusing the MIP and subtraction images, as a quick way of establishing the complexity of the study, and the amount of time it will take for me to review the study meticulously. I carefully review all potential lesions in the dynamic portion of the study, toggling between pre- and immediately postcontrast images, followed by sagittal and coronal reconstructions of the area in question, kinetic curve evaluation as well as the precontrast T2- and T1-signal characteristics (Fig. 5.8). In establishing the presence of enhancement, be sure to review the subtraction images and toggle between pre- and postcontrast images. Do not assume that a high T1-signal postcontrast is enhancement without assessing the T1-signal intensity of the area precontrast (Fig. 5.9). In considering kinetic curves, it is important to recognize that these can be variable within a given lesion, depending on where the region of interest (ROI) marker is placed in the lesion. Place the ROI cursor at various locations in the area of enhancement being evaluated and scroll into and out of the plane before formulating an opinion regarding the predominant morphology of the kinetic curve for a given lesion.
If enhancement is present, you need to determine whether it is normal breast parenchyma or a lesion. Background parenchymal enhancement is relatively easy to recognize when diffuse (Fig. 5.10), bilateral, and progressive; however, it may pose more of a challenge when the enhancement is rapid and focal, often localized to the peripheral portions of the parenchyma (what we call parenchymal blushing). Focal parenchymal enhancement is usually planar, follows the shape of the tissue, and does not alter the contour of the parenchyma, particularly when the area is evaluated on reconstructions (e.g., axial, sagittal, and coronal planes). Background parenchymal enhancement is variable. It can be significant in some patients, minimal in others, and may vary with the menstrual cycle. Hormone replacement therapy may cause parenchymal enhancement that may be diffuse or focal, while tamoxifen usually decreases the background enhancement of the parenchyma. When tamoxifen therapy is stopped, background parenchymal enhancement may rebound (Fig. 5.11). Following radiation therapy, the affected breast often appears relatively quiescent when compared with the contralateral breast. If the area of enhancement in question is not parenchyma, what type of a lesion is it? Is it a mass? Is it non–mass-like enhancement? Or is it a focus?
Mass
Is the area of abnormal enhancement a mass? Is it space occupying, three-dimensional, and greater than 0.5 cm in size? With a mass, a correlate is usually identified on precontrast T1- and T2-weighted images (Fig. 5.12) (2,3,8). Globally, differential considerations for masses include benign solid masses, invasive breast cancer, or, uncommonly, metastatic disease. For a mass, size, shape (irregular, round, oval), margins (circumscribed, not circumscribed: irregular, spiculated), enhancement features (homogeneous, heterogeneous, rim enhancement, dark internal septations), precontrast T1- and T2-signal characteristics and location should be described (8) and considered in the generation of an appropriate differential. Although not often discussed, we also find the presence of asymmetric edematous changes in tissues surrounding the mass (Fig. 5.12C) and sometimes extending to the pectoral fascia (Fig. 5.13) and the muscle itself as a helpful sign commonly associated with high-grade malignant lesions.
When considering kinetic curves, you need to describe two components: the initial phase, which describes the steepness in the rise of the curve (slow, medium, and fast), and the delayed phase: does the initial uptake decrease rapidly (e.g., washout, type III)? Does it plateau (type II)? Or is there continuous enhancement (e.g., persistent, type I curve) (8); this latter type of curve most commonly reflects benign processes (Fig. 5.10C). Although type I and II curves are associated with malignant lesions (Fig. 5.8F), fibroadenomas in young patients, lymph nodes, fat necrosis, and papillomas may generate rapid washin and washout kinetics. Evaluating all of the features of the lesion (margins, T2 signal, presence of fat, etc.), and correlation with clinical, mammographic, and ultrasound findings is often needed to establish the likely etiology of the finding, and may mitigate the need to biopsy benign lesions with type I and II curves.
In evaluating an enhancing mass, the margin is one of the more reliable indicators of the underlying etiology (2). Benign lesions are more likely to have smooth margins (Fig. 5.14). When considering margins, keep in mind that our ability to characterize them is dependent on spatial resolution. With low-resolution images, irregular margins may appear smooth. Similarly, if there is any patient motion, evaluation of the margins of a mass on subtraction images may be misleading (2,3). The shape and margins of a mass are best evaluated on the first set of images postcontrast. With the progressive enhancement of surrounding tissue on subsequent image sets, evaluation of the shape and margins of a mass may be limited.
For masses that are greater than 1 cm in size, homogeneous enhancement is also a good indicator of a benign process. In masses that are less than 1 cm, this is not a reliable predictor since spatial resolution may affect the evaluation (2). Analogous to mammography, fat-containing masses are usually benign. Fat content can be established on fat-suppressed images in combination with unenhanced, non–fat suppressed T1 and T2 sequences.
Masses with high T2 signal are usually considered benign, provided the entire mass demonstrates a homogeneously high T2 signal. Invasive ductal carcinomas with areas of necrosis (Figs. 5.8 and 5.15), mucinous (Fig. 5.16; also see Figs. 8.26 and 8.27), papillary (see Figs 8.34 and 8.36), and metaplastic carcinomas, as well as phyllodes tumors (see Fig. 7.67) may all demonstrate internal areas of intermediate-to-high T2 signal, but in these lesions, the T2 signal is not homogeneously high and is focal in the mass. Cysts (Fig. 5.17; also see Fig. 7.44C, D) most commonly demonstrate a homogeneously high T2 signal. This may also be seen in myxoid fibroadenomas (see Fig. 7.59) (young fibroadenomas), lymph nodes (Fig. 5.18), and some papillomas (9,10).
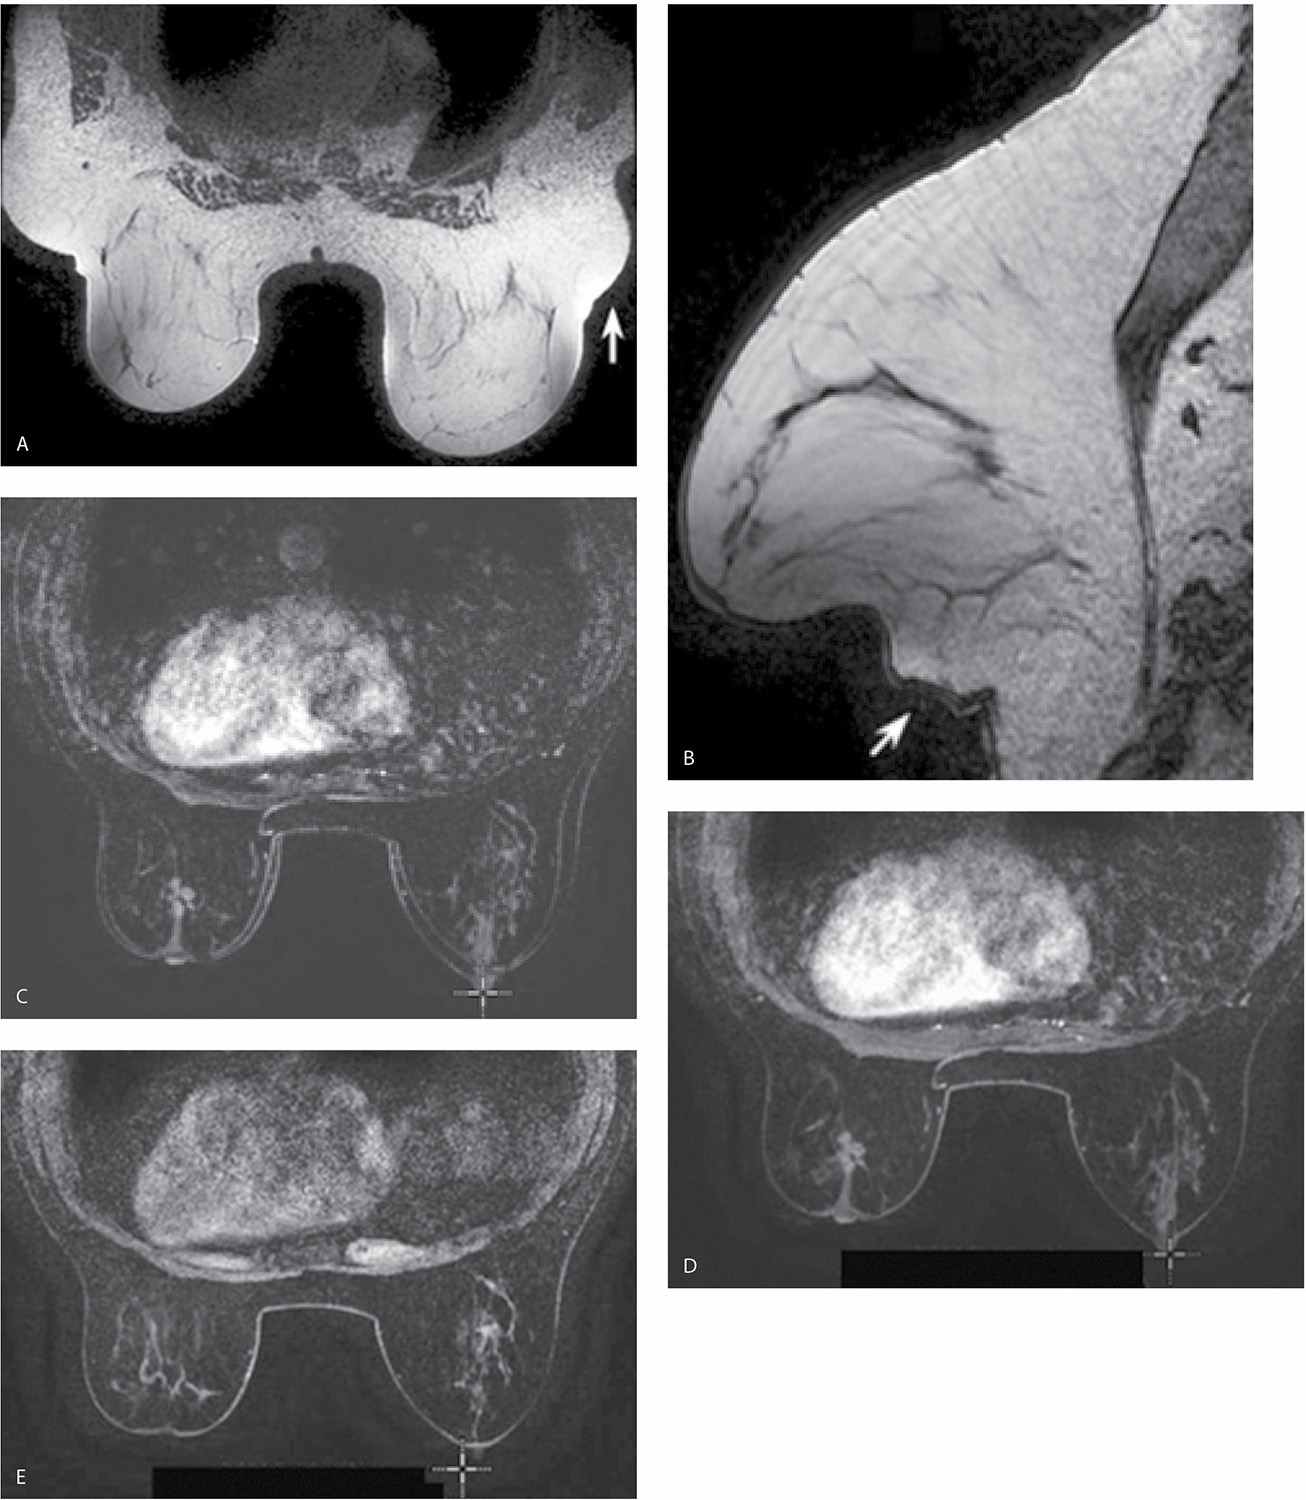
FIG. 5.6 • Poor positioning and motion. A: MRI, axial T2-weighted images. The patient is slightly rotated, and the right breast is not completely in the coil. The breasts need to be centered in the coil with every effort made to adequately include the breasts in the coil with no “bulges” (arrow) of tissue or skin folds. B: MRI, sagittal T1-weighted image with the inferior portion of the right breast (arrow) bulging out from the coil. Before scanning, make sure the patient is as comfortable as possible with the breasts centered and all breast tissue in the coil. C: MRI, subtraction image on a different patient. Notice doubling of skin line on the image consistent with motion between the pre- and postcontrast set of images. If a region of interest (ROI) is placed in a potential lesion, the kinetic curve will be notable for a steep initial phase (almost vertical). MRI, axial T1-weighted images, postcontrast (D) and Precontrast (E). To confirm the observation of motion on the subtraction images, or in trying to determine the presence of subtle motion, the cursor is placed on a clearly identifiable landmark such as the right nipple in this patient and toggled back and forth between pre- and postcontrast images. The position of the nipple relative to the cursor changes between pre- and postcontrast images consistent with patient motion. In evaluating and comparing the pre- and postcontrast images, differences in the appearance of the tissue included on the images can also be appreciated.
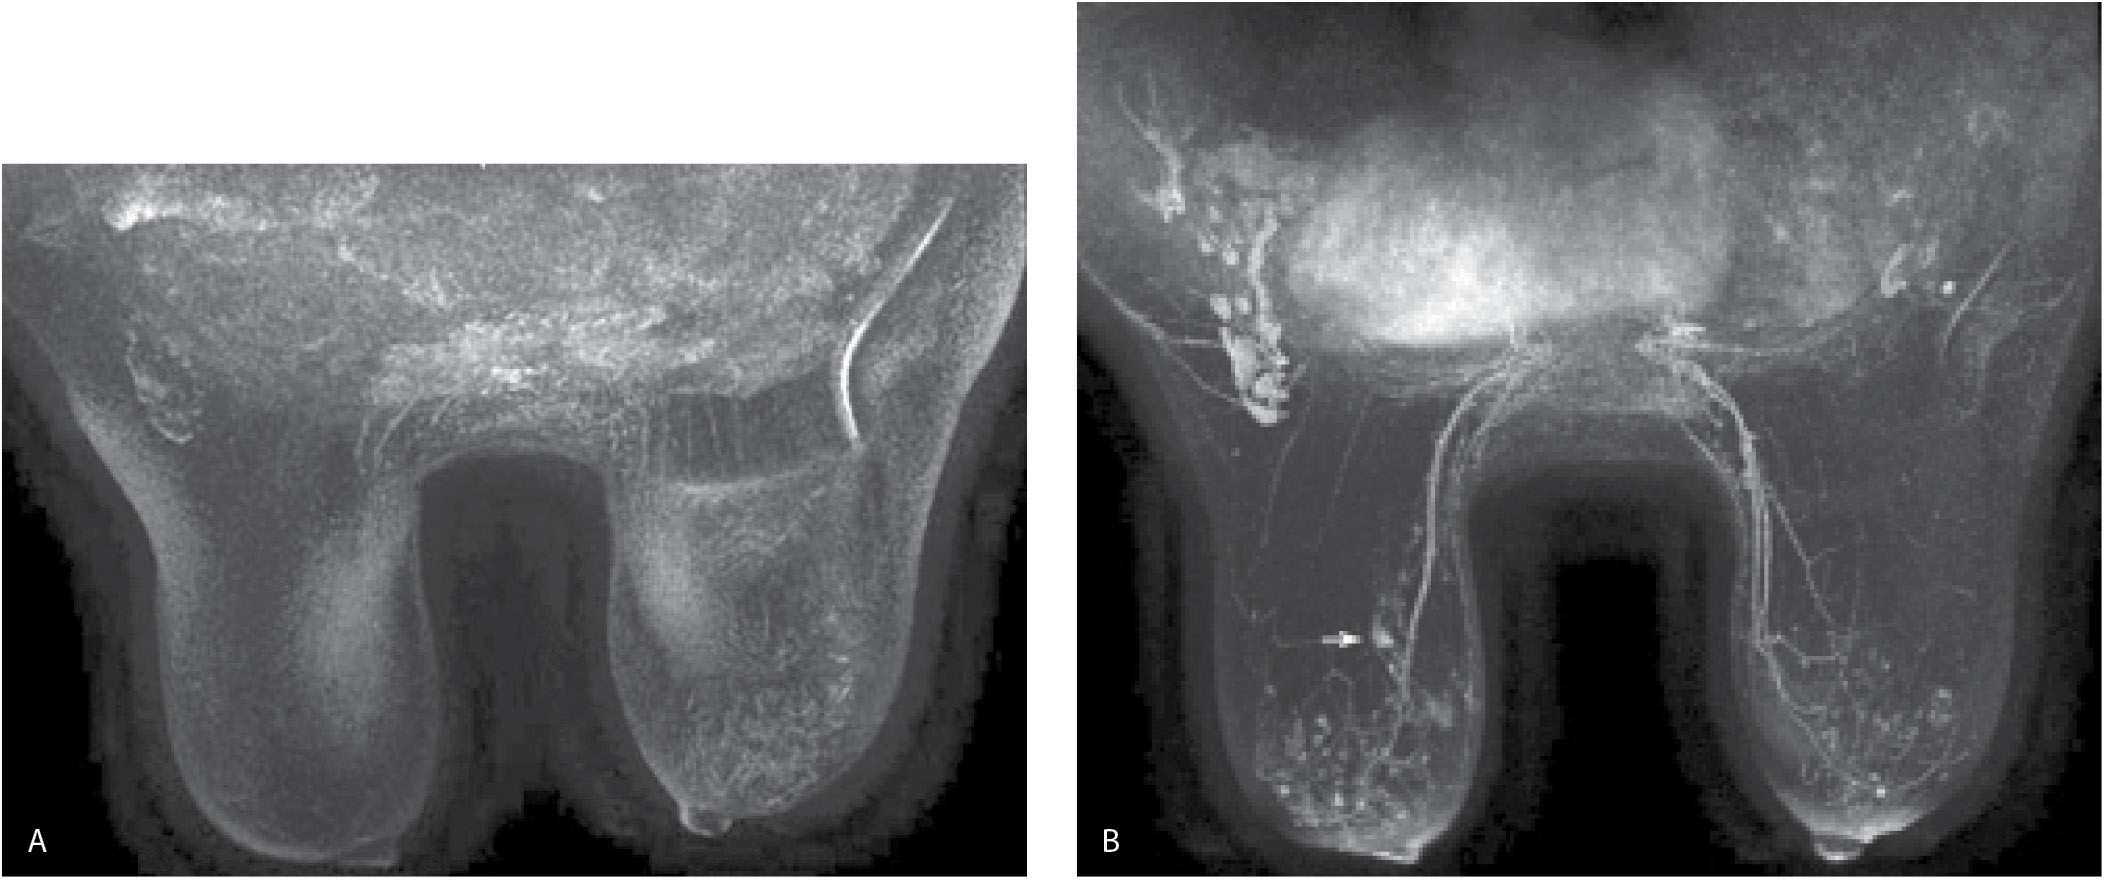
FIG. 5.7 • Contrast bolus adequacy. A: MRI, MIP. Initially you might think this is a normal study with quiescent breast tissue. Think again. Where is the heart? Are there no opacified vessels? What about axillary contents? As you review the images, the patient’s known cancer is not seen (is this a false-negative breast MRI?). Following questioning, the technologist states that he noted a “puddle of water” on the table when the patient sat up following the study. B: MRI, MIP image, repeat study 2 days after image shown in part A. The heart is now apparent, as are vessels and axillary contents. Normal enhancement is seen associated with the nipple and, most importantly, the patient’s known cancer (arrow) is now readily identifiable. As with mammography and breast ultrasound, before immersing yourself in the possible presence and evaluation of lesions, make sure the images are optimal. If they are not optimal, why not, and does the study need to be repeated?
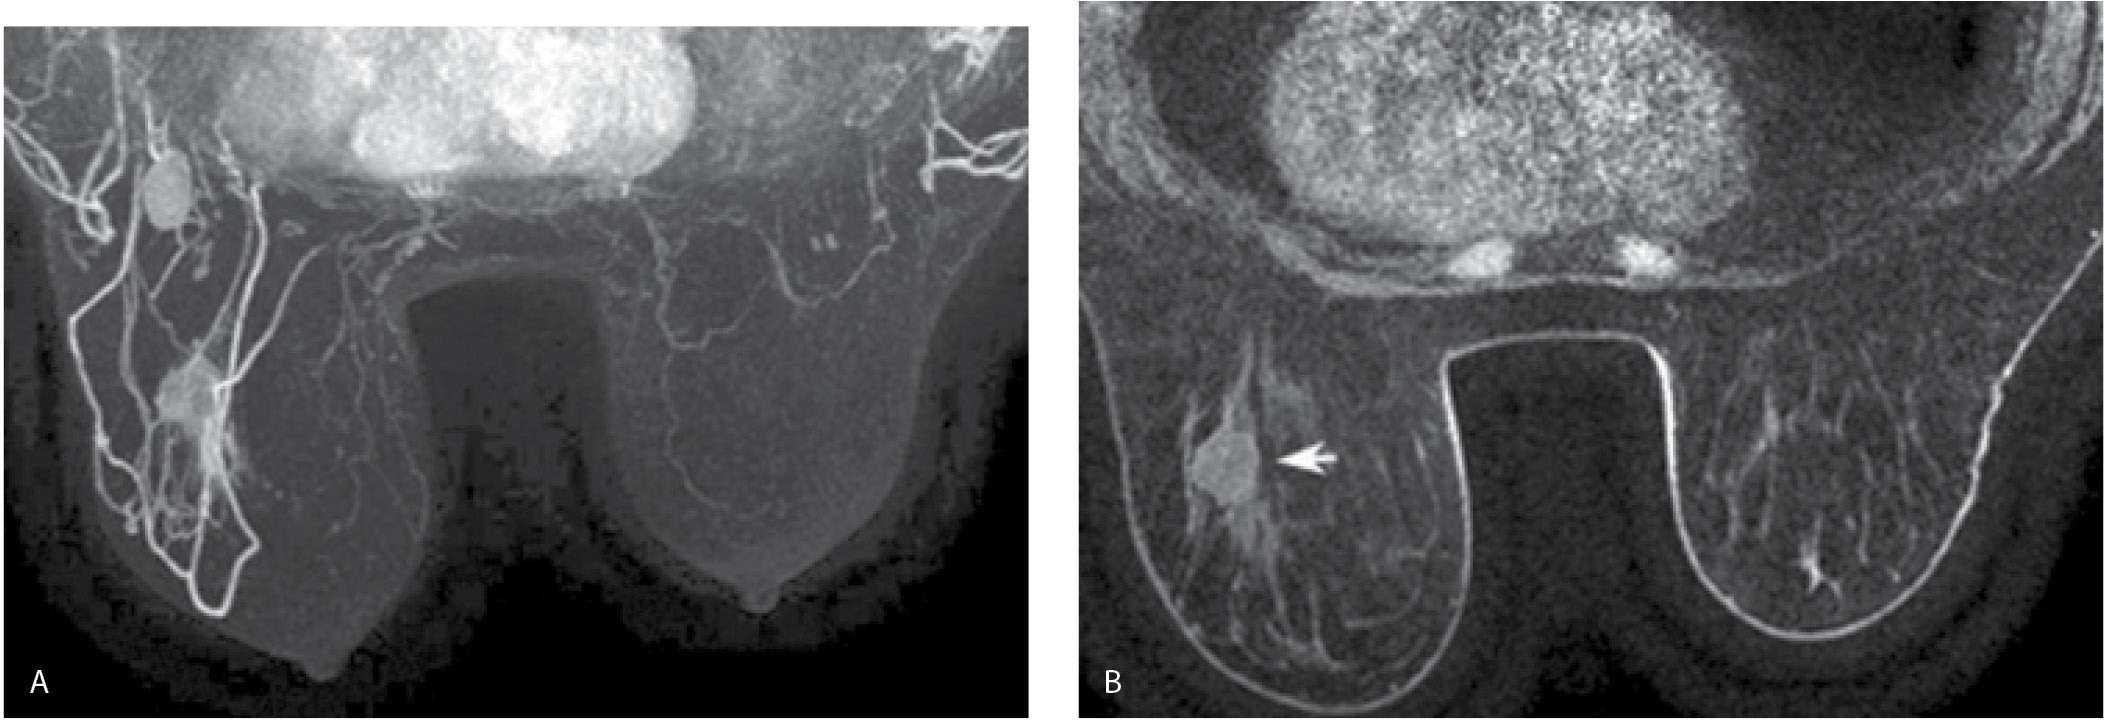
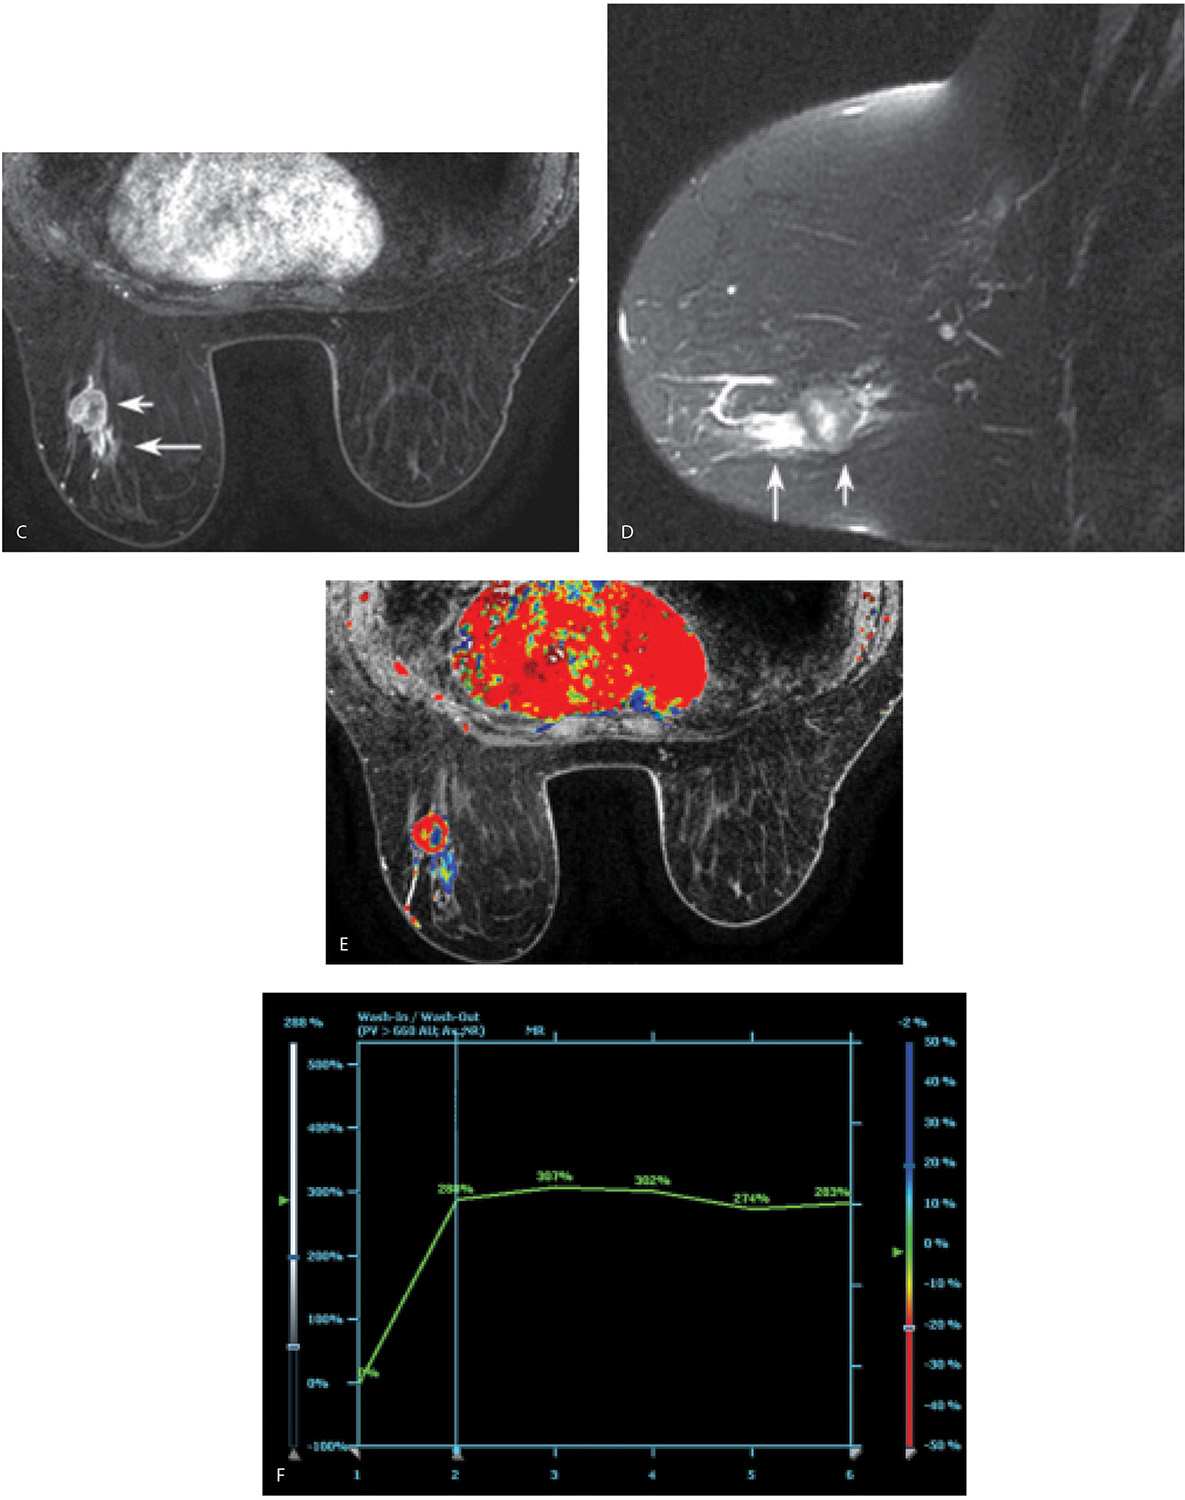
FIG. 5.8 • Invasive ductal carcinoma, not otherwise specified. A: MRI, MIP projection. After assessing image quality, I review the MIP, making sure to rotate the image. The relationship and superimposition of lesions can become apparent as the MIP image is rotated. In this patient, masses are apparent in the left breast and axilla; asymmetrically prominent venous structures are also noted in the left breast, a common observation in patients with breast cancer. The right breast appears normal. I follow the overview provided by the MIP image with a careful review of the subtraction images (not shown). MRI, axial T1-weighted precontrast (B) and MRI, postcontrast (C) images using a 1-mm slice thickness. With the identification of a possible lesion on the MIP and subtraction images, I review the postcontrast images and toggle back and forth between pre- and postcontrast images. In characterizing lesions (mass vs. non–mass-like enhancement), I also routinely do sagittal and coronal reconstructions (not shown). In this patient, a round mass (short arrow) with rim enhancement is imaged in the lower outer quadrant of the left breast at the junction of zones B and C. Additionally, heterogeneous non–mass-like clumped and linear enhancement (long arrow in C
Related posts:
Stay updated, free articles. Join our Telegram channel

Full access? Get Clinical Tree


