A. Subject contrast
–Depiction of lesions results from differential attenuation of the x-ray beam between the lesion and background tissues.
–Subject contrast is the difference in x-ray intensity that is transmitted through a lesion in comparison to the adjacent tissues.
–Important lesion characteristics include the size, density, and atomic number.
–Subject contrast can be positive if the lesion absorbs fewer x-rays compared to the surrounding tissues.
–Positive contrast will result in darker lesions in conventional radiographs.
–Contrast can be negative if the lesion absorbs more x-rays compared to the surrounding tissues.
–Negative contrast will result in lighter lesions in conventional radiographs.
–Contrast is reduced by scattered radiation captured by the image receptor.
–Use of scatter removal grids to improve contrast is substantial (i.e., hundreds of percent).
–Subject contrast is an essential prerequisite for producing image contrast.
–The presence of subject contrast, however, does not guarantee image contrast.
–Underexposed films look all white and thus display no image contrast, even when subject contrast is present.
B. Image contrast (screen–film)
–In screen–film radiography, image contrast is the difference in the film density of a lesion in comparison to the film density of the adjacent tissues.
–Image contrast in screen–film radiography is primarily dependent on film density.
–Underexposed films with low densities (e.g., <0.5 OD) have little image contrast.
–Overexposed films with high densities (e.g., >2.0 OD) show little image contrast under normal viewing conditions.
–Correct density in screen-film imaging (e.g., 1.5 OD) is achieved by having the correct image receptor air kerma (e.g., 5 μGy air kerma for a 200 speed system).
–Correct image receptor air kerma can be achieved by an automatic exposure control (AEC), with the x-ray duration terminated by a radiation sensor at the detector.
–Film contrast is determined by the slope (gradient) of the characteristic curve (Fig. 3.1).
–The film gradient is the mean slope between two specified film densities (normally 0.25 and 2.0 OD units).
–High film gradients are, by definition, high contrast films.
–Gradients >1.0 result in subject contrast being amplified.
–Radiographic films have gradients of ~2, but in mammography, characteristic curves have gradients >3.
C. Contrast and latitude
–Film latitude is the range of air kerma values that results in a satisfactory image contrast.
–Latitude is known as dynamic range in engineering.
–The latitude (dynamic range) of film is ~40:1.
–Film latitude and film gradient (contrast) are inversely related.
–The higher the film gradient, the narrower the range of air kerma values that result in a good image contrast.
–A wide-latitude film has a low film gradient, which results in a low contrast.
–Wide-latitude films are used for chest radiographs because of large differences in air kerma between lungs and mediastinum.
–High-contrast films are used in mammography.
–Breast compression reduces variation of air kerma in mammography, and permits the use of high-contrast film.
D. Contrast and digital imaging
–Image contrast in digital imaging is the difference in the monitor brightness of a lesion in comparison to the monitor brightness of the adjacent tissues.
–Displayed image contrast is the result of subject contrast, together with the effect of the recording device and digital image processing.
–Monitor display characteristics and window control settings also affect display contrast.
–Displayed contrast in digital imaging can be controlled by the operator by adjusting the display level and display window width.
–Increasing the window width will generally reduce display contrast and vice versa.
–It is possible to record images with a wide dynamic range receptor and then display them with a narrow window to enhance contrast in the displayed image.
–In chest CT, a narrow window offers excellent soft tissue contrast, but the lungs become invisible (all black).
–Use of a wider window in chest CT permits visualization of most tissues, but the contrast between soft tissues is markedly reduced.
–Digital imaging modalities permit good contrast over all the image data by viewing multiple images.
E. Contrast and photon energy
–For a given lesion, subject contrast is primarily affected by the photon energy.
–The average photon x-ray energy is increased by increasing the x-ray tube voltage (kV) or by adding filters.
–Reducing the ripple on the x-ray tube voltage (e.g., using a constant potential) also increases the average photon energy.
–Low photon energies result in high subject contrast and vice versa.
–Figure 6.1 shows how subject contrast depends on the kV.
–At low kV, intensity differences between adjacent tissues are relatively high, but these differences are markedly reduced at higher photon energies.
–As photon energy increases, contrast decreases because of increased x-ray photon penetration.
–For correctly exposed (and displayed) imaging systems, changes in subject contrast will generally result in corresponding changes in image contrast.
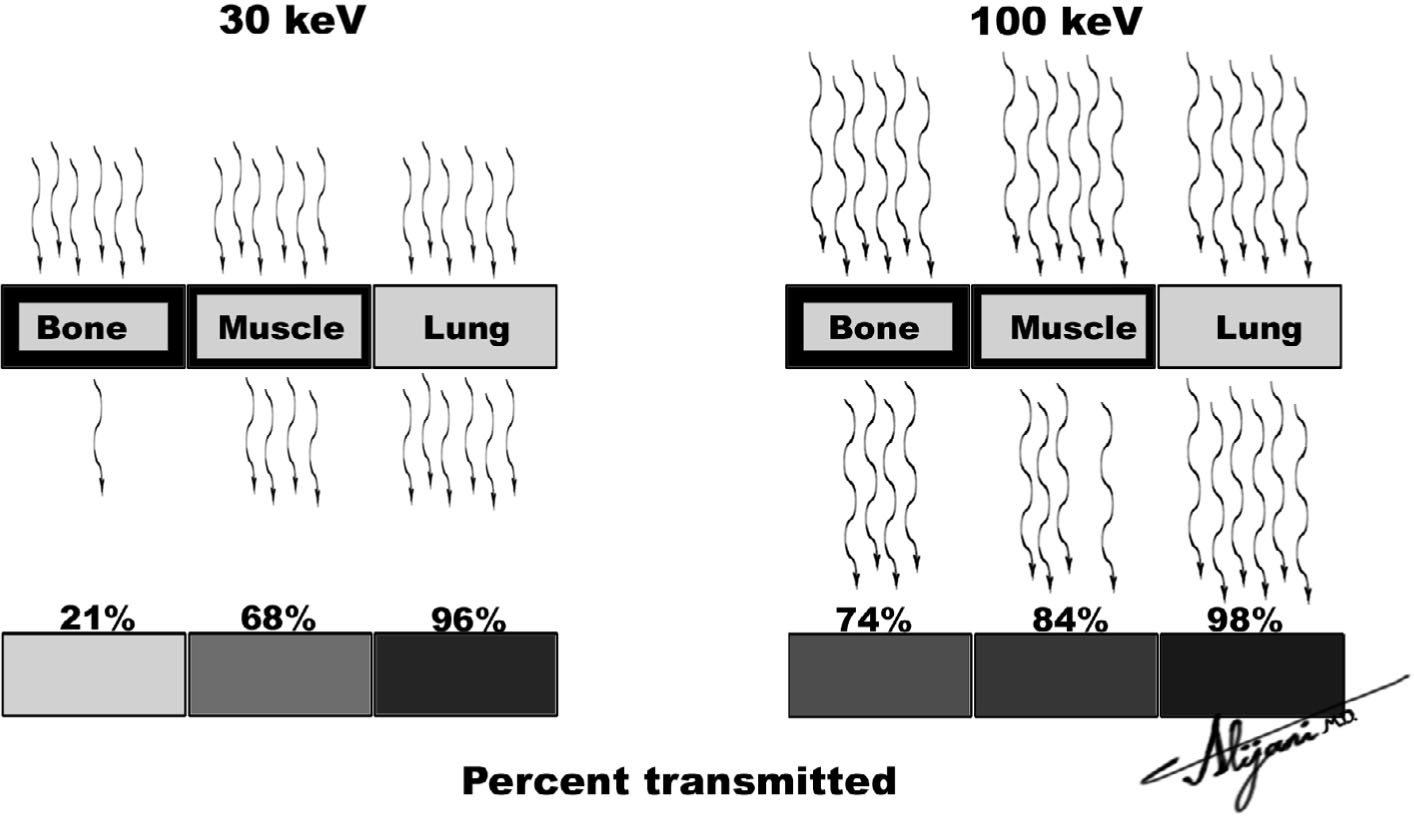
FIGURE 6.1 X-ray penetration increases with increasing photon energy, which reduces x-ray intensity differences (i.e., contrast) between bone, muscles, and lung.
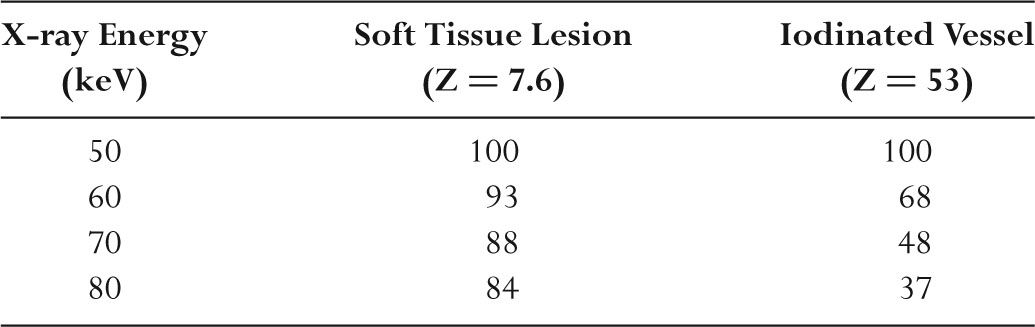
TABLE 6.1 CT Image Contrast of a Lesion in a Water Background as a Function of X-ray Photon Energy (Normalized to 100% at 50 keV)
–Reduced subject contrast generally results in a reduction of image contrast, and vice versa.
–Photon energy also affects contrast in CT imaging (Table 6.1).
–Increasing the photon energy from 50 to 80 keV reduces soft tissue contrast (i.e., soft-tissue HU) by 16% and reduces iodine contrast by 63%.
–Reducing CT tube voltage improves visibility of iodinated contrast agents.
–For large patients, reducing kV may not be practical because of insufficient patient penetration.
F. Contrast agents
–Contrast agents including air, barium, and iodine are used to improve subject contrast.
–Barium is administered as a contrast agent for visualization of the GI tract on radiographic examinations.
–Barium attenuation is high because of its high density and high atomic number (Z = 56) that places the K-edge at 37 keV.
–The barium K-edge energy matches the mean photon energies used in fluoroscopy.
–Iodine (Z = 53) is also an excellent contrast agent for similar reasons to those for barium (i.e., K-edge = 33 keV).
–Iodinated contrast agents can be injected intravenously or arterially.
–Dilution and the osmolar limitations of intravascular fluids limit the achievable iodine concentration.
–Air is a negative contrast agent and increases subject contrast because it is less attenuating than tissue.
–Carbon dioxide is also sometimes used as a contrast agent in angiography.
A. What is resolution?
–Resolution is the ability of an imaging system to display two adjacent objects as discrete entities.
–Resolution is also known as spatial resolution, high-contrast resolution, sharpness, or blur.
–Two small adjacent objects such as microcalcifications will appear sharp and distinct in an image obtained with a system that has good resolution.
–Adjacent microcalcifications might appear as one blurred entity in images obtained with a system that has poor resolution.
–Resolution may be quantified using a parallel line bar phantom.
–Bar phantoms possess very high intrinsic contrast.
–One line pair per millimeter (1 lp/mm) is a bar phantom that has 0.5 mm lead (Pb) bars separated by 0.5 mm of radiolucent material.
–A 2 lp/mm bar phantom has 0.25 mm Pb bars separated by 0.25 mm of radiolucent material, and so on.
–Large objects correspond to low values of line pairs/mm
–Smaller structures correspond to higher values of line pairs/mm.
–The limiting spatial resolution is the maximum number of line pairs per millimeter that can be recorded by the imaging system.
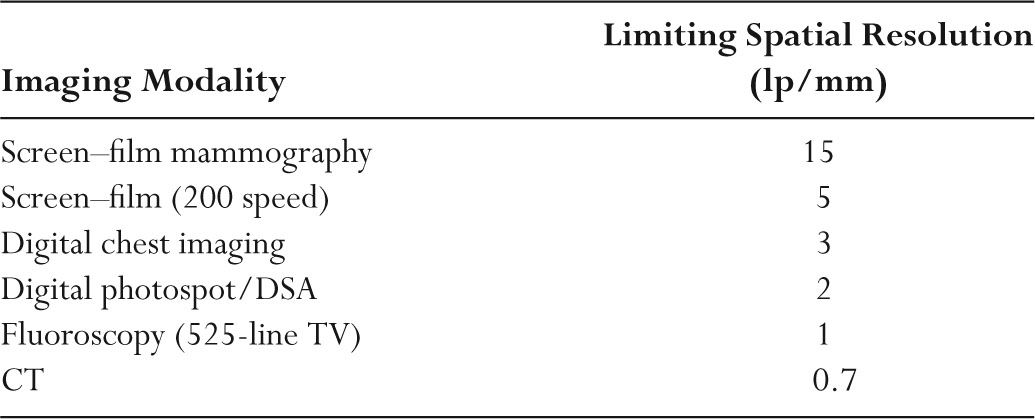
–Table 6.2 shows the limiting resolution of x-ray based imaging modalities.
–The human eye resolves ~5 lp/mm at a viewing distance of ~25 cm.
–Humans can resolve up to ~30 lp/mm on close inspection.
–Focal spot size, detector blur, and patient motion affect resolution in radiography.
TABLE 6.2 Approximate Values of Limiting Resolution in Radiologic Imaging
B. Focal spot blur
–The finite size of a focal spot results in blurred images.
–The blurred margin at the edge of objects produced by a finite focal spot is called a penumbra.
–The penumbra is the result of x-rays arriving from slightly different locations in the focal spot.
–The resultant loss of sharpness is called focal spot blur or geometric unsharpness.
–Focal spot blur increases with increasing focal spot size as shown in Figure 6.2.
–A point focal spot, or one that is negligibly small, produces no focal spot blur.
–There is no focal spot blur in contact radiography (i.e., no magnification) as shown in Figure 6.2.
–Focal spot blur is minimal in extremity radiography (i.e., negligible magnification).
–In magnification radiography, it is always very important to use small focal spot sizes.
–Reducing the focal spot size in magnification imaging increases the sharpness of edges by minimizing the penumbra.
–Magnification in mammography improves visibility of microcalcifications but needs a 0.1-mm focal spot to minimize geometric unsharpness.
–Magnification is sometimes used in angiograms to improve the visibility of very small blood vessels and makes use of a 0.3-mm focal spot.
C. Detector blur
–The physical size of any radiation detector will limit the ability to resolve small objects.
–Screen thickness introduces a limit on the achievable spatial resolution performance in radiography.
–Light produced by absorbed x-rays in a screen produces a blurred image because the light diffuses before being absorbed by a film.
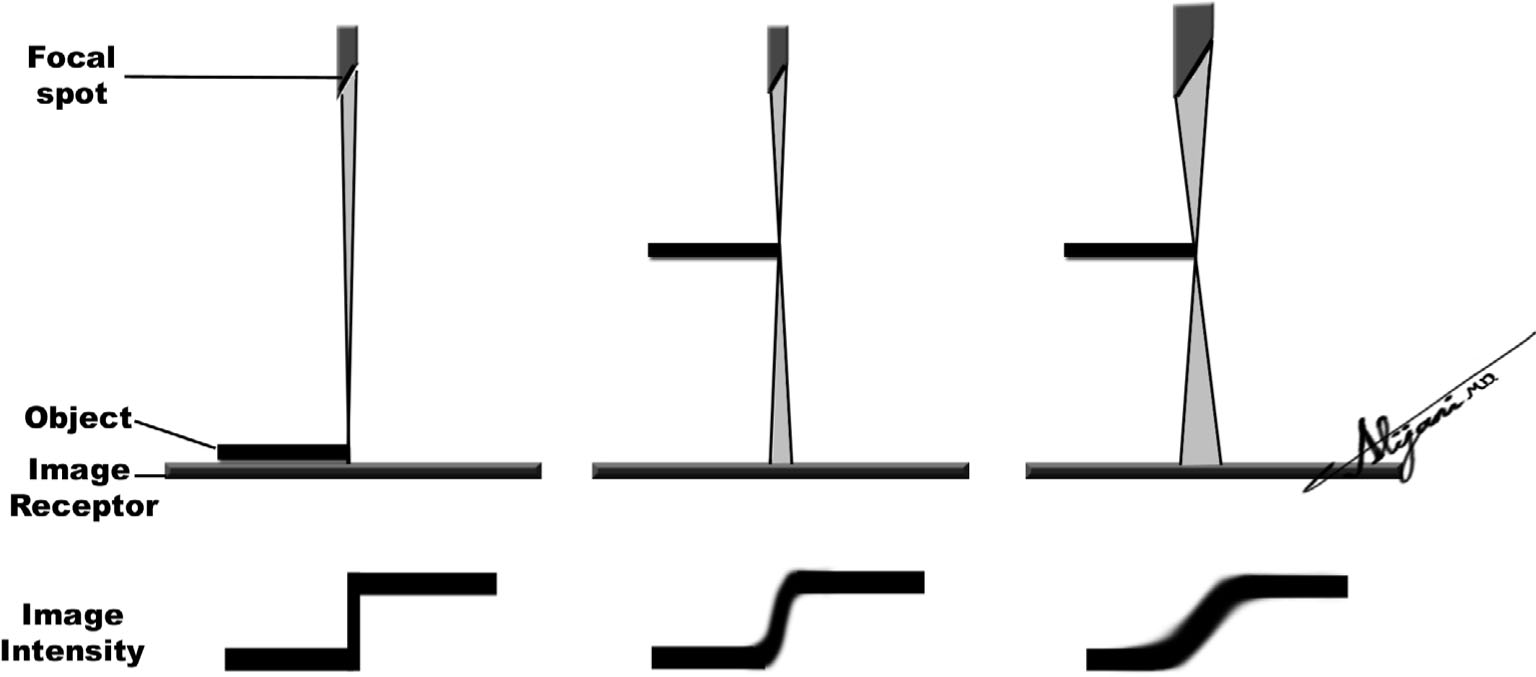
FIGURE 6.2 Focal spot blur in radiography showing that in contact radiography (left), the edge is very sharp with negligible blur but becomes less sharp (blurrier) with magnification (middle), and the blur further increases with a larger focal spot size (right).
–A screen that is 0.4-mm thick will introduce a blur in the resultant image that is comparable to the screen thickness.
–Capturing an image with x-ray film alone without any screen can a produce sharp image.
–Film (i.e., no screen) images are only sharp with minimal motion and focal spot blur.
–In fluoroscopy, the width of a TV line places a lower limit on the visibility of small details.
–In digital radiography, the pixel size limits the size of small objects that may be visualized.
–In CT, each detector element produces an average intensity of the x-ray pattern that is incident on the detector, with (any) finer details being lost.
–In general, the key image receptor dimensions (thickness or detector area) should be smaller than the smallest objects that are to be resolved.
D. Motion blur
–Patient motion introduces blur into a radiograph by smearing out the object in the image.
–Movement of organs such as the heart contribute to patient motion.
–Gross movement of the patient is another source of motion blur.
–Increasing the mA to reduce the exposure time will minimize motion blur.
–Increasing the mA may not be possible, however, because of limits on the focal spot loading of the x-ray tube.
–Motion blur is independent of image magnification.
–Patient motion can be reduced by the use of immobilization devices such as the compression paddle in mammography.
E. Point spread function (PSF) and line spread function (LSF)
–An image of point (e.g., hole) is called a point spread function (PSF).
–The point appears blurred because of the combined effects of the focal spot, motion, and the dimensions of the imaging receptor.
–The image of a narrow line source is called a line spread function (LSF), and its width may be taken as a measure of the blur or resolution.
–Normally, width is measured at half the maximum value, termed full width half maximum (FWHM).
–A wide LSF implies poor spatial resolution and vice versa.
–Narrow LSFs (<1 mm or so) are difficult to measure, and bar phantoms (i.e., lp/mm) are used to measure spatial resolution performance.
–Wide LSFs (>3 mm or so) are easy to measure and are routinely obtained as FWHM in nuclear medicine.
–The limiting spatial resolution in lp/mm can be converted to FWHM and vice versa.
–FWHM ~1/(2 × LSF)
–A line spread function with a FWHM of 0.1 mm can thus be taken to have a limiting resolution of ~5 line pairs per mm.
–A resolution of 1 lp/mm corresponds to a FWHM of 0.5 mm.
F. Modulation transfer function
–The modulation transfer function (MTF) is a curve that describes the resolution capability of an imaging system.
–The MTF is the ratio of output to input modulation (signal amplitude) in an imaging system at each spatial frequency.
–Output modulation of all imaging systems is less than the 100% input because of blur introduced by the focal spot, motion, and receptor size.
–The importance of blur increases as the spatial frequency increases (i.e., as the objects of interest get smaller).
–At low spatial frequencies, the MTF is close to 1.0 and corresponds to excellent visibility of large features.
–At high spatial frequencies, the MTF always falls to zero, which corresponds to the poor visibility of small features.
–The MTF of the imaging system is the product of the MTFs of the respective subcomponents.
–If for a given spatial frequency, the MTF due to the focal spot is 0.9, due to motion is 0.8, and due to the screen is 0.7, the imaging system MTF is the product of the individual components (i.e., 0.9 × 0.8 × 0.7, or 0.5).
–Imaging scientists use MTF analysis which permits each component to be analyzed separately (focal spot, motion, detector blur) and weak links to be identified.
–MTF analysis also helps scientists to predict imaging performance for any specified diagnostic imaging task.
III. IMAGING SYSTEM RESOLUTION
A. Screen–film
–Film alone (i.e., no screen) has a limiting spatial resolution of ~100 lp/mm.
–Film resolution is limited by the size of the individual grains of silver.
–With screen–film combinations, the film is exposed to light photons produced within the screen.
–Light produced in the screen spreads out as it moves toward the film (Fig. 6.3) producing a blurred image.
–Screen blur is determined by the thickness of the intensifying screen.
–Screen thickness ranges between 50 and 400 μm.
–Thicker screens have greater light diffusion in the screen and, therefore more blur.
–Thicker screens (fast screens) also have improved x-ray absorption efficiencies and reduced exposures.
–Reduced exposures may also result in shorter exposure times.
–Short exposure times minimize motion blur.
–A screen–film system (200 speed) has limiting spatial resolution of ~5 lp/mm.
–The limiting spatial resolution of a mammography screen—film is ~15 lp/mm.
–The ACR accreditation program requires the resolution in screen–film mammography to be 11 to 13 lp/mm.
–The minimal specifications correspond to 11 lp/mm when measurements are perpendicular to the anode–cathode axis and 13 lp/mm parallel to this axis.
–Magnification imaging in mammography is performed with a small focal spot (0.1 mm) to ensure that the resolution remains within the limits set by accreditation bodies.
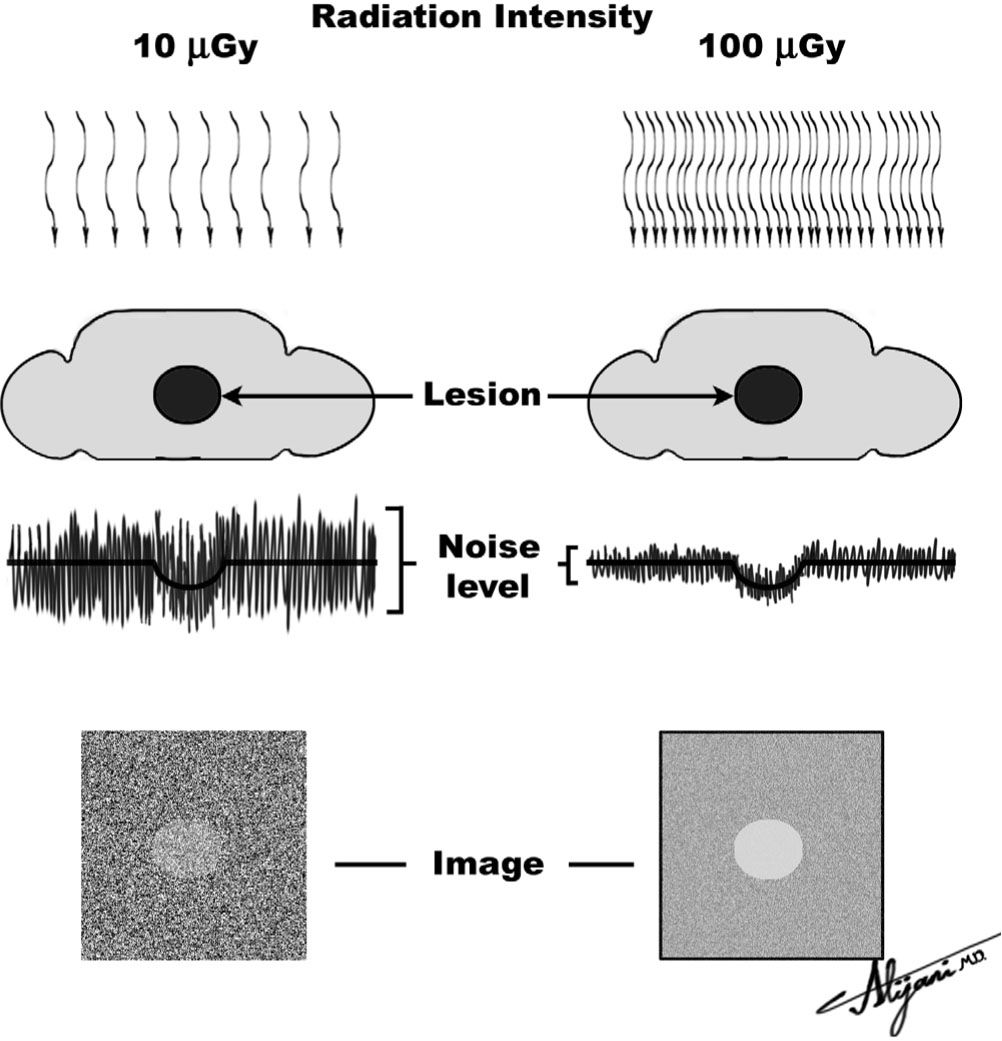
FIGURE 6.3 Increasing x-ray air kerma from 10 μGy (left) to 100 μGy (right) reduces random fluctuations by √[10] whereas lesion contrast is unchanged; as a result, the lesion becomes visible because lesion contrast is larger than the level of image noise.
B. TV
–Vertical resolution of a TV system is determined by the number of TV lines.
–A TV system with N lines can (theoretically) produce N/2 line pairs (i.e., one line pair has one black line and one white line).
–
Related posts:


Stay updated, free articles. Join our Telegram channel

Full access? Get Clinical Tree


