, Gina M. Fundaro1 and Sabala R. Mandava1
(1)
Department of Radiology, Henry Ford Hospital, Detroit, MI, USA
Case 1 MRI Artifacts
Patient History
MR images in multiple patients.
Radiology Findings
Fig. 2.1 Axial subtracted T1-weighted image demonstrates a mirror image of the aorta seen in the soft tissue of the left chest wall. This finding is consistent for a ghosting artifact from motion from the aorta.
Fig. 2.2 Axial nonfat-suppressed T2-weighted image demonstrates too wide of a field of view due to poor technique.
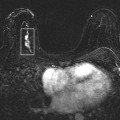
Fig. 2.3 Sagittal fat-suppressed T2-weighted image demonstrates a signal void with surrounding increased signal from a tissue marker clip in the upper breast. This artifact is called a susceptibility artifact.
Fig. 2.4 Sagittal water-suppressed FSTIR image demonstrates incorrect water suppression. Instead, the silicone is suppressed. Findings are consistent for silicone saturation artifact.
Fig. 2.5 Axial subtracted T1-weighted image postcontrast image demonstrates ghosting artifact in the phase-encoding direction due to the patient coughing.
Fig. 2.6 Axial subtracted T1-weighted image postcontrast image demonstrates inhomogeneous fat saturation.
Fig. 2.7 Sagittal nonfat-suppressed T1-weighted localizer image shows portion of the spine seen on the left aspect of the image consistent with a phase-wrap artifact.
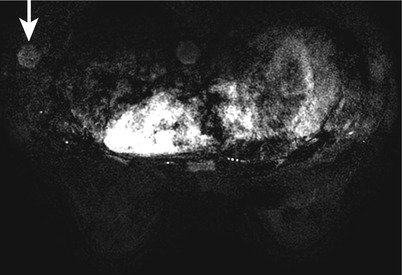
Fig. 2.1
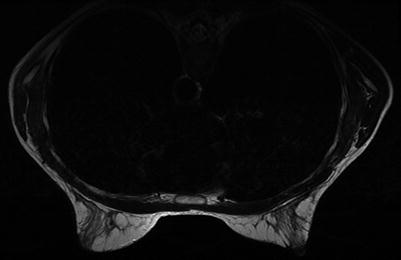
Fig. 2.2
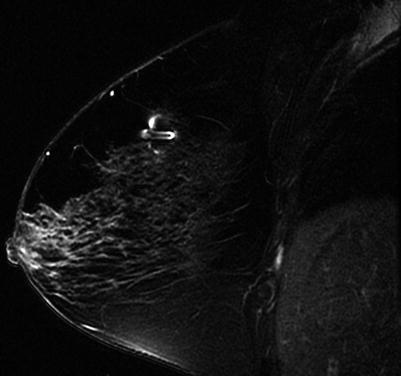
Fig. 2.3
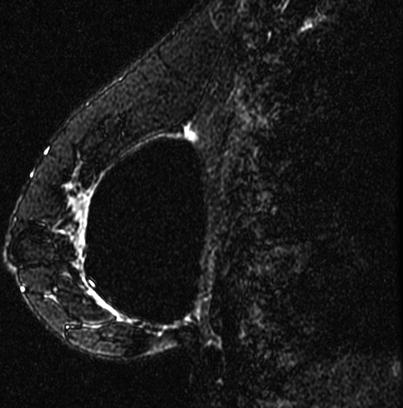
Fig. 2.4
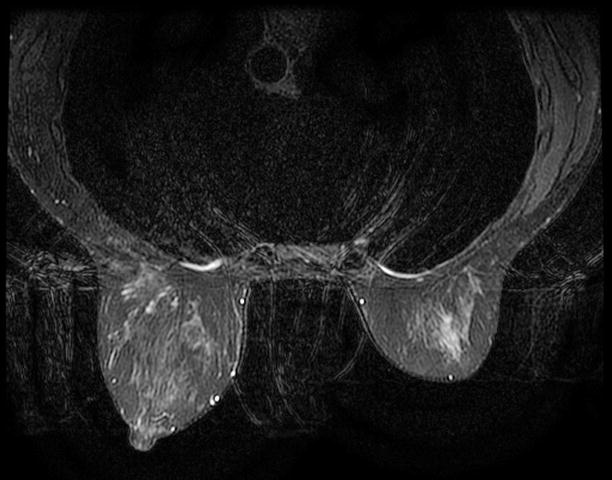
Fig. 2.5
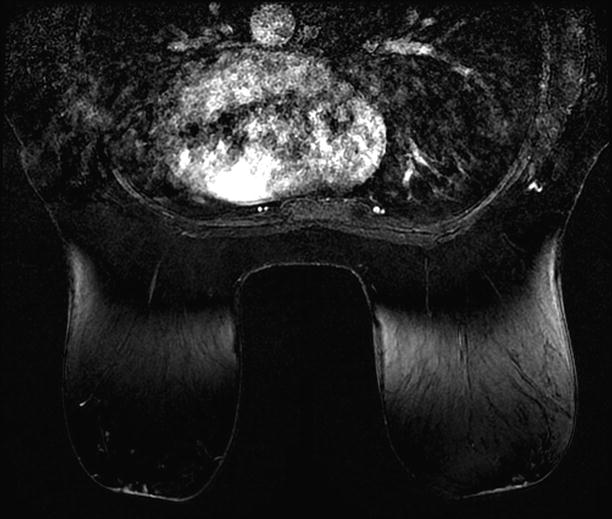
Fig. 2.6
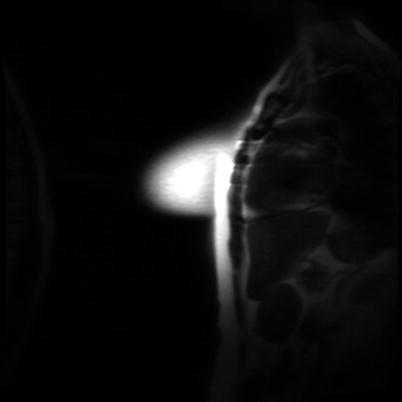
Fig. 2.7
Diagnosis
MRI artifacts
Discussion
Artifacts from metallic artifacts are also called black hole artifacts or susceptibility artifacts.
Susceptibility artifacts manifest as signal voids on gradient echo sequences. On spin echo sequences, a signal flare void component may be seen in addition to the signal void.
Small lesions in the region of the susceptibility artifact from tissue markers may not be visible due to the signal void. This can limit the MRI assessment for the extent of the disease, surgical margins, or size of lesion.
Motion artifact, or also called ghosting, is always in the phase-encoding direction. The phase-encoding direction should be left to right for axial sequences and superior to inferior for sagittal sequences to reduce the effect of cardiac and respiratory motion.
Ghosting can arise from patient motion or cardiac, respiratory, or great vessel motion. Motion can result in blurring of moving tissues but can cause a structured noise pattern, resulting in ghosting of brighter moving tissues in the phase-encoding direction.
Phase wrap, also known as aliasing artifact or wraparound artifact, occurs when tissue extends beyond the field of view (FOV), causing signal from tissues outside the FOV to be superimposed on structures within the FOV.
Enlarging the FOV can correct phase-wrap artifact.
Silicone saturation artifact is caused by saturation of silicone signal, which can occur when silicone is selected for saturation rather than fat.
Inhomogeneous fat saturation artifact may be due to unexpected variation in the magnetic field for which protons in fat tissue are precessing out of range of frequencies included in the suppression pulse. These protons will not be suppressed, and the fat containing these protons will maintain its brighter signal.
Shimming the magnet (optimizing field homogenicity) of an MRI unit can sometimes correct inhomogeneous fat saturation.
MRI technologists may not be used to positioning the breasts, and training by mammography technologists may be helpful.
References
Genson CC, Blane CE, Helvie MA, Waits SA, Chenevert TL. Effects on breast MRI of artifacts caused by metallic tissue marker clips. Am J Roentgoenol. 2007;188:372–76.
Harvey JA, Hendrick RE, Coll JM, Nicholson BT, Burkholde BT, Cohen MA. Breast MR imaging artifacts. How to recognize and fix them. Radiographics. 2007;27:S137–45.
Case 2 RIM Enhancement
Patient History
Breast MRI studies in multiple patients.
Radiology Findings
Fig. 2.1 Axial subtracted T1-weighted image demonstrates an enhancing mass in the outer left breast posteriorly. The mass shows thin, irregular rim enhancement.
Fig. 2.2 Sagittal (a) T2-weighted image in a different patient demonstrates multiple oval high-signal-intensity masses in the left breast. There is skin thickening. Sagittal (b) contrast-enhanced T1-weighted image demonstrates multiple thin rim-enhancing masses.
Fig. 2.3 (a) Axial nonfat-suppressed T1-weighted image demonstrates a lobular area isointense to fat in the inner right breast at anterior depth. (b) Sagittal fat-suppressed contrast-enhanced T1-weighted image demonstrates the mass to have a thin rim of peripheral enhancement consistent with fat necrosis.
Fig. 2.4 (a) Axial nonfat-suppressed T2-weighted image demonstrates a high-signal-intensity area in the inner right breast at posterior depth. (b) Sagittal fat-suppressed contrast-enhanced T1-weighted image demonstrates the area in the lower breast with thin peripheral rim enhancement consistent with a seroma.
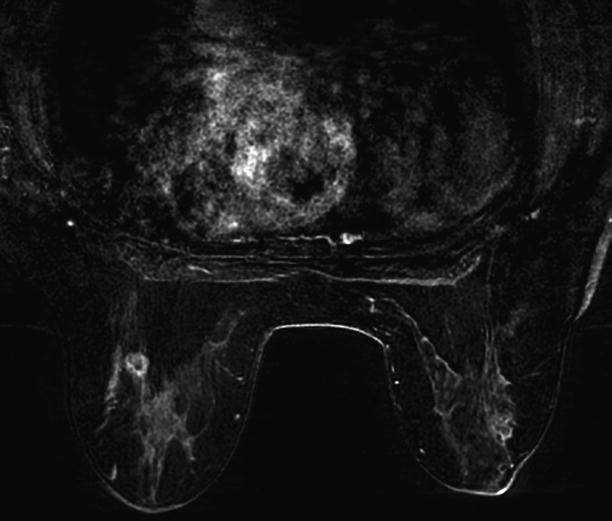
Fig. 2.1
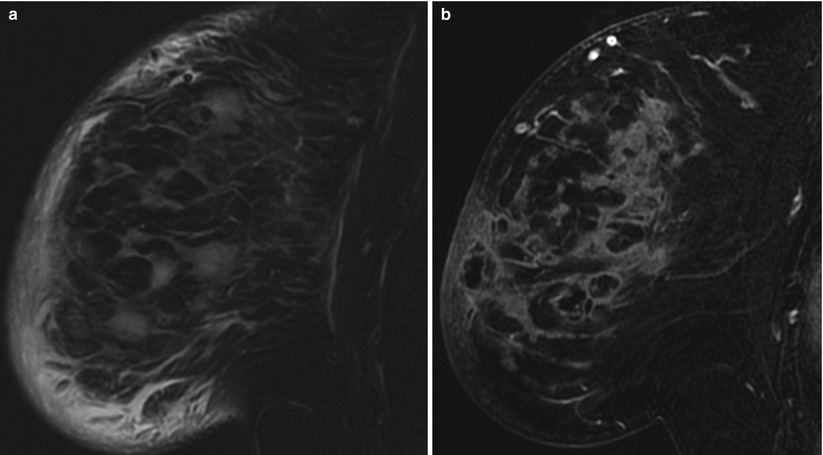
Fig. 2.2
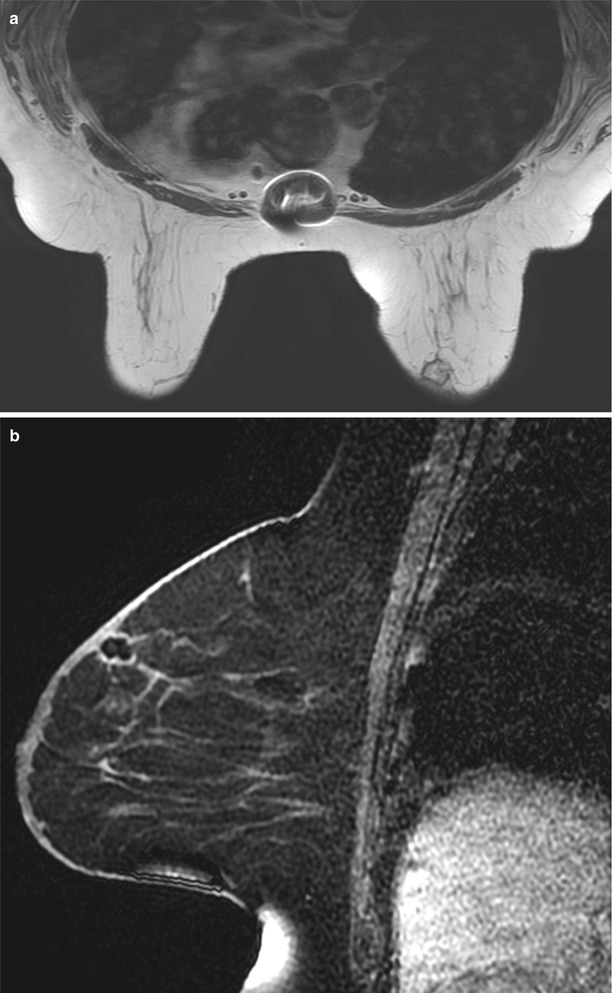
Fig. 2.3
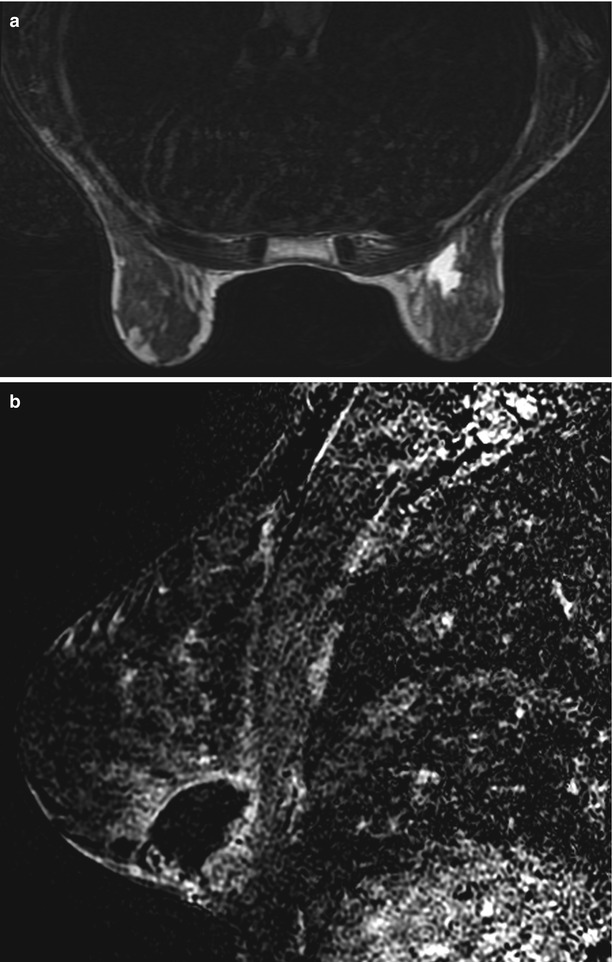
Fig. 2.4
Diagnosis
Rim enhancement (edge enhancement)
Discussion
Rim enhancement is defined as enhancement at the periphery of a mass on MRI.
Morphology of the enhancement is variable based on lesion characteristics.
Benign lesions typically have a uniform and smooth rim.
Malignant lesions and infections typically have an irregular rim.
Rim enhancement is caused by peripheral vascularization of lesions.
If present in invasive cancer, the prognosis is worse.
Differential diagnosis includes:
Invasive ductal carcinoma (IDC)
Margin is irregular and thin.
Seroma
Margin is thin and smooth (<4 mm).
High in signal on T2-weighted image and STIR.
Becomes smaller on later examinations.
Inflammatory cyst
Margin is thin and smooth.
High in signal on T2-weighted image and STIR.
Abscess
High in signal on T2-weighted image and STIR.
May be associated with edema and skin thickening.
May be palpable and tender.
Fat necrosis
High in signal on nonfat-suppressed T1-weighted images.
Any solid mass with rim enhancement should be biopsied.
References
Berg WA, Birdwell RL, Gombos EC, et al. Diagnostic imaging breast. 1st ed. Salt Lake City: Amirsys; 2006. Section IV 1, p. 174–77.
Morris EA, Liberman L, editors. Breast MRI diagnosis and intervention. 1st ed. New York: Springer; 2005. p. 61–4.
Case 3 Simple Cysts
Patient History
A 52-year-old female for screening breast MRI.
Radiology Findings
Fig. 2.1 (a) Sagittal T2-weighted image demonstrates multiple round and oval circumscribed high-signal-intensity masses in the breast. (b) Sagittal subtracted T1-weighted image demonstrates no enhancement of the masses.
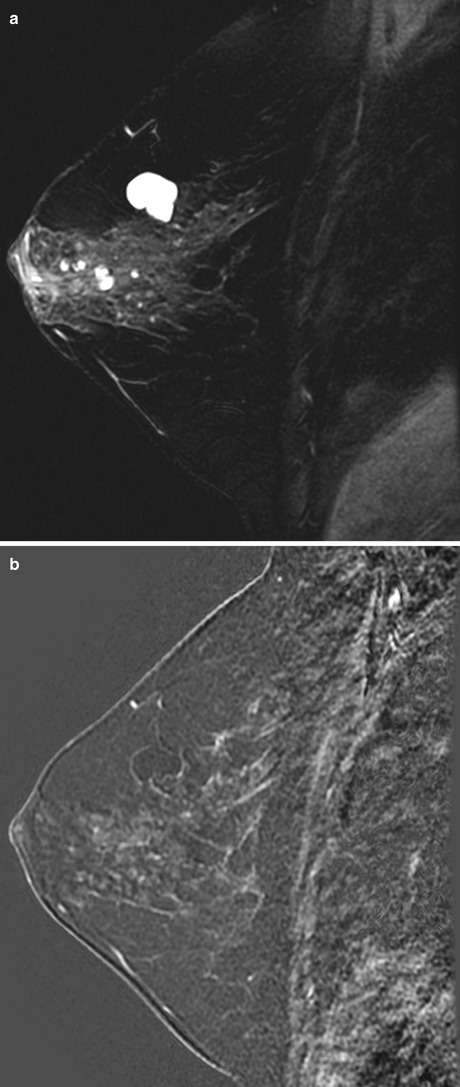
Fig. 2.1
BI-RADS Assessment
BI-RADS 2. Benign findings.
Diagnosis
Simple cysts
Discussion
Simple cysts are the most common breast masses seen on MRI.
Simple cysts are of low signal intensity or equal to adjacent fibroglandular tissue on T1-weighted images and of high signal intensity on T2-weighted images.
If there is protein content in the fluid, the cyst may be intermediate to high signal on T1-weighted images.
There is no enhancement on postcontrast imaging.
There may be thin, peripheral rim enhancement if the cysts are inflamed.
References
Berg WA, Birdwell RL, Gombos EC, et al. Diagnostic imaging breast. 1st ed. Salt Lake City: Amirsys; 2006. p. 48–51. Section IV 1.
Morris EA, Liberman L, editors. Breast MRI diagnosis and intervention. New York: Springer; 2005. p. 147–52.
Case 4 Invasive Ductal Carcinoma (IDC) with Axillary Lymph Node Metastasis
Patient History
A 55-year-old female with a diagnosis of invasive ductal carcinoma. MRI for treatment planning.
Radiology Findings
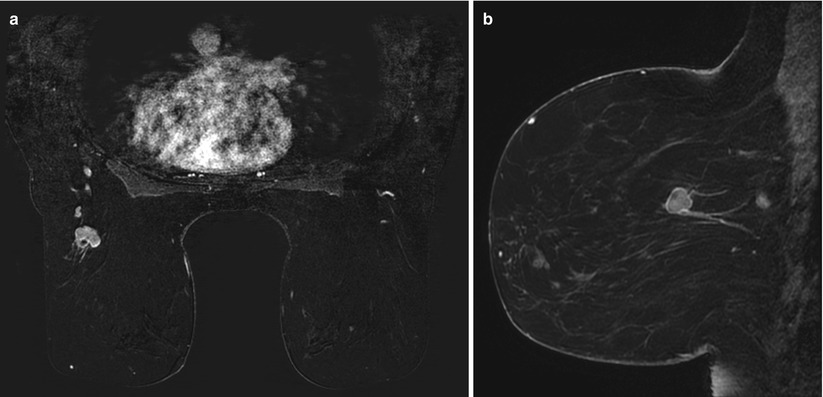
Fig. 2.1 (a) Axial subtracted T1-weighted and (b) sagittal contrast-enhanced delayed T1-weighted images show an irregular spiculated rim-enhancing mass in the lower outer left breast at anterior depth.
Fig. 2.2 Sagittal T2-weighted image shows a low-signal spiculated mass in the lower left breast at anterior depth.
Fig. 2.3 Kinetic curve demonstrates washout kinetics (type III).
Fig. 2.4 (a) Axial subtracted T1-weighted and (b) sagittal contrast-enhanced delayed T1-weighted images show an enhancing oval mass with irregular margins in the upper outer left breast consistent with an enlarged lymph node.
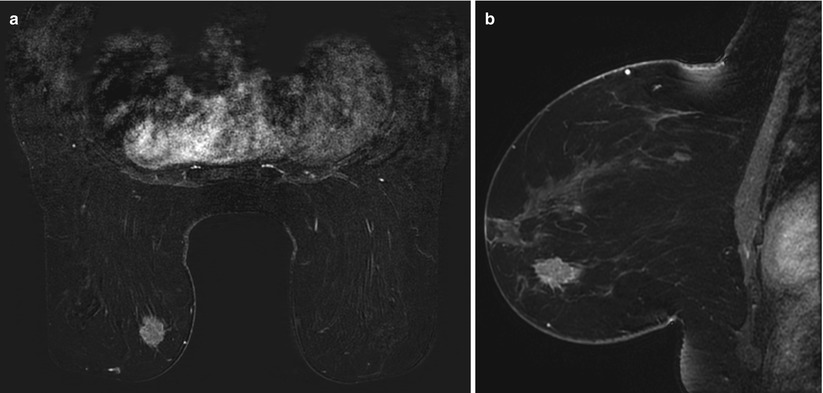
Fig. 2.1
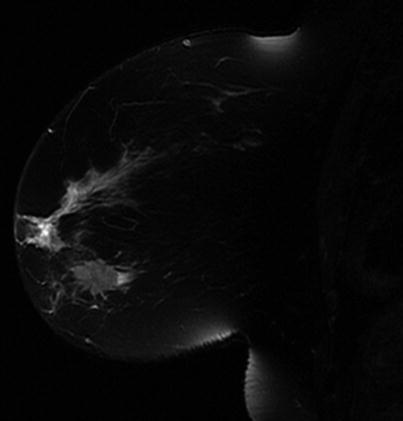
Fig. 2.2
Fig. 2.3