Fig. 1
Trabecular bone specimens of T10 from a normal (a) and an osteoporotic (b) subject. 3D reconstructions of micro-CT scans with a spatial resolution of 26 µm³. Note the bone loss and rarefication in (b) compared to (a)
The clinically most important fracture sites are the radius, hip and spine. It has been demonstrated that osteoporotic vertebral and hip fractures are associated with a reduced quality of life [2, 3]. Furthermore, vertebral and hip fractures are associated with an increased mortality [4–6]. In 2010, 22 million women and 5.5 million men were estimated to have osteoporosis in the European Union [7]. The number of incident osteoporotic fractures amounted to 3.5 million, comprising 620,000 hip fractures, 520,000 vertebral fractures, 560,000 forearm fractures, and 1,800,000 other fractures. The economic burden of prevalent and incident osteoporotic fractures was estimated at €37 billion. Prevalent and incident osteoporotic fractures also accounted for 1,180,000 quality-adjusted life years lost during 2010. Due to the aging population, the prevalence of osteoporosis and consecutively the incidence of osteoporotic fractures is expected to increase [8]. In the European Union, the costs are expected to increase on average by 25 % in 2025 [7]. Similar projections have been reported for the United States [9]. Therefore, osteoporosis is classified as a public health problem.
The World Health Organisation (WHO) based the diagnosis of osteoporosis on the measurement of BMD at the spine and hip using dual-energy X-ray absorptiometry (DXA) [10]. Subjects with BMD values 2.5 standard deviations below the mean of the reference population consisting of healthy young adult women are classified as osteoporotic (T-score <−2.5), and subjects with BMD values ranging from 2.5 to 1.0 standard deviations below the mean of the reference population are classified as osteopenic (T-score between −2.5 and −1.0). However, T-scores and BMD values of subjects with and without osteoporotic fractures overlap [11, 12]. Schuit et al. [11] assessed in a prospective study baseline BMD and incidence of non-vertebral fractures during follow-up in 7,806 men and women aged 55 years and older. They reported that only 44 % of all non-vertebral fractures occurred in women with a T-score below −2.5. In men, this percentage was even lower (21 %). Similar findings were reported for incident osteoporotic vertebral fractures [12]. Thus, the BMD thresholds for the pharmacological intervention to prevent fractures are often inadequate. Subjects at high risk for osteoporotic fractures may not be identified and the necessary pharmacological treatment is not initiated. This is particularly regrettable, since the current osteoporosis medications including bisphosphonates and anti-receptor activator of NF-κB ligand (RANKL) have demonstrated to efficiently reduce the incidence of osteoporotic fractures [13, 14]. Therefore, the Fracture Risk Assessment Tool (FRAX) has been introduced which uses easily obtainable clinical risk factors to estimate a 10-year fracture probability in order to provide a better clinical guidance for treatment decisions [15, 16]. Age, sex, weight, height, personal history of fracture, parental history of hip fracture, smoking status, glucocorticoid intake, rheumatoid arthritis, secondary osteoporosis, alcohol use, and femoral BMD value are inquired for this purpose. Bone turnover markers may be useful for monitoring osteoporosis treatment, e.g. annual infusion of zoledronic acid reduced bone turnover markers and explained much of the observed fracture risk reduction [17]. However, measurements of bone turnover markers are not included in algorithms for fracture risk prediction at the moment due to the lack of data [18].
The most important role of osteoporosis imaging at the spine is the correct assessment of vertebral fracture status and BMD measurements, which are outlined in the following two sections. FRAX does not directly assess bone strength and quality, parameters in particular important for monitoring drug effects. Therefore, imaging techniques measuring bone microstructure and bone marrow fat content, which have been already used or have been emerging to predict bone strength and assess bone quality, are presented in the last sections of this chapter.
3 Diagnosis of Osteoporotic Vertebral Fractures
A prevalent osteoporotic fracture increases the risk of a subsequent fracture, independent on BMD [19–22]. Therefore, the correct diagnosis and reporting of prevalent osteoporotic vertebral fractures by radiologists is highly important to initiate appropriate therapy. Osteoporotic vertebral fractures most commonly occur between thoracic vertebra 5 (T5) and lumbar vertebra 5 (L5).
Several scoring methods for osteoporotic vertebral fractures have been introduced [23]. Quantitative morphometry (QM) obtains ratios from direct vertebral body height measurements to define osteoporotic vertebral fractures. Semiquantitative (SQ) methods are based on the visual grading of fractures by using specific height and area reduction criteria. The algorithm-based qualitative (ABQ) method outlines a scheme to systematically rule out non-fracture deformities and diagnoses osteoporotic vertebral fractures based on endplate depression.
QM measures anterior, middle, and posterior vertebral body heights and calculates ratios between these heights [24, 25]. Vertebral fractures are defined by thresholds, e.g. three standard deviations difference in height ratios from normal population means or generally 15 % reduction in height ratios [26]. The advantages of the QM scoring systems are the better reproducibility and objectivity compared to the SQ and ABQ methods. The drawback of QM is the relatively high expenditure of time which is critical in clinical routine.
The most widely used scoring method is the SQ grading system introduced by Genant et al. [27]. Osteoporotic vertebral fractures are graded on visual inspection and without direct vertebral measurement: grade 0: normal, grade 1: mildly deformed (approximately 20–25 % reduction in anterior, middle, and/or posterior height and a reduction of area 10–20 %), grade 2: moderately deformed (approximately 25–40 % reduction in any height and a reduction in area 20–40 %), and grade 3: severely deformed (approximately 40 % reduction in any height and area). Furthermore, the spinal fracture index (SFI) can be calculated by summing the individual vertebral body grades. The advantage of SQ methods is the relatively little time needed for performing the grading. The disadvantage of the SQ methods is the lower reproducibility and worse objectivity compared to the QM grading systems. In contrast to the ABQ method, the Genant scoring system does not account for several other important characteristics of vertebral fracture including endplate deformity or buckling of cortices.
The ABQ method uses a scheme to systematically rule out non-fracture deformities [28]. Osteoporotic vertebral fractures are diagnosed based on the assumption that these fractures always involve the fracture of the endplate. Thus, the evidence of endplate fracture and not the variation in vertebral shape is the primary indicator of osteoporotic fracture. The advantage of the ABQ method is the better differentiation of true fractures from non-fracture deformities, in contrast to the QM and SQ scoring systems where no allowance is made for variation in vertebral dimensions at different vertebral levels or short vertebral heights associated with Scheuermann’s disease, scoliosis etc. A skilled reader is needed for the ABQ method to differentiate accurately between vertebral fractures and non-fracture deformities, which is a disadvantage compared to the QM and SQ scoring systems.
Radiography of the thoracic and lumbar spine is the standard imaging modality used for the initial assessment of osteoporotic vertebral fractures (Fig. 2). The dose from a lateral radiograph of the thoracic and lumbar spine is about 0.6 mSv [29].
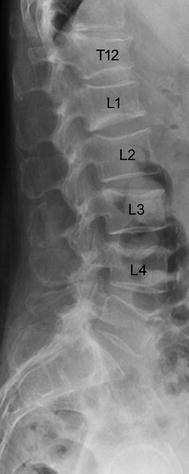
Fig. 2
Lateral radiograph of the lower thoracic and lumbar spine of a 63-year old woman with osteoporotic vertebral fractures from T12 to L4
Vertebral Fracture Assessment (VFA) by using newer generations of DXA scanners allows for imaging of the thoracic and lumbar spine to assess prevalent osteoporotic vertebral fractures [30, 31]. It can be combined with the DXA-based BMD measurements which is advantageous. VFA has lower radiation exposures than radiographs with reported doses in the range from 0.002 to 0.05 mSv [29]. Moderate and severe osteoporotic fractures can be accurately identified by VFA, but caution is necessary when vertebrae are evaluated in the presence of degenerative changes of the spine [32]. In these cases, radiographs with their superior spatial resolution allow the detection of more subtle abnormalities. Furthermore, Buehring et al. reported that VFA is dependent on instrument and reader [33].
Multi-detector computed tomography (MDCT) and magnetic resonance imaging (MRI) allow for a 3D visualization of the spine and are used as advanced diagnostic tools for osteoporotic fractures [34]. Both imaging techniques are substantially more expensive than radiography. Compared to MDCT, MRI has the advantage that it lacks ionizing radiation. Bone marrow edema can be detected by using MRI. Its presence can differentiate a recent from an old osteoporotic vertebral fracture (Fig. 3). In contrast to MRI, the integrity and shape of the vertebrae, particularly the cortical margins, can be directly visualized by using MDCT. It is less expensive than MRI and may provide important information for differentiating between osteoporotic and malignant fractures and assessing bone matrix changes [34]. Low-dose MDCT protocols for the visualization of the spine were reported with a dose of 2.2 mSv for men and 3.3 mSv for women [35]. Therefore, radiographs should be primarily used for the initial assessment of osteoporotic vertebral fractures. However, clinicians have to be aware that MDCT can more accurately assess vertebral fractures than standard radiographs and has to be used in unclear cases. Bauer et al. compared the performance of lateral radiographs and sagittal reformations of axial MDCT images in detecting osteoporotic vertebral fractures [35]. They examined 65 vertebrae which were harvested from 21 human cadaver spines with a 64-row MDCT scanner. Ninety-five percent of the fractures could be identified by using sagittal reformations of 1 mm slice thickness, but 18 % of the fractures were missed on the radiographs. Thus, the authors concluded that sagittal MDCT reformations could more accurately assess vertebral fractures than standard radiographs. Furthermore, sagittal reformations of axial MDCT in-vivo images of the spine significantly improved the detection of osteoporotic vertebral fractures and other spine abnormalities, compared to axial images [36].
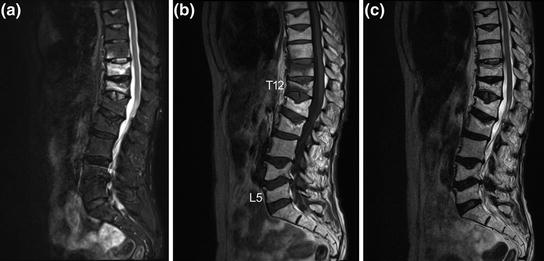
Fig. 3
Sagittal a short tau inversion recovery (STIR), b T1-weighted, and c T2-weighted MRI sequences of the thoracic and lumbar spine. Note the presence of bone marrow edema (hyperintense STIR and hypointense T1 signal, respectively) in T11 and T12 as well as close to the lower endplate in T10 as indication for recent osteoporotic vertebral fractures. In contrast, note the absence of bone marrow edema in the old osteoporotic vertebral fractures of T8, T9, L1, L2, L4, and L5
However, osteoporotic vertebral fractures often occur in absence of a specific trauma and are asymptomatic. Thus, they frequently do not come to clinical attention and dedicated imaging for the diagnosis of osteoporotic vertebral fractures is not performed. Consequently, initiation of appropriate therapy is delayed. Therefore, it is highly important to report prevalent osteoporotic vertebral fractures in routine chest radiographs and routine thoracic/abdominal MDCT images, which are one of the most frequent performed radiologic examinations (Fig. 4). However, osteoporotic vertebral fractures are underdiagnosed in these non-dedicated images [37–40]. Therefore, the International Osteoporosis Foundation (IOF) and the European Society of Musculoskeletal Radiology (ESSR) have started a teaching initiative to raise the awareness of radiologists to report prevalent osteoporotic fractures at the spine, which is well suited to improve the accurate diagnosis and reporting of prevalent vertebral fractures on lateral chest radiographs [41]. Furthermore, the development of semi-automatic segmentation techniques for lumbar radiographs and MDCT images as computer-assisted detection tools may support radiologists to correctly diagnose and report prevalent osteoporotic vertebral fractures [42, 43]. Roberts et al. [42] presented a semi-automatic determination of detailed vertebral shape from lumbar radiographs using active appearance models. The vertebral body outlines were manually annotated by radiologists in 670 lumbar radiographs to obtain a training set. This was used to build statistical models of vertebral shape and appearance using triplets of vertebrae. In order to segment the vertebrae, the models were refitted using a sequence of active appearance models of vertebral triplets. The accuracy achieved on normal vertebrae was good. However, the accuracy performance deteriorated with increasing fracture grade, but even in fractured vertebrae, point-to-line accuracy was below 2 mm in 79 % of the cases. The authors concluded that the located detailed vertebral shapes may enable the development of more powerful quantitative classifiers of osteoporotic vertebral fracture. These active appearance models can also be used in DXA-based VFA images to detect osteoporotic vertebral fractures [44]. Baum et al. [43] developed a prototype algorithm for automatic spine segmentation in routine thoracic and abdominal MDCT images and used this algorithm to automatically detect osteoporotic vertebral fractures. The algorithm automatically localized and identified the vertebrae. Then, each vertebra was automatically segmented by using corresponding vertebrae surface shape models that were adapted to the original images (Fig. 5). Finally, anterior, middle, and posterior height of each segmented vertebra was automatically determined, and anterior-posterior-ratio and middle-posterior-ratio were computed to diagnose osteoporotic vertebral fractures. The prototype algorithm demonstrated a good performance for the automatic detection of prevalent and incident osteoporotic vertebral fractures cross-sectionally and longitudinally, respectively.
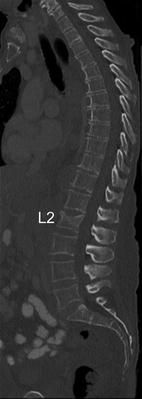
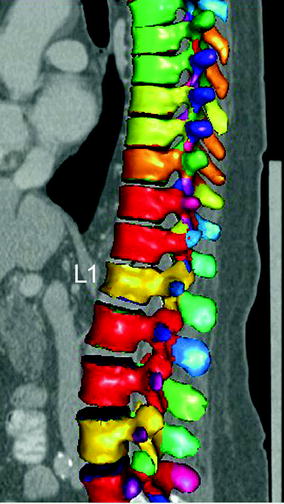
Fig. 4
Sagittal reformation with a slice thickness of 3 mm of a routine thoracic and abdominal MDCT. Note the osteoporotic vertebral fracture of L2
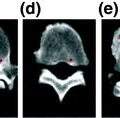
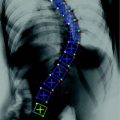
Fig. 5
Automatic detection, identification, and segmentation of the vertebrae in routine thoracic and abdominal MDCT images. Note the automatically detected osteoporotic vertebral fracture of L1
4 BMD Measurements
As outlined in the Background section, measurements of BMD are performed to diagnose osteoporosis. Subjects at high risk for osteoporotic fractures can be identified, so that pharmacological treatment can be initiated [1]. Furthermore, BMD examinations are used to monitor treatment response [34]. Fractured vertebrae are not analyzed, since inclusion of the endplate will cause overestimation of BMD.
DXA is the most common technique to measure BMD [45]. It is usually performed at the forearm, spine, and hip (Fig. 6). BMD is measured as areal value in g/cm2 calcium hydroxyapatite. Compared with alternative bone densitometry techniques, DXA-based BMD results of the spine and hip are the only ones which can be interpreted using the WHO T-score definition of osteoporosis. The T-score is calculated by comparing the measured BMD value of the subject with the mean BMD value of a reference population consisting of healthy young adult women:
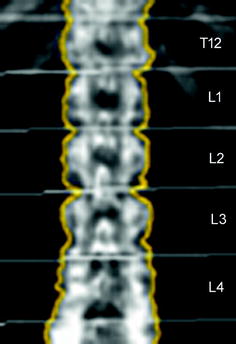
Fig. 6
Representative DXA image from T12 to L4. Measurements of areal BMD (mg/cm²) are obtained for each vertebra
Subjects with T-scores between −2.5 and −1.0 are classified as osteopenic and those with T-scores <−2.5 as osteoporotic [10]. The Z-score expresses the comparison of the measured BMD value of the subject with the mean BMD value of an age-matched reference population:
The radiation dose for DXA measurements is relatively low and amount to 0.013 µSv at the spine [29]. BMD can be accurately determined by DXA which is particularly important for the longitudinal assessment of treatment response. Reproducibility errors expressed as coefficient of variation (CV) ranged between 1.0 and 1.5 % for the spine [45]. However, aortic sclerosis, degenerative disc disease, and scoliosis represent significant error sources for DXA-based BMD measurements.
Quantitative computed tomography (QCT) at the spine avoids these error sources. QCT-based BMD measurements at the spine are performed with clinical whole-body multi-detector computed tomography (MDCT) scanners and are determined as volumetric values in mg/cm3 calcium hydroxyapatite [46]. Thus, BMD values obtained by QCT are not size dependent in contrast to DXA-based areal BMD. A further advantage of QCT is the separate measurement of cortical and trabecular BMD (Fig. 7). Since the trabecular compartment is the metabolically more active one, treatment response can be assessed more accurately by using QCT compared to DXA. QCT-based BMD is usually measured in the lumbar vertebrae 1–3 (L1–L3). Subjects with a trabecular BMD averaged from L1 to L3 between 80 and 120 mg/cm3 are classified as osteopenic and those below 80 mg/cm3 as osteoporotic [47]. A calibration phantom in the table mat is required to be scanned with the subject to convert the voxels’ attenuation values in Hounsfield Unit into BMD values in mg/cm3 calcium hydroxyapatite. BMD measurements at the spine can be performed as 2D single-slice QCT with a slice thickness of 8–10 mm. The scanning plane is selected through the middle of each vertebra parallel to the endplates. The radiation dose for scout image and 3 slices of 10 mm thickness range between 0.2 and 1.0 mSv [29, 46]. Alternatively, 3D QCT measurements can be obtained allowing more sophisticated analysis of cortical and trabecular bone and the imaging of trabecular bone microstructure. However, 3D QCT scans are associated with higher radiation doses (about 1.5 mSv) [29, 46]. Reproducibility errors for 2D single-slice QCT at spine expressed as coefficient of variation (CV) range between 1.4 and 4.0 %, those for 3D QCT between 1.3 and 1.7 % [46]. Compared to DXA, the drawbacks of QCT are the higher radiation dose and the fact that the WHO definition of osteoporosis (T-score <−2.5 using DXA) is not applicable. Therefore, QCT is not as commonly used as DXA and is predominantly performed in selected patient populations and clinical trials [48].

Fig. 7
2D single-slice QCT of L3 with a slice thickness of 10 mm. Volumetric BMD measurements were performed in the cortical and trabecular compartment of L3 (white contours). Note the calibration phantom in the table mat to convert the voxels’ attenuation values in Hounsfield Unit into BMD values in mg/cm³ calcium hydroxyapatite
Since routine thoracic and abdominal MDCT is one of the most frequently used radiologic examination, it would be beneficial to use the obtained MDCT images to conduct additionally BMD measurements of the spine [49]. Thus, further radiation exposure is avoided. Particularly, patients with cancer would benefit, since they routinely undergo MDCT and are at increased risk of osteoporosis due to the cancer related treatment [50]. Most routine thoracic and abdominal MDCT examinations are performed with intravenous contrast medium. Therefore, the obtained BMD values have to be converted to standard QCT equivalent BMD values which are better useable for fracture risk prediction. Bauer et al. [51] and Link et al. [52] demonstrated the feasibility to determine BMD values at the lumbar spine in axial images of non-dedicated routine abdominal contrast-enhanced MDCT. Baum et al. described lumbar BMD measurements without dedicated software and with low time effort in the sagittal reformations of non-dedicated routine abdominal contrast-enhanced MDCT [53]. This offers the possibility to determine lumbar BMD values in the same reformations which are known for a substantial better detection of osteoporotic vertebral fractures [35, 36]. Thus, radiologists can assess vertebral fracture status and BMD in the sagittal reformations in an acceptable time which is critical in clinical routine. Baum et al. determined in ten patients standard QCT-based BMD of L1–L3 and apparent BMD of L1–L3 in the sagittal reformations of routine abdominal contrast-enhanced MDCT images [53]. Apparent BMD values of contrast-enhanced MDCT were on average 56 mg/cm3 higher than those of standard QCT. A correlation coefficient of r = 0.94 was calculated for the BMD values of MDCT and standard QCT with the conversion equation BMDQCT = 0.69 × BMDMDCT-11 mg/ml. Using this conversion equation, lumbar BMD measurements in the sagittal reformations of routine abdominal contrast-enhanced MDCT images could adequately differentiate patients with versus without osteoporotic vertebral fractures. Furthermore, baseline converted lumbar BMD values predicted incident osteoporotic vertebral fractures during a follow-up of 20 ± 12 months [54]. The BMD measurements in the sagittal reformations were performed by placing manually circular regions of interest (ROIs) in the ventral halves of the trabecular compartment of the vertebral bodies of L1–L3, in each case equidistant to both endplates (Fig. 8). The attenuation values measured in the ROIs in Hounsfield Unit were converted into mg/cm3 calcium hydroxyapatite using a reference phantom integrated into the table mat. Short- and long-term reproducibility errors for BMD measurements in the sagittal reformations amounted 2.09 and 7.70 %, respectively [53]. Baum et al. [53, 54] used only MDCT examinations with a scan delay of 70 s after intravenous contrast medium injection. Acu et al. [55] pointed out that scan protocols with different scan delay times after intravenous contrast medium injection significantly change the apparent BMD values. They reported increasing apparent BMD values with longer scan delay times. Thus, the scan delay time after intravenous contrast medium injection has to be taken into account for the derivation of standard QCT equivalent BMD values from routine contrast-enhanced MDCT examinations. Lastly, Summers et al. [56] and Pickhardt et al. [57] demonstrated the feasibility to calculate BMD from computed tomographic colonography scans.
Fig. 8
BMD measurements in sagittal reformations of routine contrast-enhanced MDCT in a patient at baseline (a) and follow-up (b). Circular ROIs (red) were manually placed in L1–L3. Note the incident osteoporotic vertebral fracture of L1 at 8-month follow-up
5 Measurements of Bone Microstructure
T-scores and BMD values of patients with versus without osteoporotic fractures overlap as outlined in the Background section [11, 12]. Bone strength reflects the integration of BMD and bone quality including bone microstructure [1]. Therefore, substantial research efforts have been undertaken to assess bone microstructure by using high-resolution imaging techniques to improve fracture risk prediction [58, 59]. Trabeculae have a diameter between 50 and 200 μm and the cortical thickness varies between 0.2 to 5 mm. Thus, the spatial resolution of the imaging techniques used for bone microstructure analysis is critical.
High-resolution peripheral quantitative computed tomography (hr-pQCT) allows for an isotropic spatial resolution of 82 µm3 in-vivo with a relatively low effective dose of approximately 4 μSv for a scan at the distal radius or tibia [60]. However, hr-pQCT systems are limited to peripheral sites and cannot be applied to the spine.
Magnetic resonance imaging (MRI) lacks ionizing radiation. Bone tissue has low MR signal and consequently appears dark in most clinically accessible pulse sequences. Bone marrow has a relatively high MR signal, i.e. has positive contrast, depending on the fat content [fatty (yellow) or hematopoietic (red) bone marrow] and the applied pulse sequence [58, 61]. High-resolution MRI has been performed mostly at the peripheral skeleton such as radius, tibia, and calcaneus due to their easy accessibility. Voxel sizes up to 137 × 137 × 410 μm3 were reported for high-resolution MRI at the distal radius [62, 63]. Due to higher field strength and sequence development, in-vivo MR imaging at the proximal femur as important clinical fracture site has become feasible [61, 64]. In contrast to peripheral sites, the proximal femur contains not only fatty bone marrow, but also hematopoietic bone marrow. The visualization of the trabeculae in the proximal femur is partly obscured by the dark, hematopoietic bone marrow. An even higher percentage of hematopoietic bone marrow is found in the vertebral bodies resulting in insufficient signal-to-noise ratios to obtain high-resolution MR images of the spine.
Related posts:
 Assistance and Intervention in Spine Surgery
 Aided Detection of Bone Metastases in the Thoracolumbar Spine
 Model-Based Vertebra Identification from X-Ray Image(s)
 Spine Reconstruction from Radiographs
 Segmentation, Reconstruction and Analysis of the Vertebral Body from Spinal CT
Stay updated, free articles. Join our Telegram channel

Full access? Get Clinical Tree


