Chapter 2
The cross-sectional imaging techniques and diagnostic approach
Ersan Altun and Richard C. Semelka
The University of North Carolina at Chapel Hill, Department of Radiology, Chapel Hill, NC, USA
The main cross-sectional imaging techniques of the liver include MRI and CT imaging. MR imaging is the best technique for the imaging of the liver and has higher sensitivity and specificity and resultant diagnostic accuracy for the detection and differentiation of hepatic disease processes compared to CT, mainly due to its higher soft tissue contrast resolution despite the fact that the spatial and temporal resolution of MRI is still lower compared to CT (1). However, the gap between MRI and CT in terms of spatial and temporal resolution has been decreasing dramatically in the last 10 years.
The main focus of this book is to summarize the most common disease process of the liver briefly, to define the MR imaging features with characteristic examples and to correlate MR imaging features and examples with their CT counterparts.
Good image quality is crucial for the evaluation of patients in all modalities in modern radiology. Therefore, imaging techniques which will result in good diagnostic image quality should be applied for liver imaging on both MR and CT.
MR imaging techniques
Diagnostic high image quality, reproducibility of this image quality in each sequence and in each patient, and good conspicuity of disease processes require the use of sequences that are fast and consistent and avoid artifacts (2–4). Maximizing these principles to achieve high-quality diagnostic MR images requires the use of fast scanning techniques which result in consistent high diagnostic image quality with the consistent display of disease processes without any artifacts in all patient groups (2–4).
Motion is still the most common and important obstacle for the acquisition of high quality images. Respiration, bowel peristalsis, and vascular pulsations are the major motion artifacts that have lessened the reproducibility of MRI. However, the use of very fast breathing-independent sequences and breath-hold sequences has decreased, and will decrease more with the help of new faster hardware and sequence designs in the future, these artifacts significantly and form the foundation of high-quality and reproducible MRI studies of the abdomen, including the liver.
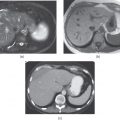
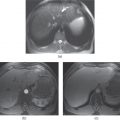
Disease conspicuity depends on the principle of maximizing the difference in signal intensities between diseased tissues and the background tissue in the abdomen. For disease processes situated within or adjacent to fat in the abdomen including the liver, such as capsular/subcapsular liver lesions or portal hilar lesions, this is readily performed by manipulating the signal intensity of fat, which can range from low to high in signal intensity on both T1-weighted and T2-weighted images, depending on the use of fat-suppressed or non-fat-suppressed techniques. For example, diseases that are low in signal intensity on T1-weighted images, such as peritoneal fluid or portal hilar lymph nodes, are more conspicuous on T1-weighted sequences in which fat is high in signal intensity (i.e., sequences without fat suppression) (Figure 2.1). Conversely, diseases which are high in signal intensity on T1-weighted images, such as subacute blood as in subcapsular hematoma, hemorrhage in the gallbladder wall or high protein content, are more conspicuous if fat is rendered low in signal intensity with the use of fat-suppression techniques (Figure 2.2). Additionally, lesions containing abundant amount of fat which show high signal intensity on T1-weighted images also can be differentiated from the subacute blood or protein content with the help of fat-suppressed imaging techniques in which fat containing lesions become hypointense due to fat-suppression (Figure 2.3) in contrast to subacute blood or protein content (Figure 2.2). On T2-weighted images, diseases which are low in signal intensity, such as siderotic or some regenerative liver nodules, lesions with subacute blood or high protein, chronic fibrosis or lesions with fibrosis, are more conspicuous on sequences in which background fat is high in signal intensity, such as non-fat-suppressed sequences (Figure 2.4). Disease processes which demonstrate mild to high signal intensity on T2-weighted sequences, such as focal liver lesions, lymphadenopathy, or mild ascites are most conspicuous using sequences in which fat signal intensity is low, such as fat-suppressed sequences (Figure 2.5).
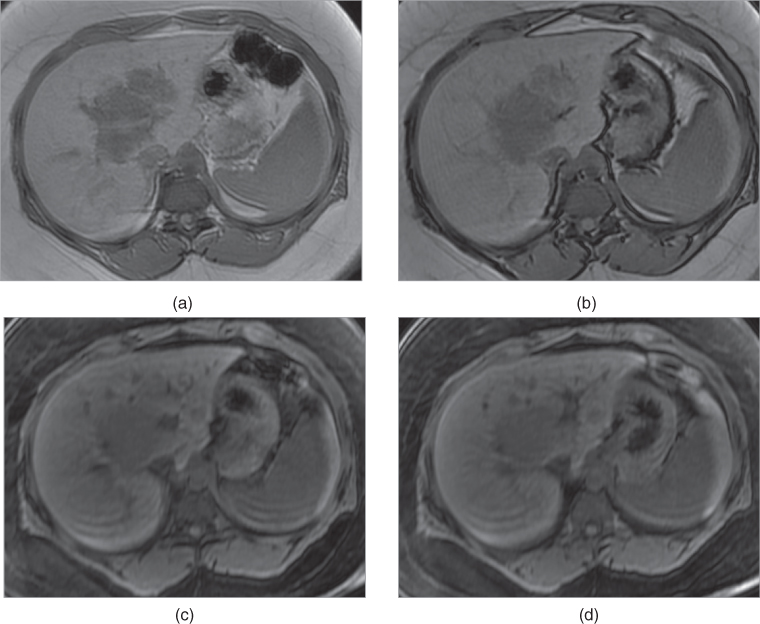
Figure 2.1 Increased conspicuity on non-fat-suppressed T1-weighted Sequences. T1-weighted transverse in-phase (a), out-of-phase (b) 2D-GE, fat-saturated (c, d) 3D-GE images at 3.0 T demonstrate a lesion which invades portal hilus and infiltrates the liver parenchyma in a patient with lymphoma. The lesion is detectable on all sequences; however, it is more conspicuous on in-phase (a) and out-of-phase (b) images. Since the lesion does not contain fat, it does not show any decrease in signal on out-of-phase image (b) compared to in-phase image (a), and on fat-suppressed images (c, d) compared to in-phase image (a).
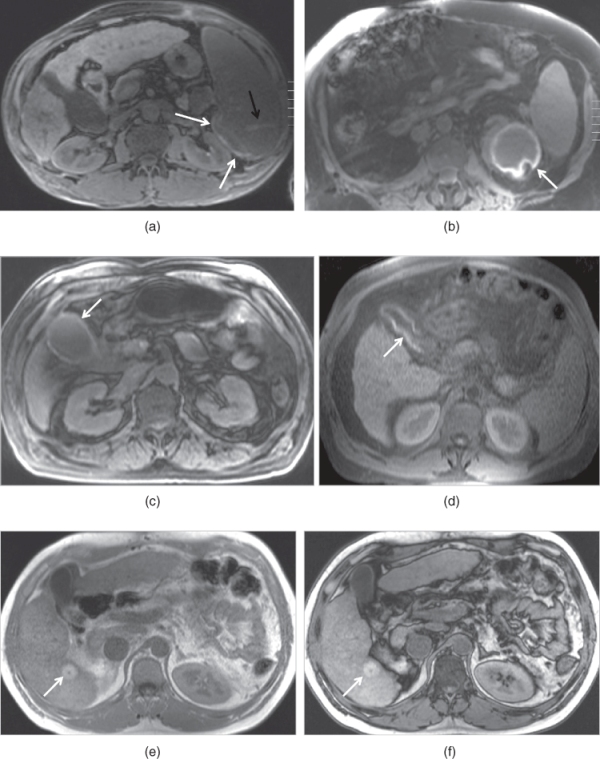
Figure 2.2 Increased conspicuity on fat-suppressed T1-weighted Sequences. T1-weighted transverse fat-saturated 3D-GE images demonstrate early subcapsular hematoma (white arrows; a, b) located in the spleen and the left kidney in two different patients. The subcapsular hematoma located in the spleen shows a capsular high signal intensity linear signal at 3.0 T (a). The subcapsular hematoma located in the left kidney shows peripheral high signal intensity surrounding a low signal core (b). Note the lacerations (black arrow, a) as linear high signal intensity tracks in the spleen as well. T1-weighted transverse fat-saturated 3D-GE image (c) at 3.0 T and 2D-GE (d) image at 1.5 T demonstrate thickened gallbladder walls with high signal (arrows; c, d) in two different patients. High signal intensity of the gallbladder walls is consistent with hemorrhage. The diagnosis in both cases is acute hemorrhagic cholecystitis. T1-weighted transverse 2D-GE in-phase (e) and out-of-phase (f) images at 3.0 T demonstrated a small lesion (arrows; e, f) with high signal which does not demonstrate any signal drop on out-of-phase image (f) compared to in-phase image in another patient. The lesion which is diagnosed as hepatocellular carcinoma did not show any change in the signal intensity of lesion in months. Therefore, the high signal intensity of the lesion in this case is due to its high protein content but not due to hemorrhage. Note the central scar of the tumor as well.
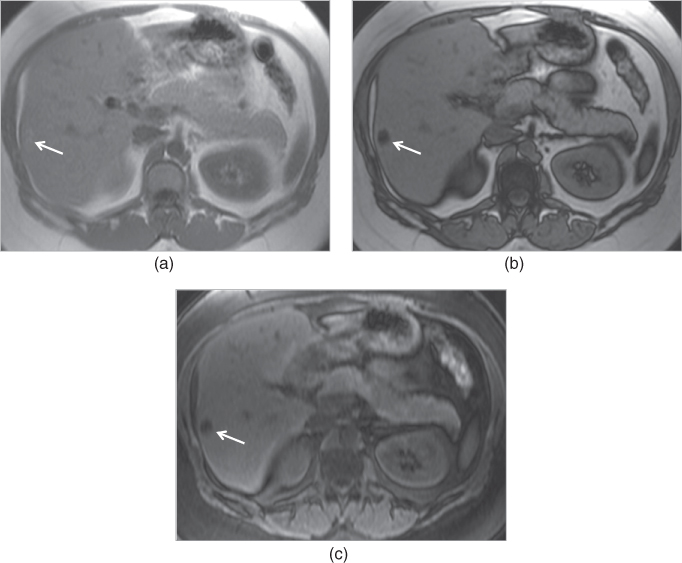
Figure 2.3 Fat containing lesions. T1 weighted transverse 2D-GE in-phase (a), out-of-phase (b) and 3D-GE fat-saturated 3D-GE images demonstrate a hepatic adenoma (arrows, a–c). The lesion shows high signal on in-phase image (a), and prominent signal drop on out-of-phase image (b) and fat-saturated image (c). These findings reveal that the lesion contains large amount of fat.
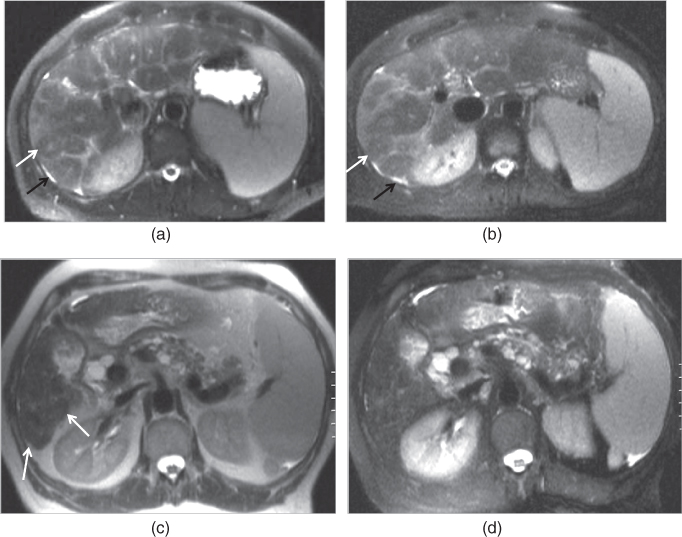
Figure 2.4 Increased conspicuity of regenerative and siderotic nodules on non-fat-suppressed T2-weighted sequences. T2-weighted transverse non-fat-suppressed (a) and fat-suppressed (b) single shot echo train spin echo sequences demonstrate macronodular regenerative nodules in a cirrhotic patient. Macronodular regenerative nodules (white arrows; a, b) which demonstrate low signal with central focal high signal on both images, are slightly better appreciated on non-fat-suppressed image. Note the mild ascites (black arrows; a, b) located in the perihepatic space and enlarged spleen developing secondary to portal hypertension. T2-weighted transverse non-fat-suppressed (c) and fat-suppressed (d) single shot echo train spin echo sequences demonstrate siderotic nodules and micronodular regenerative nodules in a cirrhotic patient with common bile duct dilation and multiple cysts located in the pancreas secondary to chronic pancreatitis. The nodules (arrows, c) in the cirrhotic liver demonstrate low signal on both images; however, these nodules are slightly better appreciated on non-fat-suppressed T2-weighted image (c).
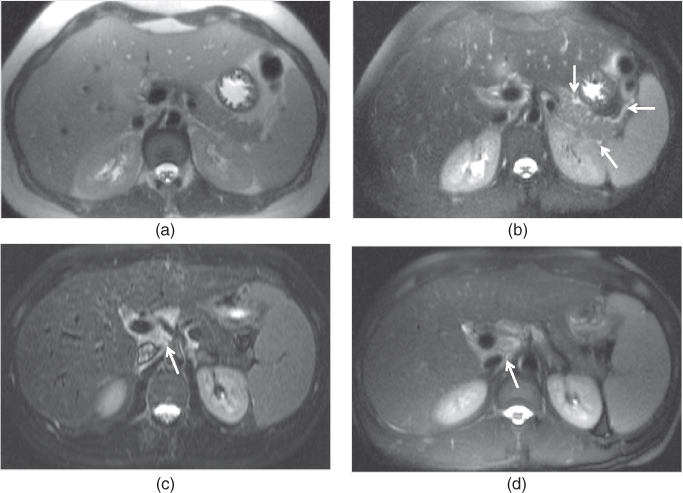
Figure 2.5 Increased conspicuity on fat-suppressed T2-weighted sequences. T2-weighted transverse non-fat-suppressed (a) image does no and fat-suppressed (b) single shot echo train spin echo images in a patient with mild acute pancreatitis. The presence of mild peripancreatic free fluid (arrows, b) is not appreciated on non-fat-suppressed image (a) but is seen on fat-suppressed image (b). T2 weighted fat-suppressed single shot echo train spin echo (c) and short tau inversion recovery (d) sequences demonstrate multiple lymph nodes (arrows; c, d) showing high signal at the porta hepatis in another patient with Hepatitis C.
Gadolinium-enhanced imaging (Figure 2.6) is routinely performed on three phases, including the hepatic arterial dominant, early hepatic venous, and interstitial phases, respectively. An additional hepatocyte phase may also be acquired as a fourth and delayed phase, depending on employed contrast media, protocol, or specific medical condition of the patient.
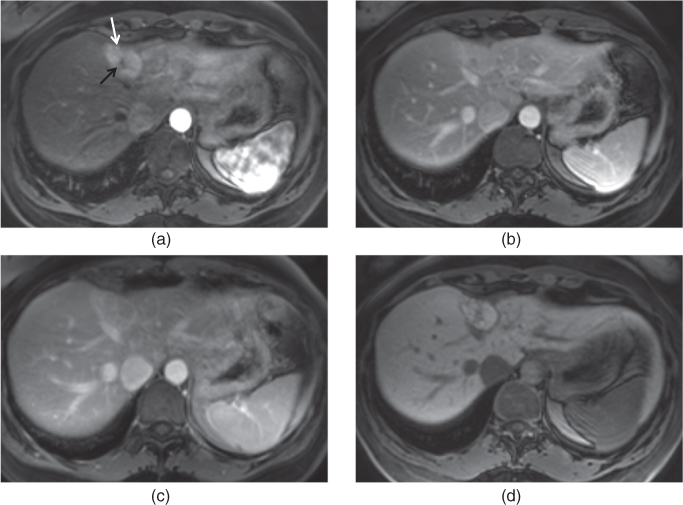
Figure 2.6 Phases of enhancement. T1-weighted 3D-GE post-gadolinium hepatic arterial dominant (a), early hepatic venous (b), interstitial (c) and hepatocyte (d) phase images at 3.0 T obtained with the use of gadobenate dimeglumine (Multihance) which is a hepatocyte specific gadolinium based contrast agent demonstrate a focal nodular hyperplasia (white arrow, a). The capillary enhancement of the lesion is evaluated on the hepatic arterial dominant phase (a), and is characterized by the prominent homogeneous enhancement. The drainage of the interstitial space is evaluated on the interstitial phase (c). The interstitial space of the lesion is drained more rapidly compared to the interstitial space of the remaining liver parenchyma so that the lesion becomes isointense to the remaining liver parenchyma on this phase. The central scar of the lesion (black arrow, a) contains fibrosis; therefore, it shows enhancement on the interstitial phase (c) but not on the hepatic arterial dominant phase. Note the capsular enhancement of the lesion as well on the interstitial phase (c). On the early hepatic venous phase (b), the lesion tends to become isointense to the remaining liver parenchyma. The hepatic veins are patent on the early hepatic venous and interstitial phases. On the hepatocyte phase (d), the lesion shows enhancement and becomes isointense to the remaining liver parenchyma due to the presence of hepatocytes and biliary canaliculi.
Gadolinium-enhanced imaging (Figure 2.6) provides at least three further imaging properties that facilitate detection and characterization of disease, specifically, the pattern of blood delivery (i.e., capillary enhancement which is evaluated on the hepatic arterial dominant phase), the patency of hepatic venous and portal venous systems (i.e., venous enhancement which is detected on the hepatic venous phase), and the size and/or rapidity of drainage of the interstitial space (i.e., interstitial enhancement which is evaluated on the interstitial phase) (5). Additionally, hepatocyte specific gadolinium-enhanced imaging phase demonstrates the intracellular distribution of hepatocyte specific gadolinium agents within the liver and their resultant excretion within the bile ducts (6).
The great majority of diseases can be characterized by defining their appearance on T1-, T2-weighted and different phases of postgadolinium T1-weighted images.
T1-weighted sequences
T1-weighted sequences are routinely useful for investigating diseases of the abdomen and pelvis, including the liver. The primary information that precontrast T1-weighted images provide includes (i) information on abnormally increased fluid content or fibrous tissue content that appears low in signal intensity on T1-weighted images (Figure 2.1), and (ii) information on the presence of subacute blood or concentrated protein, which are both high in signal intensity on T1-weighted images (Figure 2.2). T1-weighted sequences obtained without fat suppression also demonstrate the presence of fat as high signal intensity tissue (Figure 2.3). The routine use of an additional fat attenuating technique permits reliable characterization of fatty lesions (Figure 2.3). In the abdomen and pelvis, gradient echo (GE) sequences including spoiled gradient echo (SGE) or three dimensional gradient echo (3D-GE) sequences are preferred to spin-echo sequence. GE sequences have a number of advantages over spin-echo sequences: (i) Similar T1 tissue contrast can be generated with GE sequences as spin-echo sequences in much shorter acquisition times. The two most important implications of this advantage include the use of breath-hold imaging to minimize motion artifacts and the ability to perform contrast-enhanced dynamic exams of the abdomen, including the liver with distinct arterial, venous, and interstitial phases in breath-hold times. (ii) GE sequences enable the use of chemical shift imaging for the detection of small amounts of fat in organs or lesions such as fatty infiltration of the liver or hepatocellular adenomas, hepatocellular carcinomas (HCCs), and angiomyolipomas (7).
Gradient echo sequences
The most commonly used GE sequences for routine abdominal imaging are SGE and 3D-GE sequences.
SGE sequences (Figure 2.7) are two dimensional sequences and can also be used as a single (breathing independent) or multi acquisition (breath hold) technique. Image parameters for breath-hold SGE sequences involve (1) relatively long repetition time (TR) (approximately 150 ms) and (2) the shortest in-phase echo time (TE) (approximately 4.4 ms at 1.5 T, 2.2 ms at 3.0 T), both to maximize signal-to-noise ratio (SNR) and the number of sections that can be acquired in one multisection acquisition (7, 8). For routine T1-weighted images, in-phase TE are preferable to the shorter out-of-phase echo times (2.2 ms at 1.5 T, 1.1 ms at 3.0 T), to avoid both phase-cancellation artifact around the borders of organs and fat-water phase cancellation in tissues containing both fat and water protons. Flip angle should be approximately 70° to 90° to maximize T1-weighted information. Using the body coil, the SNR of 2D SGE sequences is usually suboptimal with section thickness less than 8 mm, whereas with the phased-array multicoil, section thickness of 5 mm results in diagnostically adequate images. On new MRI machines more than 22 sections may be acquired in a 20-s breath hold (7, 8).
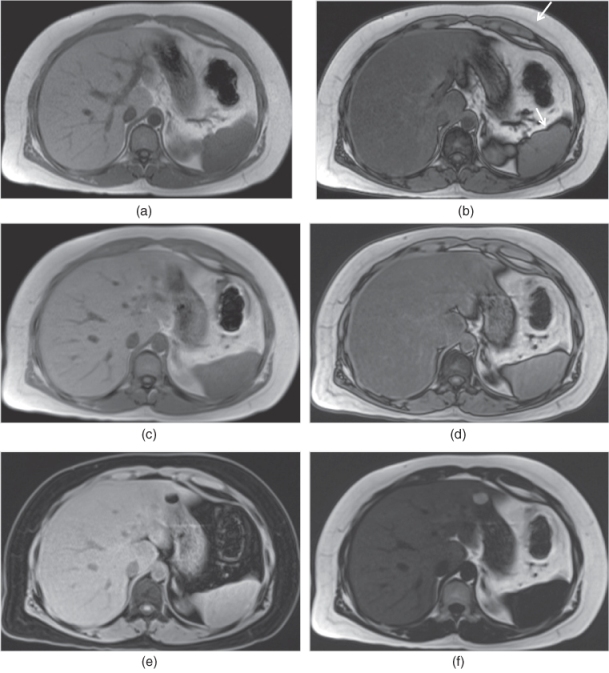
Figure 2.7 GE Sequences. T1-weighted transverse in-phase (a) and out-of-phase (b) SGE images demonstrate fatty liver which shows signal drop on out-of-phase image (b). Note the phase cancellation artifact (chemical shift artifact or Indian ink artifact) (arrows, b) as linear hypointense band around the borders of organs on out-of-phase image (b). Fat-water phase cancellation is present in the fatty liver tissue containing both fat and water protons resulting in signal drop on out-of-phase image (b) compared to in-phase image (a). T1-weighted transverse 3D-GE in-phase (c), out-of-phase (d), water-only (e) and fat-only (f) images demonstrate fatty liver in the same patient. The image quality of in-phase and out-of-phase 3D-GE images (c, d) are almost equal to the image quality of SGE images (a, b). Water-only 3D-GE image (e) only demonstrates the water signal of the tissues; therefore, the fat signal is attenuated. Fat-only 3D-GE image (f) only demonstrates the fat signal of the tissues. Since the liver is fatty, increased signal coming from the fat content of the liver is detected on the fat-only image (f).
In single-shot techniques, all of the k-space lines for one slice are acquired before acquiring the lines for another slice, that is, in sequential rather than interleaved fashion. SGE may be modified to a single-shot technique by minimizing TR, to achieve breathing-independent images for noncooperative patients (7, 8).
GE sequences can be performed as a 3D acquisition, which can be used both for volumetric imaging of organs such as the liver and for pre- and postgadolinium administration.
A 3D-GE sequence is typically performed with minimum TR and TE and a flip angle between 10° and 15°. The flip angle is related to the TR to maximize T1 signal. With a minimum TR, flip angle can also be relatively low and still achieve good T1 contrast. As TR and TE of these sequences have minimum values (TR < 5 ms and TE < 2.5 ms), the flip angle will mainly determine the contrast in the images. In 3D-GE, a volume of data is obtained rather than individual slices. There are several advantages of 3D versus 2D GE sequences: (i) higher inherent SNR than 2D GE sequences, (ii) higher in-plane resolution with larger matrices, (iii) contiguous, thinner sections for higher through plane resolution which facilitates reformats in other planes, (iv) homogenous and fast fat-suppression, which allows scan times that are still short enough to perform breath-hold imaging with fat suppression, (v) the enhancement of vessels and tissues with gadolinium is more obvious because of the fat suppressed nature of the sequence, (vi) gadolinium-enhanced 3D-GE sequences also are the most clinically effective techniques for MR angiography (MRA) of the body (7, 8).
3D-GE sequences, in combination with or without robust segmented fat-suppression techniques, overlapping reconstruction, and in-plane as well as through-plane interpolation of the MR data, allow high quality imaging with larger volume coverage in breath-hold times. 3D-GE sequences can be obtained with sufficient anatomic coverage, very thin sections, and high spatial resolution matrices in scan times of only 15–20 s.
Precontrast in-phase and out-of-phase 3D-GE sequences (Figure 2.7) can be acquired with high image quality, although the image quality is slightly below the image quality of 2D SGE. However, their higher spatial resolution is their main advantage. Additionally, the four-point Dixon method allows the acquisition of water-only and fat-only images (Figure 2.7).
3D-GE is particularly suitable for dynamic contrast-enhanced MR imaging because of its excellent inherent fat suppression and sensitivity to enhanced tissues and abnormalities. Currently, most of the 3D-GE sequences used for dynamic gadolinium-enhanced MR exams employ sequential k-space filling as opposed to the sequences with centric or elliptic-centric k-space filling used in MRA in most centers. These beneficial features, in combination with clinically viable acquisition breath hold times, make 3D-GE the primary technique over 2D SGE for dynamic contrast enhanced imaging of the abdomen and pelvis, including the liver (Figure 2.6) (7, 8).
Additionally, 3D-GE sequences with radial acquisition have recently been used in noncooperative patients who cannot hold their breaths. In noncooperative patients, pre and postgadolinium fat-suppressed T1-weighted imaging can be performed with 3D-GE sequences acquired with radial acquisition without breath holding.
Fat-suppressed gradient echo sequences
Fat-suppressed SGE or 3D-GE sequences are routinely used as precontrast images (Figure 2.8). They are important for the detection of subacute blood, high protein content, and fat containing lesions, and particularly for the evaluation of pancreas (Figure 2.8). Image parameters are similar to those for standard SGE or 3D-GE; however, it is advantageous to employ a lower out-of-phase echo time (2.2 to 2.5 ms at 1.5 T) for SGE, which benefits from additional fat-attenuating effects, and also increases SNR and the number of sections per acquisition. Fat-suppressed 3D-GE sequences are now routinely used for the acquisition of fat-suppressed precontrast T1-weighted images. Although the contrast resolution of fat-suppressed 3D-GE is mildly lower compared to fat-suppressed SGE, the acquisition of thin sections with higher matrices is advantageous (7, 8).
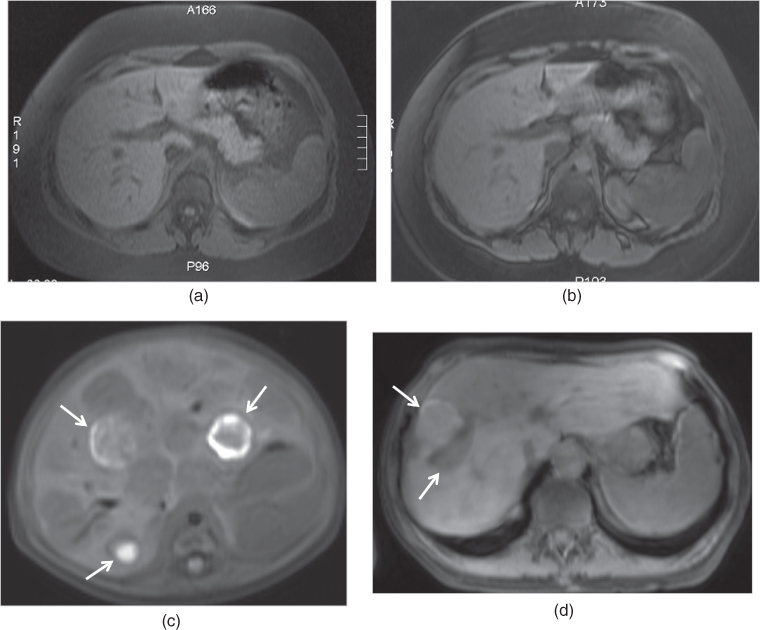
Figure 2.8 Fat-suppressed GE sequences. T1-weighted transverse SGE (a) and 3D-GE (b) fat-suppressed images demonstrate normal pancreas with high signal intensity in the same patient. This sequence is particularly essential for the detection of focal lesions such as pancreatic adenocarcinoma, and diffuse disease processes such as pancreatitis and pancreatic fibrosis. Note that the image quality of SGE is slightly better compared to 3D-GE image while the fat-suppression of 3D-GE is better compared to SGE. T1-weighted transverse fat-suppressed SGE image (c) demonstrate multiple hypointense nodular lesions containing hemorrhage which shows high signal in an infant with infantile hemangioendothelioma. T1-weighted transverse fat-suppressed 3D-GE image (d) demonstrate hemorrhagic metastasis in another patient carcinoid tumor.
Fat-suppressed-SGE and 3D-GE images are often used to acquire postgadolinium images (Figure 2.6). Fat-suppression is particularly essential for interstitial-phase gadolinium-enhanced images. The complementary roles of gadolinium enhancement, which generally increases the signal intensity of disease tissue, and fat suppression, which diminishes the competing high signal intensity of background fat, are particularly effective at maximizing conspicuity of diseased tissue (7, 8).
Out-of-phase gradient echo sequences
Out-of-phase (opposed-phase) SGE images are useful for demonstrating diseased tissue in which fat and water protons are present within the same voxel. A TE = 2.2 ms is advisable at 1.5 T. A TE = 6.6 ms is also out-of-phase at 1.5 T but the shorter TE of 2.2 ms is preferable as more sections can be acquired per sequence acquisition, the signal is higher, the sequence is more T1-weighted, and in combination with a T2-weighted sequence, it is easier to distinguish fat and iron in the liver. At TE = 6.6 ms both fat and iron in the liver result in signal loss relative to the TE = 4.4 ms in-phase sequence; while on TE = 2.2 ms out-of-phase sequences fat is darker and iron is brighter relative to TE = 4.4 ms, facilitating their distinction (Figure 2.9). At 3.0 T, the shortest in-phase and out-of-phase values are 2.2 and 1.1 ms, respectively. It is not possible to acquire the first echoes at these optimal in-phase and out-of-phase TE times due to gradient capabilities, unless separate in-phase and out-of-phase acquisitions are used or highly asymmetric echoes are utilized in a single scan. Therefore, asymmetric TE values can be preferred for in-phase (2.5 ms) and out-of-phase (1.58 ms) echoes and these values vary depending on the vendor. When acquiring in-phase/out-of-phase GE sequences, it is essential to use an opposed-phase TE which is less than the in-phase TE. Additionally, it is also possible to acquire in-phase and out-of-phase images with high in-plane and through-plane spatial resolution with the help of 3D-GE sequences; however, the image quality of this technique is still developing (7, 8).
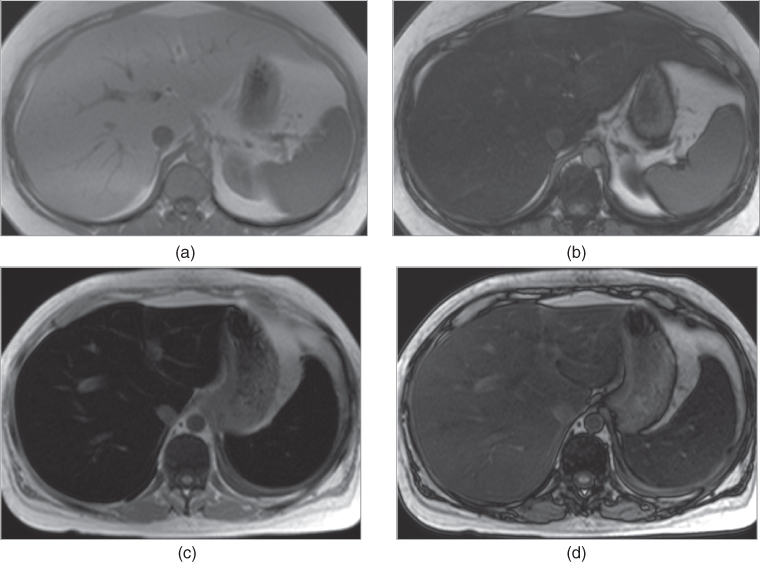
Figure 2.9 Detection of fatty liver and transfusional hemosiderosis on SGE sequences. T1-weighted transverse in-phase (a) and out-of-phase (b) SGE images demonstrate diffuse fatty infiltration of the liver which is characterized by the signal drop on out-of-phase image (TE = 2.2 ms) compared to in-phase image (TE = 4.4 ms). This is due to phase cancellation of fat and water signal located in the same tissue. T1-weighted transverse in-phase (c) and out-of-phase (d) images demonstrate diffuse iron deposition in the liver and spleen. Iron deposition is characterized by low signal of the hepatic and splenic parenchyma on in-phase image (TE = 4.4 ms) and by relatively increased signal of the hepatic and splenic parenchyma on out-of-phase image (TE = 2.2 ms) compared to in-phase image. This is due to the effect of shorter TE times used on out-of-phase images.
The most common indication for an out-of-phase sequence is the presence of fat in the organs or lesions such as fatty infiltration of the liver, or hepatic adenoma, or HCCs (Figures 2.3, 2.9, and 2.10). Another useful feature is that the generation of a phase-cancellation artifact around high signal intensity masses, located in water-based tissues, confirms that these lesions are fatty. An example of this is angiomyolipoma of the liver (Figure 2.10). In addition to out-of-phase effects, the different TE, for the out-of-phase sequence compared to the in-phase sequence, provides information on magnetic susceptibility effects that increase with increase in TE. This can be used to distinguish iron-containing structures (e.g., surgical clips, iron deposition in the liver, gamna gandy bodies in the spleen) from nonmagnetic signal void structures (e.g., calcium) (Figures 2.9 and 2.11). To illustrate this point, the signal void susceptibility artifact from surgical clips increases in size, from a shorter TE (e.g., 2.2 ms) out-of-phase sequence to a longer TE (e.g., 4.4 ms) in-phase sequence, whereas the signal void from calcium remains unchanged (7, 8). Therefore, 3D-GE or SGE with out-of-phase TE can be used for pre- and postcontrast imaging in patients with prominent susceptibility artifacts which arise from metallic implants, clips, prostheses, or air (free air or bowel gas) and impair the evaluation of adjacent structures, because short TE times decrease the size of those artifacts compared to long TE times as on in-phase images.
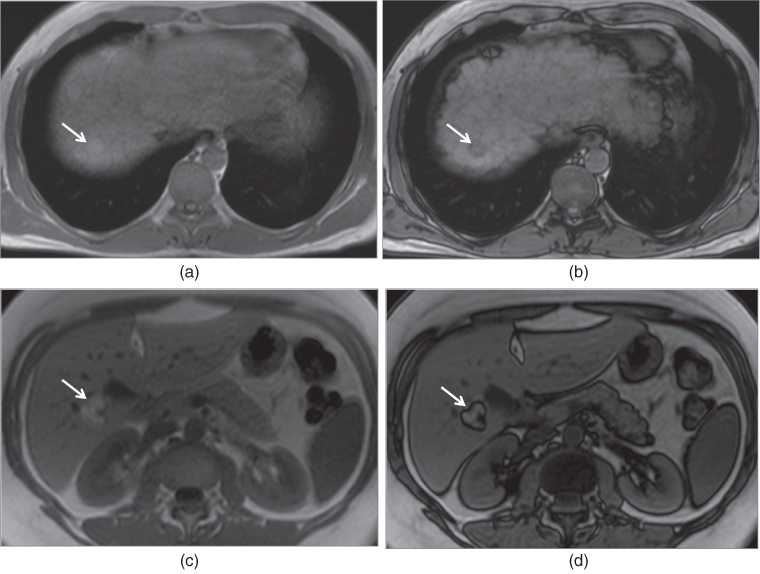
Figure 2.10 Detection of fat content of HCC and angiomyolipoma on SGE sequences. T1-weighted transverse in-phase (a) and out-of-phase (b) SGE images demonstrate a small HCC which shows high signal on in-phase image and signal drop on out-of-phase image due to its fat content. T1-weighted transverse in-phase (c) and out-of-phase (d) SGE images demonstrate an angiomyolipoma which shows high signal on both in-phase and out-of-phase images, and phase cancellation artifact around the borders of the lesion. Lesions with abundant fat content do not show signal drop as in angiomyolipomas.
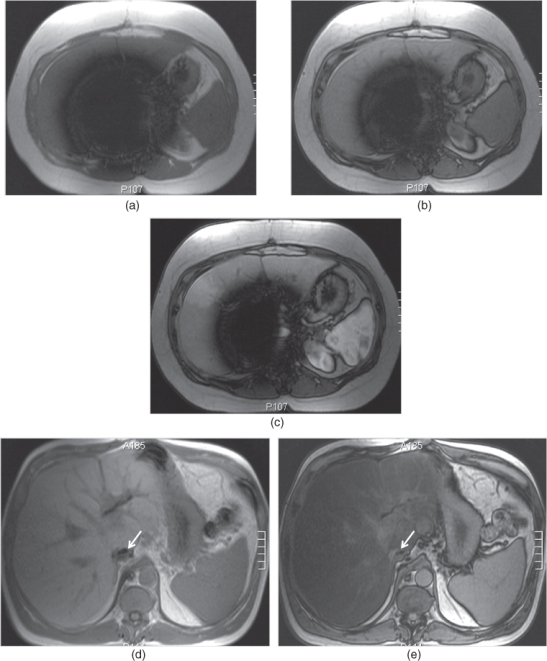
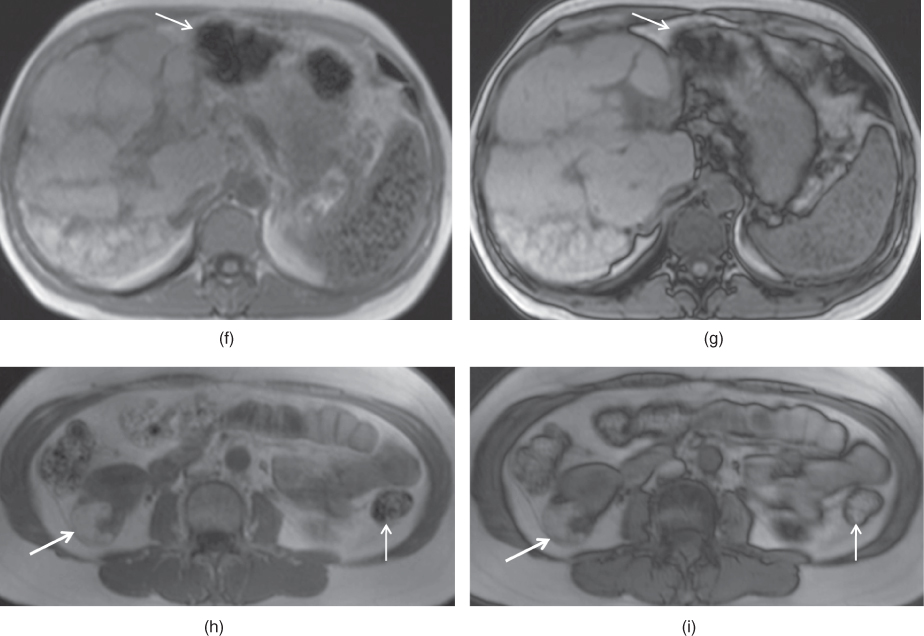
Figure 2.11 Change in the size of susceptibility artifacts on SGE sequences. T1-weighted transverse in-phase (a), out-of-phase (b) and post-gadolinium hepatic arterial dominant phase (c) SGE images show the decrease in the size of prominent susceptibility artifact arising from IVC filter with short TE times. The artifact is very large and impairs the diagnostic evaluation. However, the artifact decreases in size when shorter TE times (TE = 2.2 ms) are employed on pre-contrast (b) and post-contrast (c) out-of-phase images compared to in-phase (TE = 4.4 ms) image (a). T1-weighted transverse in-phase (d) and out-of-phase (e) SGE images demonstrate the susceptibility artifacts arising from the surgical clips adjacent to the IVC in a patient with liver transplantation. The artifact (arrows; d, e) decreases in size on out-of-phase image compared to in-phase image due to the use of shorter TE times on out-of-phase image. Note that the liver shows signal drop on out-of-phase image compared to in-phase image due to its fat content. T1-weighted transverse in-phase (f) and out-of-phase (g) SGE images in a patient with primary sclerosing cholangitis (PSC). The liver is bizarre shaped and its contours are very irregular due to PSC. Gamna-gandy bodies containing iron are present within the spleen. Since gamna-gandy bodies contain iron, the size and number of these nodules demonstrate decrease on shorter TE sequences including short TE out-of-phase images. T1-weighted transverse in-phase (h) and out-of-phase (i) SGE images demonstrate an angiomyolipoma (thick arrows; h, i) located in the right kidney which shows partial signal decrease and phase cancellation artifact due to its abundant fat content on out-of-phase image. Also note that the susceptibility artifacts (thin arrows; f–i) arising from the bowel gas decreased in size with short TE times employed on out-of-phase imaging.
Magnetization-prepared rapid-acquisition gradient echo (MP-RAGE) sequences
One limitation of GE sequences, both SGE and 3D-GE, is relative motion sensitivity, and requirement for cooperation by the patient in following breathing instructions. Despite using relatively short breath-hold times, motion artifacts are still the most common and important obstacle for the acquisition of good image quality (Figure 2.12). Therefore, the development of extremely fast breath-hold and/or breathing-independent sequences, which would dramatically reduce the motion artifacts, is still in progress.
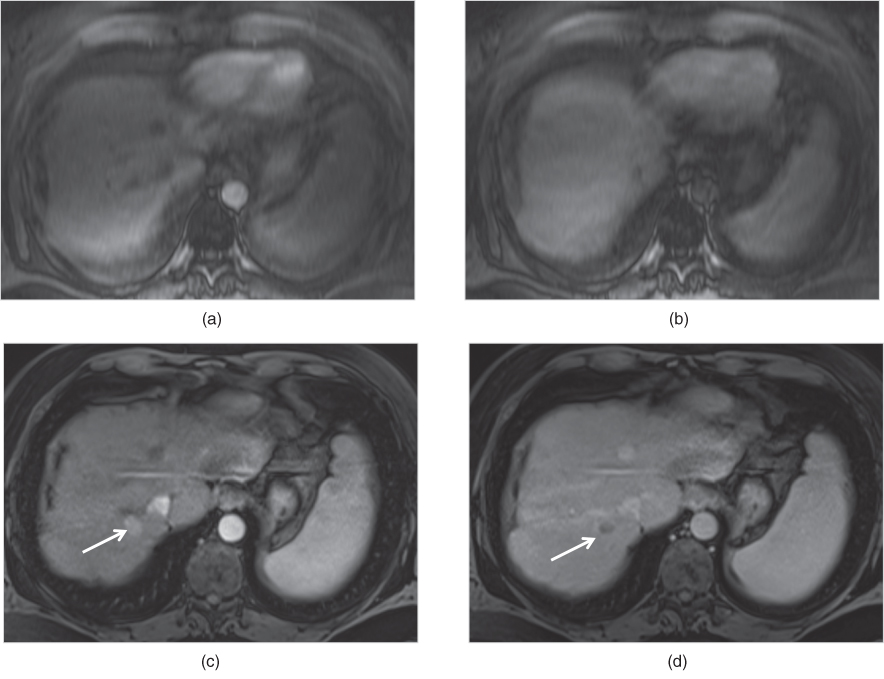
Figure 2.12 Motion artifacts. Transverse T1-weighted fat-suppressed 3D-GE images acquired at 1.5 T on the early arterial phase (a) and interstitial phase (b) are blurred due to motion artifacts and no lesion is detected. However, transverse T1-weighted fat-suppressed 3D-GE images acquired at 1.5 T one month later shows a lesion with higher enhancement (arrow, c) on the hepatic arterial dominant phase (c) and washout (arrow, d) on the interstitial phase (d). Note that the enhancement of the tumor, which is a hepatocellular carcinoma, could not be demonstrated on the early arterial phase image (a) because of the incorrect timing in addition to the motion artifacts. Furthermore, the washout of the tumor could not be detected on the interstitial phase (b) due to motion artifacts.
In uncooperative patients, GE sequences may be modified as a single-shot technique using the minimum TR to achieve breathing-independent images. Such sequences have included so-called magnetization prepared rapid acquisition gradient echo (MP-RAGE). MP-RAGE sequences include turbo fast low-angle shot (turboFLASH) sequence. In 2D multi-section varieties, these techniques are generally performed as a single shot, with image acquisition duration of 1 to 2 s, which renders them relatively breathing-independent. Magnetization preparation is currently performed with a 180° inversion pulse to impart greater T1-weighted information. The inversion pulse may be either slice or non-slice selective. Slice-selective means that only the tissue section that is being imaged experiences the inverting pulse, while non-slice-selective means that all the tissue in the bore of the magnet experiences the inverting pulse. The advantage of a non-slice-selective inversion pulse is that no time delay is required between acquisition of single sections in multiple single-section acquisition. A stack of single-section images can be acquired in a rapid fashion. This is important for dynamic gadolinium-enhanced studies. A non-slice-selective inversion pulse results in slightly better image quality, particularly because flowing blood is signal-void. Approximately 3 s of tissue relaxation is required between acquisition of individual sections, which limits the usefulness of this sequence for dynamic gadolinium-enhanced acquisitions. Current versions of MP-RAGE are limited because of low signal-to-noise, varying signal intensity and contrast between sections, unpredictable bounce-point boundary artifacts due to signal-nulling effects caused by the inverting 180° pulse, and unpredictable nulling of tissue enhanced with gadolinium (Figure 2.13). Research is ongoing to solve these problems with MP-RAGE so that it may assume a more important clinical role. Routine use of a high quality MP-RAGE sequence would further increase the reproducibility of MR image quality by obviating the need for breath-holding, particularly in patients unable to suspend respiration (Figure 2.13). 3.0 T MR imaging particularly improves the image quality of MPRAGE sequences due to higher signal to noise ratio and greater spectral separation (Figure 2.13) (7, 9, 10). Additionally, the use of spatial-spectral selective water excitation (WE), which is a special fat suppression technique compatible with MPRAGE sequence, allows the use of fat suppression with MPRAGE, particularly on postgadolinium sequences (Figure 2.13). Spatial-spectral selective WE is a newer fat-attenuation technique which selectively excites water protons, leaving protons in fat unperturbed, rather than exciting all protons and then spoiling the signal from fat protons (10).
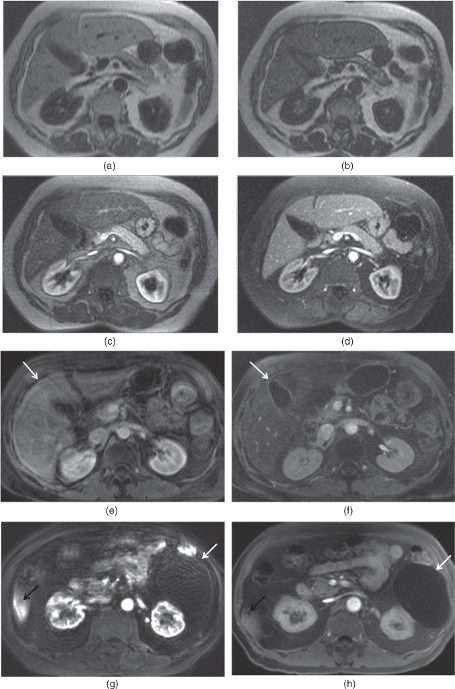
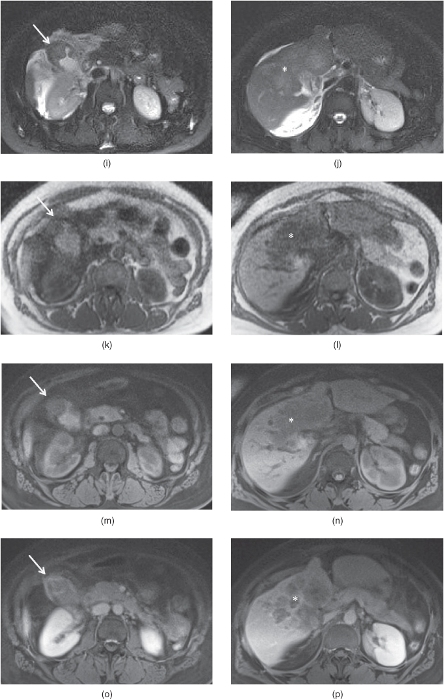
Figure 2.13 MPRAGE sequences and 3D-GR sequences with radial sampling. T1-weighted transverse in-phase (a), out-of-phase (b), hepatic arterial dominant phase (c) and early hepatic venous phase water excitation (d) MPRAGE images demonstrate fair but diagnostic image quality in an uncooperative patient with fatty liver. The liver shows mild signal drop on out-of-phase image. Fair image quality of MPRAGE sequences is due to lower signal to noise ratio, higher susceptibility artifacts and signal nulling effects such as varying signal intensity – contrast between sections, unpredictable bounce-point boundary artifacts and unpredictable nulling of tissue with gadolinium. Note that the kidneys show low signal on pre-contrast MPRAGE images due to signal nulling effects. T1-weighted transverse post-gadolinium 3D-GE image (e) acquired in a non-cooperative patient at 1.5 T is not diagnostic due to breathing artifacts; however, post-gadolinium water excitation (WE) MPRAGE image (f) acquired with a breathing independent technique is diagnostic without breathing artifacts with fair image quality. Note that even the gallbladder (arrows; e, f) on 3D-GE image at 1.5 T (e) is not visualized well due to breathing artifacts. However, all organs are visualized well with WE-MRAGE sequence at 1.5 T (f). T1-weighted transverse post-gadolinium 3D-GE image (g) acquired in a non-cooperative patient at 3.0 T is not diagnostic due to breathing artifacts; however, post-gadolinium WE-MPRAGE image (h) acquired with a breathing independent technique is diagnostic without breathing artifacts with good image quality. Note that even the big renal cyst (white arrows; g, h) is not visualized well on 3D-GE at 3.0 T due to breathing artifacts while even the small liver cyst (black arrows; g, h) is visualized well on WE-MPRAGE sequence at 3.0 T. WE-MPRAGE sequence at 3.0 T has superior image quality compared to 1.5 T due to its higher signal to noise ratio. Noncooperative patient protocol including transverse fat-suppressed T2-weighted SS-ETSE (i, j), T1-weighted in-phase MP-RAGE (k, l), precontrast fat-suppressed T1-weighted 3D-GE sequences with radial sampling (m, n), postgadolinium fat-suppressed T1-weighted 3D-GE sequences with radial sampling acquired on the interstitial phase demonstrate infiltrative gallbladder cancer involving the liver. A gallbladder tumor arising from the gallbladder wall is detected (arrows; i, k, m, o). The tumor is large extending into the liver and shows heterogeneous enhancement (asteriks; j, l, n, p). Note the higher image quality of 3D-GE sequences with radial sampling compared to MPRAGE sequences. Source: Semelka 2010. Reproduced with permission of Wiley.
T2-weighted sequences
The predominant information provided by T2-weighted sequences includes (i) the presence of increased fluid in diseased tissue, which results in high signal intensity, (ii) the presence of chronic fibrotic tissue, which results in low signal intensity, and (iii) the presence of iron deposition, which results in very low signal intensity.
Echo-train spin-echo sequences
Echo-train spin-echo (ETSE) sequences are termed fast spin-echo, turbo spin-echo, or rapid acquisition with relaxation enhancement (RARE) sequences. The principle of ETSE sequences is to summate multiple echoes within the same repetition time interval to decrease examination time, increase spatial resolution, or both.
ETSE sequences allows the acquisition of higher matrices with shorter acquisition times and resultant decreased motion artifacts compared to conventional T2-weighted spine echo sequences. Due to this advantage, ETSE sequences are generally used for evaluation of the pancreaticobiliary ductal system.
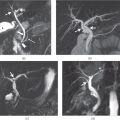
ETSE sequences, acquired as contiguous thin 2D sections, 3D thin section, or as a thick 3D volume slab, form the basis for MR cholangiography (Figure 2.14). The greatest concern with high resolution 3D ETSE sequences is the significant increase in specific absorption rate (SAR). This is particularly relevant as most 3D implementations must increase the echo-train length compared to 2D varieties because of the added data that needs to be acquired. Recently, newer MR systems, in combination with advances in gradient and software design, have allowed the development of efficient long echo-train 3D ETSE using variable flip angle refocusing pulses. Concerns of SAR are offset by using smaller (constant or variable) flip angles during data acquisition. With this strategy, T2 information can be maintained throughout the echo-train, or used more effectively, for high SNR imaging. Efficiency is further aided by implementing an additional “restore” pulse at the end of data collection to expedite magnetization recovery, allowing shorter TRs (∼1200 ms) to be used for T2 imaging. These recent modifications to conventional 3D-ETSE imaging have made high resolution isotropic T2 imaging of the pelvis and biliary system feasible in a relatively short acquisition time (∼5 min) (7, 11).
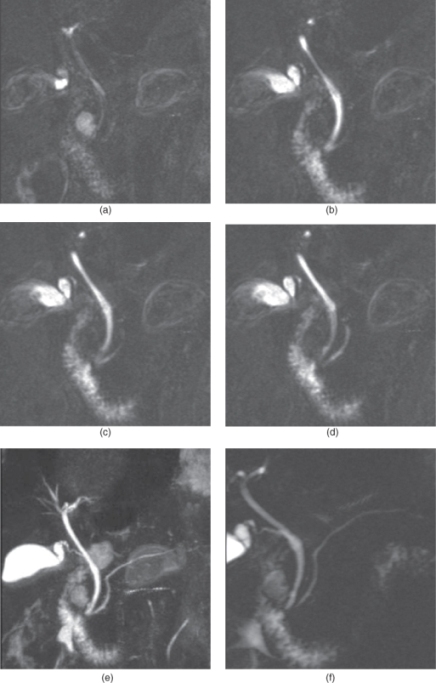
Figure 2.14 MRCP. T2-weighted echo train spin echo 3D thin section MRCP source images (a–d), maximum intensity projection (MIP) reconstruction image (e) and thick section MRCP image (f) show normal intra and extrahepatic bile ducts, normal ampulla of vater and normal pancreatic duct. T2-weighted echo train spin echo 3D thin section MRCP source images (a–d), maximum intensity projection (MIP) reconstruction image (e) and thick section MRCP image (f) show normal intra and extrahepatic bile ducts, normal ampulla of vater and normal pancreatic duct. Source: Semelka 2010. Reproduced with permission of Wiley.
Single-shot echo-train spin-echo sequence
Single-shot ETSE sequence (e.g.: half-fourier acquisition single shot turbo spin-echo (HASTE), single shot fast or turbo spin echo (SSFSE or SSTSE) or single shot echo-train spin echo (SS-ETSE) is a breathing independent T2-weighted sequence that has had a substantial impact on abdominal imaging (Figures 2.4 and 2.5). Typical imaging involves a 400 ms image acquisition time, in which k-space is completely filled using half-Fourier reconstruction. Shorter effective echo time (e.g., 60 ms) is recommended for bowel-peritoneal disease, and longer effective echo time (e.g., 100 ms and greater) is recommended for liver-biliary disease. Since the technique is single-shot, the echo train length is typically greater than 100 echoes, while the effective TR for one slice is infinite. A stack of sections should be acquired in single-section mode in one breath-hold to avoid slice misregistration; however, the method lends itself to free-breathing application under uncooperative imaging circumstances. Recently, 3D versions of this technique have been implemented. Motion artifacts from respiration and bowel peristalsis are obviated; chemical-shift artifact is negligible; and susceptibility artifact from air in bowel, lungs, and other locations is minimized, such that the bowel wall is clearly demonstrated (Figure 2.15). Similarly, susceptibility artifact from metallic devices such as surgical clips or hip prostheses is minimal (Figure 2.15). All of these effects render SS-ETSE an attractive sequence for evaluating abdomino-pelvic disease. In patients with implanted metallic devices and extensive surgical clips, SS-ETSE is the sequence least affected by metal susceptibility artifact (7, 11).
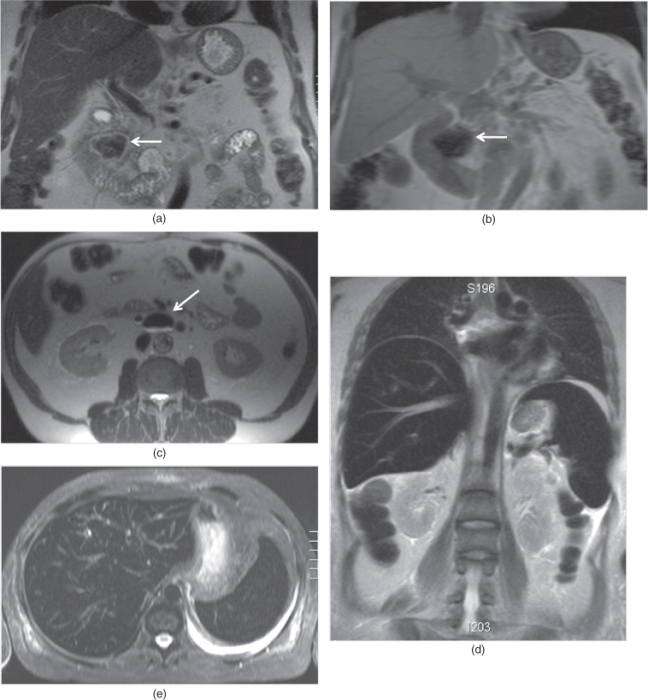
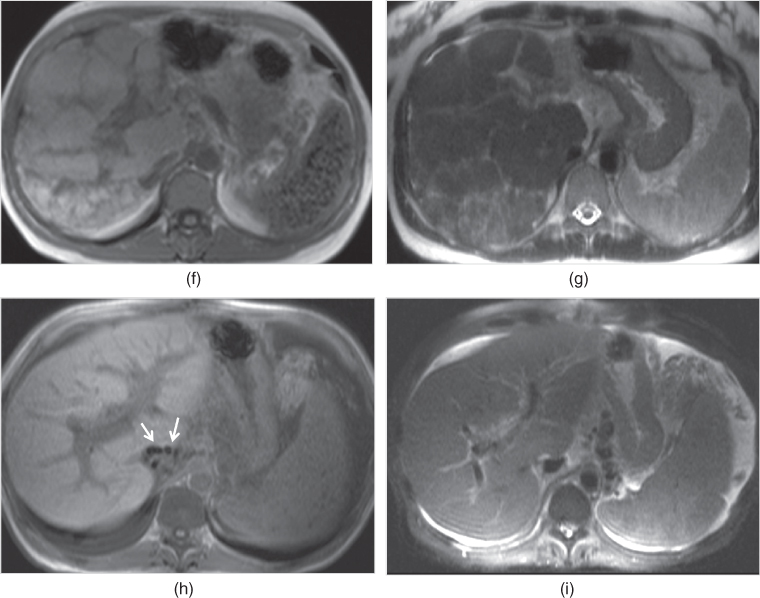
Figure 2.15 Susceptibility and iron effects on T2-weighted sequences. Coronal T2-weighted single shot echo train spin echo (a), coronal T1-weighted SGE (b) and transverse T2-weighted single shot echo train spin echo (c) images demonstrate duodenal diverticules (arrows; a–c) detected in two different patients. The liver, common bile duct, and small and large bowel wall and their lumens are visualized with very good image quality on T2-weighted images due to short acquisition time and decreased sensitivity to susceptibility artifacts. Note the smaller size of susceptibility artifact (arrow, a) detected in the diverticule (a) on T2-weighted image compared to the large size of susceptibility artifact (arrow, b) on T1-weighted image (b). Due to smaller sizes of susceptibility artifacts, the bowel wall and lumen can be visualized well on single shot echo train spin echo sequences. T2-weighted coronal non-fat-suppressed (d) and transverse fat-suppressed (e) single shot echo train spin echo sequences demonstrate low signal intensity of the liver and spleen due to iron deposition secondary to transfusional hemosiderosis. The lungs, stomach and large bowel are all well visualized on single shot echo train spin echo sequences due to decreased sensitivity to the susceptibility artifacts. Note the pleural effusion at the left side. T1-weighted in-phase SGE (f) and T2-weighted single shot echo train spin echo (g) images demonstrate a bizarre shaped liver with very irregular contours diagnosed as primary sclerosing cholangitis. Gamna-gandy bodies containing iron are present in the enlarged spleen. Gamna-gandy bodies are seen as hypointense nodules on SGE image due to its susceptibility artifact. However, these nodules are not appreciated on T2-weighted single shot echo train spin echo sequence due to its lesser sensitivity to susceptibility artifacts. T1-weighted in-phase SGE (h) image demonstrate surgical clips (arrows, h) adjacent to the IVC in a patient with liver transplantation with ischemic changes and findings of portal hypertension including enlarged spleen and ascites. However, surgical clips are not visualized on T2-weighted fat-suppressed single shot echo train spin echo due its lesser sensitivity to susceptibility artifacts.
However, one disadvantage of SS-ETSE sequences is that T2 differences between tissues are reduced in part due to averaging of T2 echoes, which has the greatest effect of diminishing contrast between background organs and focal lesions with minimal T2 differences. This generally is not problematic in the pelvis due to substantial differences in the T2 values between diseased and normal tissue. In the liver, however, the T2 difference between diseased (solid tissue) and background liver may be small and the T2-averaging effects of summated multiple echoes blur this T2 difference. These effects are most commonly observed with HCC. Fortunately, diseases with T2 values similar to those of the liver generally have longer T1 values than the liver, so the lesions poorly visualized on ETSE are generally apparent on precontrast GE as low signal lesions or on postgadolinium GE images as low or high signal lesions, depending on the enhancement features (7, 11).
Fat-suppressed (FS) echo-train spin-echo sequences
Fat suppression in spin echo sequences is useful for investigating focal liver disease to attenuate the high signal intensity of fatty infiltration, if present. Fatty liver is high in signal intensity on ETSE, in particular single shot versions, which lessens the conspicuity of high signal intensity liver lesions. Diminishing fat signal intensity with fat suppression accentuates the high signal intensity of focal liver lesions (Figure 2.16). FS SS-ETSE is also useful for evaluating the biliary tree. Fat suppression appears to diminish the image quality of the bowel due to susceptibility artifact from air–bowel wall interface and is not recommended for bowel studies, although bowel-related extraluminal disease (such as appendicial abscess) may be well shown with this technique.
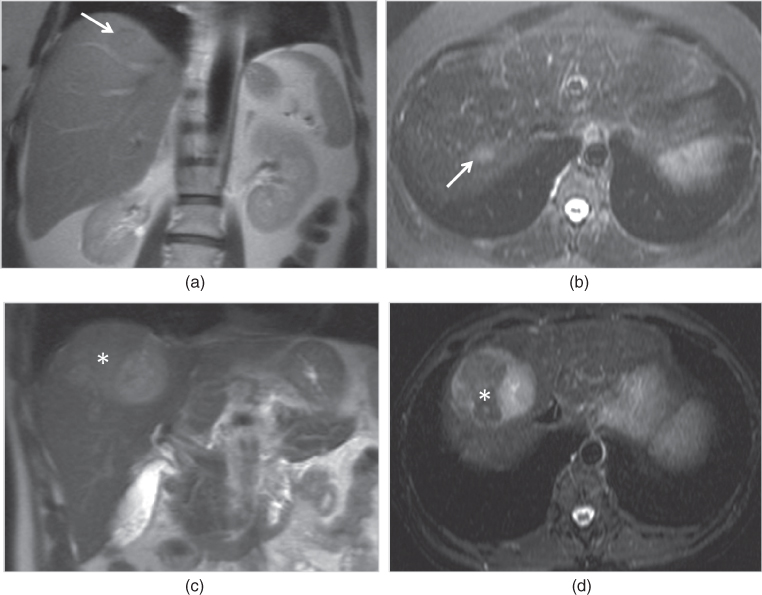
Figure 2.16 Fat-suppression effects on T2-weighted sequences. T2-weighted coronal single shot echo train spin echo image (a) demonstrate a subtle focal lesion (arrow, a) with hypointense signal located in the liver which has higher signal compared to psoas muscle due to its diffuse fatty infiltration. T2-weighted transverse echo train spin echo image (b) acquired with short tau inversion recovery technique (STIR) shows diffuse signal decrease in the liver due to fat suppression. Additionally, the focal lesion (arrow, b) shows mildly higher signal compared to the background fatty liver on fat-suppressed image (b). T2-weighted coronal single shot echo train spin echo image (c) demonstrate a large HCC with abundant fat (asteriks; c, d) which show hypointense signal on STIR image due to signal loss secondary to fat attenuation.
Fat suppression in ETSE sequences is achieved through either spectrally-selective or non-spectral selective preparation pulses. Non-spectral selective fat suppression, which is termed short tau inversion recovery (STIR), is performed with a slice-selective inversion pulse timed to suppress the T1 of fat (TI = 150 ms at 1.5 T) (Figure 2.16). As the pulse is broadband, both water and fat are magnetization-prepared, resulting in suppression of fat signal, alteration of contrast from water signal, and depression of water signal from equilibrium. While fat signal is uniformly suppressed, the remaining soft tissue (water signal) has lower signal as a direct consequence of the inversion pulse. As soft tissue in the abdomen has long T1 relative to fat, adequate SNR is still maintained. Although STIR is sensitive to non-uniform inversion (due to B1 field effects), the method is well-accepted as a robust technique for fat suppression in the abdomen, using spin echo-based sequences. As the sequence is fundamentally different from SS-ETSE, it may be useful to combine both short duration sequences for the liver in place of longer, breathing-averaged ETSE (7, 12).
An alternate method of fat suppression involves spectral selection of fat resonances exclusively. Preparation pulses (inversion or saturation) can be spectrally tuned to fat signal, while avoiding undue suppression or alteration of water signal, as seen with STIR techniques. Conceptually, the technique is similar to STIR, in which magnetization (in this case, only fat) is prepared with an inversion pulse timed to suppress fat. Ideally, other soft tissue will remain unaffected, preserving high contrast-to-noise ratio. Since spectral fat suppression is frequency-specific, it is sensitive to spatial susceptibility, which creates an inhomogeneous magnetic field (Figure 2.17). The water and fat resonances are not clearly delineated in this circumstance, causing fat–water frequency “overlap”, and potentially a significant number of fat spins to be unsuppressed. This effect is also prevalent at the edges of the FOV, or any regions away from the magnet isocenter (Figure 2.17) (7, 12).
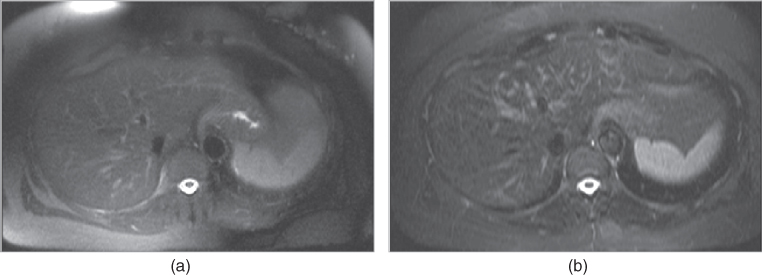
Figure 2.17 Fat-suppression techniques. T2-weighted transverse spectrally saturated fat-suppressed single shot echo train spin echo (a) demonstrate inhomogeneous fat-suppression, especially at the periphery, compared to STIR image (b).
Further improvement in uniform fat suppression can be achieved by incorporating adiabatic pulses, which are a specially designed class of RF pulses that provide B1 insensitive spin nutation. Recently, spectral (fat)-selective adiabatic inversion pulses, termed SPAIR, have been used in T2-weighted imaging of the abdomen (Figure 2.18). The uniformity of fat suppression is more robust than traditional spectral-selective techniques, making it the method of choice for liver and bowel imaging. Moreover, its inherent high CNR provides important diagnostic advantages over STIR, since soft tissue signal is preserved. The effects of inhomogeneous main magnetic field still pose challenges to SPAIR, due to spectral overlap. But the improved inversion profile and frequency cutoff of SPAIR alleviates the degree of poor fat suppression. Implementation of SPAIR fat suppression takes longer than its other counterparts, due to the longer pulse length required for the adiabatic condition. This may increase scan times for segmented T2 and T1 acquisitions (7, 12).
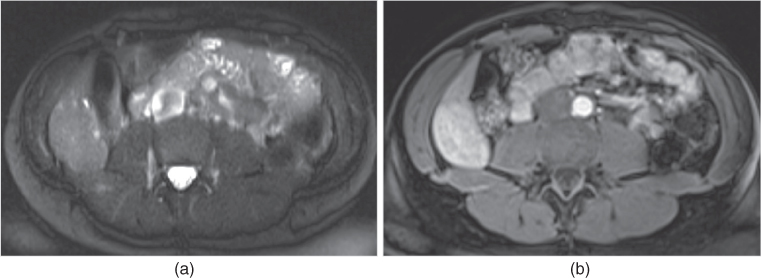
Figure 2.18 Fat-suppression techniques. T2-weighted transverse single shot echo train spin echo (a) and T1-weighted 3D-GE post-gadolinium interstitial phase (b) images at 3.0 T acquired with SPAIR technique demonstrate prominent fat-suppression although fat-suppression is inhomogeneous at the periphery of the images due to magnetic field inhomogeneity. Note the adenoma located in the right lobe of the liver.
Alternative fat-suppressed T2-weighted sequences for the liver, such as echo-planar imaging, have also been employed at some centers.
Focal or diffuse lesions may show mild, moderate, or markedly high signal, depending on fluid content on non-fat-suppressed and fat-suppressed images; high or low signal, depending on fat content on non-fat-suppressed images or fat-suppressed images, respectively; and low signal, depending on iron, fibrosis, or protein content on non-fat-suppressed and fat-suppressed images (Figures 2.15, 2.16, and 2.19).
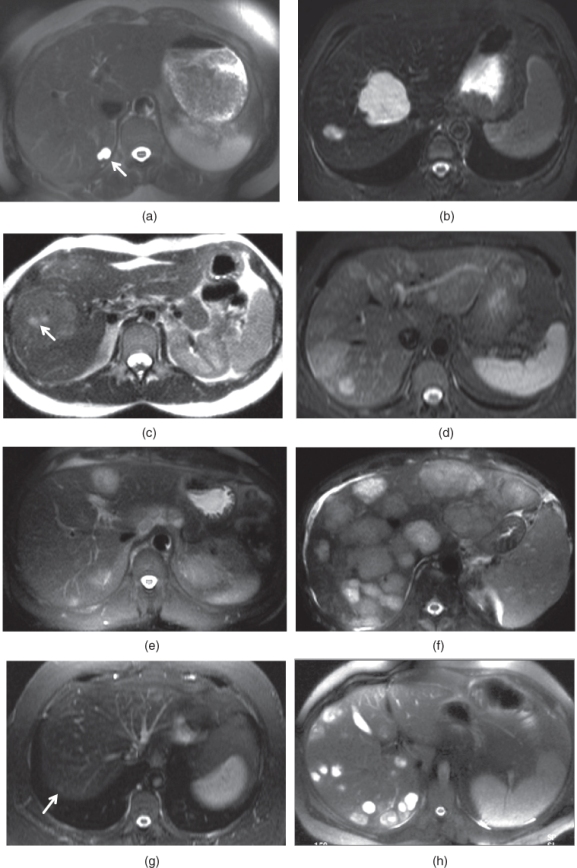
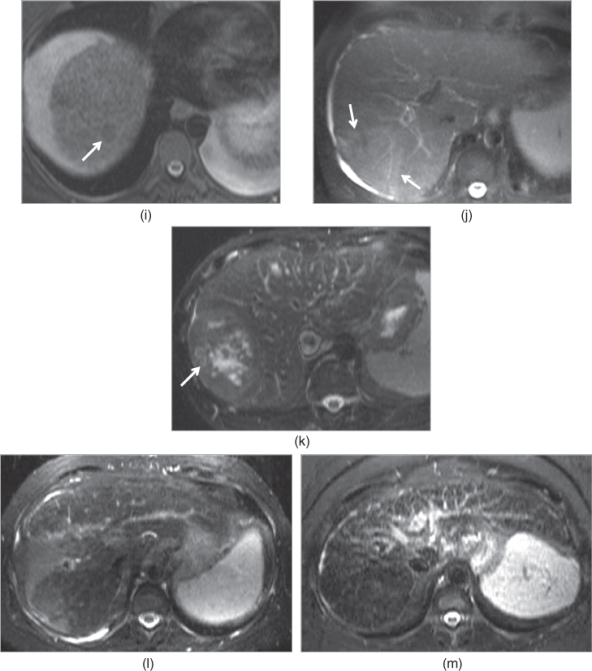
Figure 2.19 Appearances of common lesions and their signal intensities on T2-weighted echo trains spin echo (ETSE) sequences. Simple cysts, which are the most common benign lesion seen in the liver, are seen as markedly hyperintense lesions (arrow, a). Hemangiomas, which are the most common benign neoplasm of the liver, are seen as markedly hyperintense lesions (b). Focal nodular hyperplasias (FNHs), which are the second common benign neoplasm of the liver, are seen as mildly hyperintense or isointense lesions (c). The central scar (arrow, c) may exist in FNHs and demonstrate mild to moderate high signal. Hepatocellular adenomas, which are the third common neoplasm of the liver, are seen as mildly hyperintense or isointense lesions (d). Hypovascular liver metastases usually demonstrate mild to moderate high signal as in seen in a patient with colon cancer metastases (e). Hypervascular metastases demonstrate variable high signal intensity although moderate to markedly high signal are seen frequently as seen in a patient with carcinoid metastases (f). Chemotherapy treated liver metastases (arrow, g) usually show low signal intensity or mildly high signal intensity due to its lesser fluid and higher fibrotic content. Abscesses (h) usually demonstrate moderate to markedly high signal intensity. Hepatocellular carcinomas may show low signal intensity (arrow, i) due to its protein or hemorrhagic content, mild to moderate homogeneous high signal intensity (arrows, j) due to its fluid content and heterogeneous signal intensity (arrow, k) due to its necrotic component. Confluent fibrosis at segment 8 (l) and diffuse reticular fibrotic network (m) show mildly high signal.
Postgadolinium sequences
Gadolinium-containing contrast agents are the most useful and most commonly used MR contrast agents. They are most effective when administered as a rapid bolus, with imaging performed using T1-weighted SGE or 3D-GE sequences obtained in a dynamic serial fashion. Dynamic MR imaging is performed on at least three phases consecutively, including (i) hepatic arterial dominant phase, (ii) early hepatic venous phase, and (iii) interstitial phase. An additional hepatocyte-specific phase may be obtained as a fourth delayed phase if hepatocyte-specific gadolinium-containing agents are employed (7).
Stay updated, free articles. Join our Telegram channel

Full access? Get Clinical Tree


