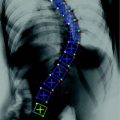
Fig. 1
On the left and middle panels, bi-planar radiographs are shown. Radiographs are sometimes used in planning spine surgeries with complex patient morphology. On the right, an axial image from a CT scan is shown with distance and angle measurement lines superimposed
3.2 Templating-Based Procedure Planning
3.2.1 Pre-operative Imaging
The SSP application runs on a standard desktop computer. The software can import data either directly from the file system or through an institutional PACS in the form of a high resolution CT scan acquired with standard imaging protocols. Typical datasets consist of isotropic images with a 0.75 × 0.75 mm in-plane resolution and a 0.75 mm slice thickness. The pre-operative scan is imported into the SSP software [14], within which the surgeon “virtually” places the pedicle screws into the 3D image data, generating a virtual surgical plan which can be loaded up for visualization during the intervention. Moreover, the resulting surgical plan and image dataset can be further used to generate an appropriate anatomical model for 3D printing, resulting in a physical, 3D patient-specific model of the spine that can be used as a visual aid before and during the procedure.
3.2.2 Patient-Specific Virtual Templating
The 3D templating process is the repeated application of two steps for each vertebra of interest. First, to effectively plan spine surgery using 3D templating tools, it is necessary to reorient each vertebral body so the axial image plane runs perpendicular to its central axis. To accomplish this task, the user simply identifies a bounding box for each vertebra, using the sagittal and coronal views. The top and bottom sides of the bounding box are aligned with the vertebral endplates, making sure they extend far enough to include the entire vertebral body and any part of the implants that will extend outside the vertebra (e.g., the screw heads). This can quickly be carried out with placement and manipulation of a simple GUI tool with 2–3 mouse clicks in each of the two views, as illustrated in Fig. 2. The pedicle lengths and angles are determined in the local vertebral space to ensure that the measurements correctly represent the anatomy. Also during the vertebral identification process, it may be necessary to reorient each vertebral sub-volume into a consistent frame of references. Specifically, a rotation of the axial image may be required if the spinous process does not line up parallel to the y-axis in that view. The realignment is also shown in Fig. 2.
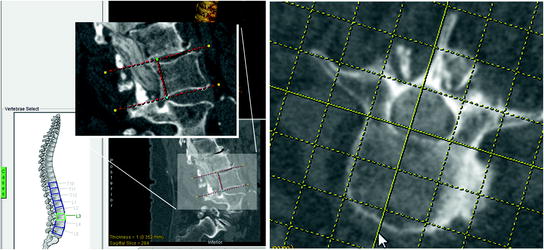
Fig. 2
Vertebral body extraction and alignment. During the process of vertebral body extraction, a user manually places I-beams around the vertebra of interest (left). After the vertebra has been extracted, it can be reoriented along the spinous process using an interactive grid (right)
In the second step, digital templates of screws are selected and inserted into the 3D data. During the selection step, the appropriate type of pedicle screw is chosen and a size is selected. The template is then placed into the axial image that includes the widest portion of the pedicle. The virtual pedicle screw can now be translated or rotated interactively in any of the three orthogonal views to achieve optimal placement within the vertebra, as shown in Fig. 3. Exact dimensions and angle placement for each screw placed is automatically recorded for use in the final report, which is the last step in the 3D spine surgery planning process. The report provides a list of each screw templated, including the vertebra in which they are placed, the manufacturer of the screw, the dimensions of the implant, and the precise location within the vertebral body based on the axial and sagittal angles. In addition to the implant list, a number of images are automatically generated and added to the report for visual verification.
Fig. 3
Pedicle screw template placement. Screw templates are placed interactively into the image data with the mouse. Each template corresponds to a particular prosthetic implant manufacturer. The screws are evaluated in the orthogonal images and rendering to ensure that the screws are of the appropriate length and thickness
3.2.3 Fastening Strength Formulation
According to strength of materials principles and theories of failure, each screw withstands a maximum force before it can be torn away from the material after its insertion. The holding power of a typical screw depends on the dimensions of the screw, the threaded insertion depth, and the properties (typically characterized by specific gravity) of the material in which the screw is inserted. By transposing this theory to the pedicle screw implantation procedure, the holding power (i.e., fastening strength) of a pedicle screw is directly proportional to the screw diameter, the length of the threaded portion of the screw inserted within the bone, and the specific gravity of the pedicle body, typically characterized by its bone mineral density (BMD). Based on this relationship, we define Fastening Strength as a surrogate measure for the screw holding power that combines both implant dimension and trajectory estimated based on the virtually-templated images using the relationship below:
 where L is the length of the in-bone threaded portion of the screw, D is the screw diameter, and I(r; θ; z) is the image intensity at each voxel within bone volume displaced by the virtual screw. The above relationship represents the intensity—area product evaluated in transverse slices (defined by the in-plane cylindrical coordinates—radial distance r and angular increment dθ) throughout the extent of the insertion depth.
Studies [15] have revealed a linear correlation between the image intensity and BMD measurements, based on calibrations of known BMD CaHA (calcium hydroxyapatite) phantoms against the dynamic intensity range: BMD = α · Intensity, where α = 0.8 ± 0.03. Moreover, the typical BMD of spinal cortical bone (hard shell coating the pedicle surface) was reported as 192 ± 10 mg/cm3 [16], and the BMD of the cancellous bone (spongy bone near the pedicle core) was reported as ~140 mg/cm3.
We refer to the Fastening Strength as a surrogate measure for the screw holding power primarily because the voxel intensity is used to characterize the bone mineral density (BMD) of the pedicle body segment displaced by the screw. Moreover, the Fastening Strength is not intended to be interpreted or employed as an absolute metric, but rather a relative measure to compare the expected holding power provided by implants of different dimensions and inserted along different trajectories within the bone.
3.2.4 Physical 3D Model Generation
After the pre-surgical plan is completed, the original CT data and the SSP results are imported into Analyze [17–20] for additional processing prior to 3D model printing. The spine is segmented in the CT images using basic thresholding. If the quality of the scans is low, additional manual techniques are required to correctly delineate the spine. Following the detailed spine segmentation step, the pedicle screw placement data generated by the SSP are incorporated by inserting representative voids in the segmentation which correspond to the precise screw locations. The virtual spine model with the templated screw holes in place is tiled into a surface using an adaptive deformation algorithm [21–23] and exported as a stereo-lithography (STL) file. To improve the stability of the delicate spinal structure, a narrow ribbon is added to the anterior spine model before printing. The resultant STL file is printed using a ZCorp Spectrum Z510 printer. This printer can generate large-volume, full color models.
The pre-surgical plan report is used in advance to prepare the instrumentation inventory for the operation. The 3D patient-specific model, along with the report, is used in the procedure room to provide real-time visualization and guidance for accurate pedicle screw placement.
3.2.5 Proposed Surgical Planning Workflow
To better illustrate the functionality and capabilities of the spine surgery planning platform, we follow a hypothetical patient through the workflow associated with the proposed interventional planning protocol. Following diagnosis based on a routine CT scan, the patient is typically recommended for surgery, in which case additional imaging exams may be ordered, to better examine a specific region of interest in the spine anatomy. Based on the pre-operative spine image dataset, the surgeon or physician assistant will conduct the surgical plan using the proposed virtual platform. Each vertebral segment that needs to be instrumented will be realigned according to the true vertebral axis in order to enable true size measurements of the pedicles and vertebral body. These preliminary measurements of the pedicle width and length will serve as initial estimated of the virtual pedicle screws that are to be selected from the available database that compiles a wide variety of screws according to the specifications of several different manufacturers, so they closely match the vertebral anatomy. Each vertebral segment is then instrumented by “inserting” the selected virtual screw (in the form of an object map—a virtual representation of the physical screw) in the image dataset through the pedicle body mimicking the actual intra-operative implantation procedure. The position and orientation of each screw is then evaluated by panning through the image data containing the virtual pedicle screw to ensure the screw is fully contained within the pedicle (i.e., ne pedicle rupture) and does not interfere with the surrounding anatomy. In the event that more than one screw type (i.e., of close diameter and length) or several trajectories are permissible, the Fastening Strength is evaluated for each screw and each trajectory and based on the results, the screw and trajectory yielding the largest Fastening Strength will be selected, again, under the constraints that no interference exists between the screw and surrounding anatomy.
These steps are repeated for each vertebral segment that needs to be instrumented. Following completion of the plan, the platform provides a report that lists each instrumented vertebral segment specifying the implant gauge (i.e., screw diameter and length), implant trajectory (measured with respect to the axial and sagittal angles), and, if needed, the Fastening Strength computed for each implant. Note that once a decision is made with respect to the size and trajectory of a specific implant, the Fastening Strength provides minimal information, as it is a relative measure based on which the implant trajectory and size is optimized and its absolute magnitude is meaningless unless compared against other values computed for the same implant.
Based on the output report, the instrumentation inventory is prepared for the upcoming procedure. Also, the virtual plan can be saved as either a surface or volume rendered model either including or excluding the virtual screws that can be displayed in the procedure room for analysis and review during the intervention. If a life-size model of the instrumented spine is required by the surgeon prior to the procedure, the virtual plan is saved as a stereo-lithography (STL) file and a physical model can be generated using a 3D printer or a rapid prototyping device.
In the event that a surgical navigation platform is employed to guide the intervention, the virtual plan can be registered to the patient’s anatomy in the OR by using a variety of registration techniques—the most suitable and straight-forward being a landmark-based rigid body registration for each individual vertebral segment. This approach will minimize any uncertainties introduced by registering an entire region of the spine to the patient, provided a slightly different position or orientation of the patient between the pre-operative scan and intra-operative procedure. After registration, the drilling tool and pedicle implant can be guided and inserted according to the prescribed pre-operative plan.
4 Platform Evaluation and Validation
4.1 Assessment of 3D Templating Tool
A small retrospective pilot study was conducted to compare the traditional 2D method of spine surgery planning and the 3D templating method for pedicle screw placement. A cohort of 10 subjects was identified for the study, each having had a previous spinal procedure that included the implantation of pedicle screws in two or more vertebrae. Original preoperative plans were not available so two new plans were created for each subject based on the CT exams taken prior to the surgery. One was a plan based on the same type of 2D method used to carry out the original procedure. A second plan was created using the new 3D templating tools. Each of two participating surgeons generated separate plans for 5 of the 10 subjects. One participant was a skilled staff surgeon with 14 years of experience and the other was a fifth year resident. Post-surgical CT exams were also extracted from the patient record to compare both methods of planning with the post-surgical results. Metrics used in the evaluation included pedicle screw lengths, widths and angles. The pre-operative 2D planning data, pre-operative 3D planning, and post-operative images were analyzed by looking at:
(a)
Differences between pre-operative 2D and pre-operative 3D
(b)
Differences between pre-operative 2D and post-operative
(c)
Differences between pre-operative 3D and post-operative
(d)
Greater deviation between the two pre-operative to post-operative differences—from (b) and (c)
(e)
Greatest deviations from (d) between resident and experienced staff surgeon
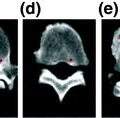
Several differences were observed in the 2D planning workflow and the 3D planning workflow. First, while best attempts were made to accurately extract the dimensions of vertebrae with the 2D approach, deformation of the spinal column and normal spine curvature contributed to significant errors in the initial estimate with the 2D method. Figure 4 shows these differences in one of the 10 cases. Because the axial slices do not necessary cut across the long axis of each vertebra, a simple measurement in one slice is inadequate for accurate assessment. In Fig. 4, the width of the vertebra appears to be 53.364 mm in the axial view (a) of this CT image, but the same linear segment in the sagittal view (b) clearly shows the misleading nature of the measurement, due to the oblique orientation of the vertebral body with respect to the entire patient. Figure 4 also shows the depth of a vertebra along the pedicle to be 66.4 mm in the axial view (c) of this CT image. The coronal view (d) of the same segment, however, shows a measurement that actually represents a corner to corner distance, which likely may not be the measurement intended. Both of these illustrations show the potential problems if screw length decisions are based solely on standard 2D axial, sagittal or coronal views. The potential for implant size and/or angulation error is increased further by the manual nature of current 2D spine surgery planning methods.
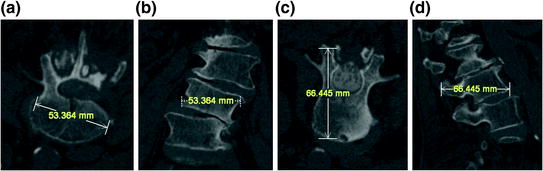
Fig. 4
The corresponding width and depth segments shown from different orientations illustrate the potential for misleading measurements when basing them on single 2D views
Another difference is the consistency of the planning report. Although there is a pre-defined manual entry form which is used routinely for spine planning, the use of this form is inconsistent from case to case. Figure 5 shows the plan from one of the cases. Because the process is manual, there are blank columns on the left and the scratched out numbers at the bottom. It is unclear if the surgeon neglected to fill in those angles or if the angles were 0° and therefore not entered. The values that were scratched out may possibly lead to transcription errors. In contrast, the automatically generated report from the 3D planning process shown in Fig. 5 requires no manual intervention.
Fig. 5
The handwritten instrumentation report on the left illustrates the high potential for error when compared to the automatically generated report coming from the 3D templating tool
Each vertebral level includes an axial view with screw placement angles included and a top view 3D rendering, as well as two full spine renderings, illustrated in Fig. 6, with all screws displayed. The report can then be printed, saved, or added to the patient record as a DICOM object.
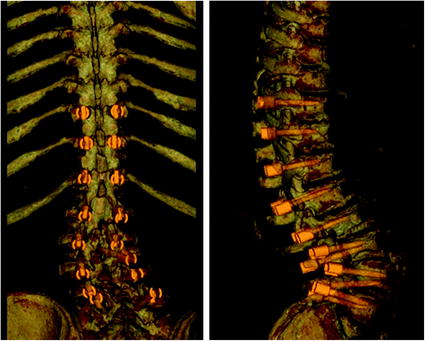
Fig. 6
The two renderings show the complete plan after all the individual vertebrae have been templated
While some differences were identified in several comparisons, no strong trends were found in the pre-operative comparisons or the two pre-operative to post-operative comparisons. Given the small sample, this is not surprising. However, the different measurements generated, coupled with the participating surgeon’s prevailing intuition that the 3D planning method was producing more consistent and more precise measurements, provides impetus for further study. It must also be recognized that comparison of pre-operative plans to post-operative results that were originally planned using 2D methods is not going to produce results that indicate one is “better” than the other. In fact, it could be expected that differences between 2D pre-operative planning and post-operative results should be small in these cases, since both were planned using the same method. It turns out that is exactly what occurred in the case of the experienced surgeon. The chart in Fig. 7 shows his 2D plans deviated less from the post-operative results than his 3D plans did. Interestingly, the less experienced resident’s results were the opposite, as indicated by the same chart, which might indicate that 3D planning helps him plan cases that more resemble the expert. The chart in Fig. 7 also suggests that the resident’s templates in the 2D plans tended to be shorter and narrower than those from the 3D plans. A plausible explanation for this is that residents tend to round down when using 2D methods since it is recognized as more of an estimate (due to oblique orientation of vertebra) and wanted to err on the side of safety. 3D planning gave a better view and provided more confidence in the template choice, thus accounting for larger template sizes. The expert’s templates were just the opposite, illustrated by the same chart. He tended to choose shorter narrower screws in the 3D plan compared to the same subjects in the 2D plan. Based on better views from the 3D plan, he may recognize preferred locations for the templates that would provide adequate holding strength while maximizing safety and avoiding problem areas not observed using 2D planning methods.
 Assistance and Intervention in Spine Surgery
 Column Localization, Labeling, and Segmentation
 Aided Detection of Bone Metastases in the Thoracolumbar Spine
 Model-Based Vertebra Identification from X-Ray Image(s)
 Spine Reconstruction from Radiographs
 Segmentation, Reconstruction and Analysis of the Vertebral Body from Spinal CT


Related posts:
Assistance and Intervention in Spine Surgery
Aided Detection of Bone Metastases in the Thoracolumbar Spine
Model-Based Vertebra Identification from X-Ray Image(s)
Spine Reconstruction from Radiographs
Segmentation, Reconstruction and Analysis of the Vertebral Body from Spinal CT
Stay updated, free articles. Join our Telegram channel
Full access? Get Clinical Tree
