1 Technologic Innovations in MR and CT
Introduction
Both CT and MR have made tremendous technologic advances since their clinical introduction, regarding not only sensitivity and spatial resolution, but also in terms of the speed of image acquisition. Advances in CT in recent years have focused in part on reduced radiation dose, an important topic for the years to come. MR has seen the development of a plethora of scan techniques, with marked superiority to CT in terms of tissue contrast due to the many parameters that can be assessed and their intrinsic sensitivity. Future advances in MR for clinical practice will likely focus both on new acquisition techniques that offer advances in speed and resolution, such as simultaneous multislice imaging and data sparsity, and on standardization and further automation of image acquisition and analysis. Functional imaging techniques including specifically perfusion will be further integrated into the workflow to provide pathophysiologic information that influences differential diagnosis, to assist treatment decision and planning, and to identify and follow treatment-related changes.
Magnetic Resonance (MR)
Three-tesla MR imaging represents one of the major forefronts of diagnostic neuroradiology today, with 3 T currently considered the field strength of choice for brain imaging. Little more than a decade ago, information regarding routine clinical application was generally lacking due to rapid changes in instrumentation and the relatively small installed base; however, today 3 T is mature as a modality for clinical evaluation of the brain. Despite this statement, further substantial progress in terms of refining and improving technique is anticipated in the years to come. Particularly because of research in the field of data sparsity, scan times for many applications are anticipated to decrease further in the future, in many instances substantially. 3 T offers higher signal-tonoise ratio (SNR) when compared to lower field strengths, an advantage that can be employed either for improved spatial resolution or to scan faster, the latter being important for in-patient imaging. This has led to a divergence of protocols, with longer high-resolution scans on one end and faster lower resolution scans on the other. A reduction in slice thickness for routine brain imaging is also an option with 3 T (both with 2D multislice imaging and 3D imaging). Today, 2D multislice scans of the brain are routinely acquired with a 4-mm slice thickness at 3 T, compared to 5 mm at 1.5 T. With 3D techniques, at 3 T, 1-mm sections are routinely acquired. It is quite likely that slice thickness for routine screening 2D brain exams will be further reduced in the future (for example, to 2 mm), with implementation of simultaneous multislice (slice accelerated) and/or data sparsity techniques—two active areas of research.
Brain imaging at 3 T, from a theoretical point of view, offers the potential for up to a factor of two increase in SNR when compared to 1.5 T, which would translate to a four-fold decrease in scan time if all other factors were held constant. However, since its clinical introduction, it has been clear that much of the increase in SNR would be used for improved spatial resolution. For neuroradiologists who have read large numbers of 1.5- and 3-T exams, it is readily evident that the higher quality of 3-T brain exams, due to higher spatial resolution and a mild decrease in scan time, equates to both markedly improved diagnostic quality and a scan that is easier and requires less time to interpret. In the meantime, since its clinical introduction, a range of technical problems at 3 T have had to be overcome. These included accentuated motion artifacts (depending on imaging technique), heat deposition/specific absorption ratio (SAR) limits, and the prolongation of T1 with field strength.
Spatial Resolution
The improved SNR at 3 T leaves the neuroradiologist with a difficult decision, as illustrated in Fig. 1.1 . High-resolution scans can be acquired with exquisite detail, or depending on the need and ability of the patient to cooperate, very rapid scan sequences can be acquired. The current screening brain exam at 3 T, if performed with 2D technique, includes a 4-mm sagittal T1weighted short TE gradient echo scan together with 4-mm axial fast spin echo (FSE) FLAIR and T2weighted scans, and a 4-mm readoutsegmented, multishot, axial diffusion-weighted scan, requiring a total scan time between 5 and 10 minutes. Sacrificing spatial resolution, such as imaging with 5-mm slices and/or using a lower inplane resolution, scan times can be further reduced. Overall, the improved SNR at 3 T permits thinner sections to be acquired on a routine basis, combined with a modest reduction in scan time as compared with imaging at 1.5 T, decreasing motion artifacts as well as allowing improved imaging of uncooperative patients. This approach also allows rapid imaging when time is critical, such as in the diagnosis and management of acute stroke patients.

One caveat is important to mention in regard to inplane spatial resolution. Although 3 T offers the ability to acquire an inplane resolution in the brain well less than 0.5 × 0.5 mm2, the consequences of this must be judged. Consider the use of T2weighted FSE technique. Protocoling scans with variable inplane (and through-plane) resolution, all with reasonable SNR, three possible options for example would be scans with voxel dimensions of 0.7 × 0.7 × 4, 0.4 × 0.4 × 4, and 0.4 × 0.4 × 2.5 mm3, with respective scan times of 30 sec, 1:30 min:sec, and 3:00 min:sec. However, stroke patients represent a subpopulation in which inadvertent motion is often a problem in regard to scan quality. To ask such a patient to hold still—meaning moving well less than one half of a millimeter—for a 3-minute scan with an inplane resolution of < 0.5 × 0.5 mm2 and a slice thickness < 3 mm is simply not practical.
Slice Thickness
In this and subsequent sections, results at 1.5 and 3 T in the same patient will often be directly compared, acquired as part of an Institutional Review Board–approved study. The two MR units used in this comparison were located in adjacent clinical bays, allowing patients 1 Technologic Innovations in MR and CT to be scanned easily at both field strengths in a single time slot. The MR systems (from Siemens Medical Solutions) were as closely matched as possible, with identical gradient coils and comparable head coils (identical geometry, design, and number of coils).
Slice thickness in MR has decreased steadily since its clinical introduction. In the early 1980s, 10 mm was the standard slice thickness for brain imaging. With time, as magnets were introduced using higher field strengths, slice thickness decreased to 7 mm (at 1.0 T) and then eventually to 5 mm. The latter represents the current standard for brain imaging at 1.5 T. With the improved SNR at 3 T, it is possible to further reduce the routine slice thickness used for brain imaging with preservation of image quality.
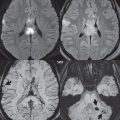
The SNRs for the four scans in Fig. 1.2 , from region of interest measurements in white matter, were (1.5 T) 21 and (3 T) 63, 29, and 15 (only the upper left hand image was acquired at 1.5 T). As expected, there is a substantial improvement in SNR at 3 T, when slice thickness is held constant, with the 5 mm section at 1.5 T having an SNR of 21 and that at 3 T an SNR of 63. Theoretically, if all factors were held exactly constant, there should not be more than a two-fold improvement in SNR at 3 T. In the images shown, the SNR at 3 T is similar to that at 1.5 when using half the slice thickness (lower vs upper image, left side). However, as one can see in this case, the SNR of the 5-mm 1.5-T image actually falls in between that of the 2.5-mm and 1-mm images at 3 T. Looking at this from a strict visual perspective, the “graininess” of the 5-mm 1.5-T image is between that of the 2.5-mm and 1-mm sections at 3 T. The improvement beyond what is expected (a factor of 2 in SNR at 3 T) likely represented further hardware/software optimization on the 3-T system. In a real-world setting, the bandwidth of the 1.5-T acquisition would also have been increased (with matched pixel shift for the two field strengths), decreasing slightly the advantage of 3 T in terms of SNR.

As a further comment, imaging with thinner slices would not have been feasible without the advent of PACS and the filmless radiology department. The thinner slice thickness, which is very manageable in terms of clinical interpretation in the PACs environment, gives the reader a combination of improved image quality (less partial volume imaging), increased structural detail, and improved lesion detectability (for very small lesions).
It should be kept in mind when moving to thinner sections at 3 T that visualization of small punctate lesions will typically be improved. This is due to less partial volume imaging, with implications for scan interpretation when comparing exams from different field strengths. For example, with chronic small-vessel white ischemic disease, thinner sections can make the degree of involvement appear more prominent (with improved visualization of the areas of gliosis and with disease seen on more images due to the thinner sections).
Brain Screening
3 T offers unparalleled image quality for routine clinical brain MR, and specifically for brain ischemia. What follows is simply one possible protocol for brain screening at 3 T, implemented considering the trade-offs of scan time and image quality. Due to the large number of inpatients in our facility, the decision was made to keep scan times below 2 minutes for each scan sequence using 2D imaging with an inplane resolution similar to that used at 1. 5 T, but with a 3-mm slice thickness as opposed to 5 mm at the lower field strength.
A 3-mm 2D short TE (2.4 msec) spoiled gradient echo sagittal T1weighted scan is first acquired, with an acquisition time of 1:16 min:sec. This has excellent gray-white matter differentiation and thus also excellent visualization of vasogenic edema. Axial scans are subsequently acquired, all also with a 3-mm slice thickness, employing FSE T2weighted and FLAIR scans, and diffusion weighted scans, with acquisition times of 1:32, 2:08, and 1:23 min:sec, respectively. The diffusion weighted scan in this approach is, however, a single shot technique, which has disadvantages in terms of bulk susceptibility artifacts, geometric distortion, and image blur (this topic is discussed in greater detail later on, and for a more in-depth consideration of MR physics, the reader is referred to The Physics of Clinical MR Taught Through Images, 3rd Edition [Thieme 2014]). Including the localizer, the entire acquisition time for this screening exam is 6:42 min:sec. This represents a reduction in scan time of 40% as compared to our routine exam at that time at 1.5 T, despite the reduction in slice thickness from 5 mm to 3 mm.
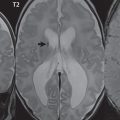
In regard to T1weighted imaging of the brain, the use of a short in-phase TE (2.4 msec) 2D spoiled gradient echo (GRE) sequence is advocated. The short TE limits flow-related and susceptibility artifacts. This sequence is robust and does not experience significant specific absorption ratio limitations, poor tissue contrast, or accentuated motion artifacts as can be encountered with FSE or FLAIR T1weighted imaging at 3 T. Comparing directly T1weighted spin echo imaging at 1.5 T and the short TE GRE scan at 3 T ( Fig. 1.3 ), the latter 1 Technologic Innovations in MR and CT offers superior SNR and contrast-tonoise ratio (CNR) with reduced motion artifacts and scan time. Use of this scan postcontrast is also critical to minimize pulsation artifacts from vascular structures. Thus, despite statements in the early literature to the contrary, excellent T1weighted images of the brain can easily be acquired at 3 T by use of a short TE 2D GRE scan, a critical point for imaging of brain ischemia and the detection of methemoglobin (which is seen as high signal intensity on T1weighted scans).

One important caveat to note, however, is that the appearance of arteries (and to a lesser extent veins) on both pre- and postcontrast scans is different with the short TE 2D GRE sequence at 3 T in comparison with the conventional T1weighted FSE sequence typically employed at 1.5 T. On the GRE T1weighted scan, precontrast, many of the larger proximal arteries are high signal intensity (as opposed to a flow void, seen with FSE technique), including specifically portions of the anterior (MCA) and posterior (basilar artery, PCA) circulations. Postcontrast on the GRE T1weighted scan, there is relatively uniform enhancement of both intracranial arteries and veins, whereas with FSE technique, these are generally low signal intensity (a “flow void”).
3 T also makes possible acquisition of diffusion weighted scans with substantially improved inplane resolution, to be discussed in depth subsequently. An important further consideration, in terms of diffusion weighted imaging (DWI), is the implementation of a readoutsegmented, multishot acquisition, also discussed subsequently, which markedly improves the bulk susceptibility artifacts otherwise seen at 3 T. A negative for this approach is that scan time is prolonged, in comparison to a single-shot echo planar DWI scan. However, an additional positive outcome is that image blur is markedly reduced.
Contrast Media
Contrast enhancement of brain lesions using the gadolinium chelates at 3 T is substantially improved when compared to 1.5 T ( Fig. 1.4 ). Although the lower T1 relaxivity at higher field strength for the gadolinium chelates (the intravenous agents used) would lead, in the absence of other factors, to lower enhancement, this is outweighed by the longer T1s that are intrinsic to 3 T in comparison to 1.5 T. The 2D short TE GRE T1weighted scan is an excellent scan technique for postcontrast images and can be rapidly acquired in all three orthogonal planes (in 2 minutes or less for each scan). It is often implemented today with a slice thickness of 4 mm and a relatively high inplane spatial resolution.

3D T1weighted scans can also be used for postcontrast imaging, with two important caveats. If the same scan technique is not employed pre- and postcontrast, then it is possible to mistake a slightly hyperintense lesion (which appears that way due to the difference in scan technique) as one that enhances. Furthermore, MP-RAGE (also known by the terms 3D FGRE and 3D TFE) is commonly used at 3 T for postcontrast imaging, due to its appealing high gray-white matter contrast. However, as implemented, it is not that sensitive a technique for contrast enhancement. Other less commonly employed T1weighted scans, such as 3D SPACE (also known by the terms CUBE and VISTA), are well known for their improved detectability of contrast enhancement, which translates into improved detection of small or poorly enhancing lesions. This difference in sensitivity of the technique has been well shown for intracranial metastatic disease, with SPACE greatly outperforming MP-RAGE in published studies in which both scans were acquired, in random temporal sequence, holding scan time and voxel dimensions constant.
3D Time of Flight MRA
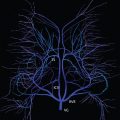
3 T represents a major step forward in image quality for time of flight (TOF) MR angiography (MRA). This is nowhere more evident than in 3D TOF MRA of the circle of Willis. The lengthening of T1 at 3 T is in part responsible for this marked improvement. TOF contrast is based on the visualization of fresh unsaturated blood, which has not yet reached steady state, flowing into the excitation volume. The rate at which the flow of blood approaches steady state is based on TR and flip angle, from a pulse sequence perspective, and T1 and flow characteristics from a physiological perspective. At 3 T, T1 prolongation (due to field strength) results in the steady state signal level for stationary tissue being reduced, providing greater vessel contrast. This lessens the need for the use of magnetization transfer, permitting the use of shorter TRs and lower flip angles to increase depth penetration.
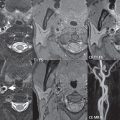
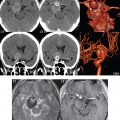
The net result is improved visualization at 3 T of both large and small arteries, on the basis of higher acquired spatial resolution and sufficient SNR to permit this. Aneurysm depiction is markedly improved ( Fig. 1.5 ). However, like at 1.5 T, when there is slow flow, such as the delayed filling seen in very large aneurysms, the entire patent portion of the abnormality may not be visualized on the TOF study. Vessel occlusions and stenoses, together with reduced vessel caliber and slower flow, are also well visualized at 3 T, with the improved spatial resolution and overall image quality making such findings often much more evident ( Fig. 1.6 , Parts 1 and 2). The excellent visualization of both small arteries and distal branching vessels intracranially, illustrated in figures throughout this text, is a consistent result with 3D TOF MRA at 3 T.


Related posts:
Stay updated, free articles. Join our Telegram channel

Full access? Get Clinical Tree


