14 Metabolic Disorders
14.1 Introduction
Metabolic disorders are relatively rare conditions, but collectively and in most large pediatric centers are fairly frequent considerations in differential diagnosis. Findings on clinical examination and imaging are characteristic for some of these disorders, but are more nonspecific for most others. Familiarity with the key clinical and imaging features of different metabolic disorders, and with various imaging techniques, can aid in narrowing the differential diagnoses for these conditions (s. Tab.). Because many of the conditions have a genetic basis, there may be regional predominances of otherwise rare metabolic disorders of which one should be aware in a given practice environment. Certain metabolic disorders with characteristic features are included in many multiple-choice examinations, even if the disorders themselves are rare. Ultimately, although this chapter provides appropriate familiarity with the basic aspects of metabolic disorders from the viewpoint of the role of imaging techniques and findings in their diagnosis and treatment, a more exhaustive reference source may be warranted when encountering cases of metabolic disorders on a clinical basis.
Disease | Major imaging features | Important points |
Maple syrup urine disease | Myelinic edema in myelinated white matter. Especially around the PLIC and extending into the brainstem in newborns, more extensive distribution later in life. Magnetic resonance spectroscopy shows a peak at 1.9 ppm for the BCAAs (as well as lactate at 1.3 ppm) | Impaired metabolism of (BCAAs). Toxic metabolites injure myelin. Brain changes may resolve with dietary restriction of BCAAs, acute episodes of neurologic dysfunction occur if diet not followed. |
Canavan disease | Macrocephalic, nonenhancing, elevated peak for NAA | Macrocephlic dysmyelinating leukoencephalopathy, deficiency of aminoacylase-2 |
Alexander’s disease | Macrocephalic, enhancing, no peak for NAA | Macrocephalic dysmyelinating leukoencephalopathy |
X-linked adrenoleukodystrophy | Splenium involved, confluent posterior to anterior progression | Inability to metabolize long-chain fatty acids |
MLD | Sparing of U fibers, tigroid T2 signal, enhancement of cranial nerves/cauda equina | Dysmyelinating lysosomal storage disorder affecting children < 2 years old; urine tests for arylsulftase can have false-negative results |
Pelizaeus–Merzbacher disease | Tigroid pattern, connatal form with arrested/absent myelination | Leukodystrophy with arrested myelin development; X-linked; presents within 2 years |
Nonketotic hyperglycinemia | Restricted diffusion, glycine peak on MRS at 3.56 ppm | Elevated glycine present in plasma and urine |
Glutaric aciduria type 1 | Macrocephaly, hypoplastic frontoparietal operculum, arachnoid cysts | Resembles NAT (subdural hematomas), elevated lysine, hydroxylysine, and tryptophan |
L-2-Hydroxyglutaric aciduria | Centripital and anterior-posterior gradient abnormality, involvement of dentate nuclei | Propensity for intracranial neoplasms, dentate nucleus involvement differentiates from other disorders |
Menkes syndrome | Tortuous vessels, subdural hematomas, frontotemporal white matter | Can resemble nonaccidental trauma; kinked hair on examination, copper deficiency, X-linked transmission |
Krabbe disease | Spares subcortical U fibers until late in the disease, dense thalami on CT, cauda equina/optic nerve enhancement | Globoid-cell leukodystrophy, giant cells, three clinical stages of disease, with seizures and eventual vegetative state |
Fahr disease | Symmetric calcifications in deep gray nuclei | Movement disorders and psychiatric symptoms in teenage patients |
Mucopolysaccharidoses | Multiple enlarged perivascular spaces, retinal abnormalities | Many subtypes, including Hunter syndrome, Hurler syndrome, and Sanfilippo syndrome; increased urinary excretion of dermatan and heparan sulfate, except in Morquio syndrome |
Leigh disease | Restricted diffusion in deep gray matter; presence of lactate on MRS | Slowly progressive, leading to respiratory failure, refractory seizures; rate of progression correlates with age of onset |
Zellwegger syndrome | Germinolytic cysts, arrested myelination, polymicrogyria and pachygyria; also affects liver and kidneys | Elevated concentrations of long-chain fatty acids in plasma, intrahepatic biliary dysgenesis, polycystic renal disease, jaundice, death within first year of life. |
MELAS | Cortical/peripheral restricted diffusion | Mitochondrial disease, onset age 2–11 years |
Wilson disease | Panda sign (substantia nigra and red nuclei are surrounded by T2 hyperintense signaling within the rest of the mesencephalon) (lentiform T2 signal) | Abnormal copper metabolism, dystonia, liver dysfunction, psychosis |
Neuronal ceroid lipofuscinosis | Nonspecific features on imaging | Four types based on age of onset: type 1 (6 months –2 years), type 2 (2–4 years), type 3 (5–8 years), type 4 (adolescence to young adulthood) |
Carbon monoxide | T2 hyperintense signal of globi pallidi | Clinical history of carbon monoxide poisoning may not be apparent |
BCAAs = branched-chain amino acids; CT = computed tomography; MELAS = mitochondrial encephalopathy, lactic acidosis, and strokelike episodes; MLD = metachromatic leukodystrophy; MRS = magnetic resonance spectroscopy; NAA = N-acetyl aspartate; NAT = nonaccidental trauma; PLIC = posterior limb of internal capsule. | ||
The number and variety of metabolic disorders and leukodystrophies are worthy of a book of their own, particularly because each of the entities can have highly varied clinical and imaging presentations. This chapter cannot therefore be exhaustive, and references are provided to additional sources of information about the etiologies and features of various metabolic disorders; however, it is hoped that this chapter provides the appropriate framework for seeking additional information when needed. Close communication with the clinical specialty groups that manage patients with metabolic disorders, including neurologists, geneticists, and other specialists, is often required to maximize the yield of diagnostic information about these disorders in the patients whom they affect. However, it is critical to recognize that even at tertiary care centers, barely half of all inborn errors of metabolism/leukodystrophies ever receive a specific diagnosis.
14.2 Terminology
Understanding the terminology for describing and characterizing metabolic disorders is important. A leukoencephalopathy is a pathophysiologic process affecting white matter (leuko) and can be of a wide variety of genetic or acquired etiologies. A poliodystrophy (not to be confused with poliomyelitis) is a condition that preferentially affects gray matter. A pandystrophy is one that affects both gray and white matter. 1
A demyelinating disorder is a process in which there is injury or abnormality to neurons that are already myelinated. Demyelinating conditions related to noninfectious, immune-mediated inflammatory processes are discussed in Chapter 10.
A dysmyelinating condition is one in which there is abnormality in the process of myelination itself.
An inborn error of metabolism is one in which there is a defect in a metabolic pathway that results in the impaired creation of a particular substrate, or results in the impaired clearance and subsequent accumulation of a toxic substance, or both. Disorders resulting from such errors can take the form of organic acidemias, amino acidemias, or lysosomal or peroxisomal storage disorders.
A mitochondrial disorder is an abnormality that affects the function of the respiratory chain in mitochondria and results in the impared energy production within cells. Because of the greater metabolic demands of gray than of white matter, mitochondrial disorders tend to predominantly affect gray matter.
14.3 Imaging Tools
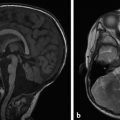
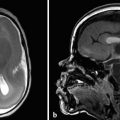
Magnetic resonance imaging (MRI) is the primary imaging technique used in evaluating metabolic disorders, although computed tomography (CT) may be the first modality used in an acute setting and is also helpful in confirming the presence of calcification. A technique that can be particularly helpful in evaluating suspected metabolic disorders is magnetic resonance (MR) spectroscopy. This technique resembles the nuclear magnetic resonance (NMR) spectroscopy used in organic chemistry (and perhaps is the only time in a medical career organic chemistry actually comes into play!). Magnetic resonance spectroscopy exists in the forms of single-voxel and multivoxel MR spectroscopy. Single-voxel spectroscopy provides high-resolution spectra from a single anatomic area, whereas multivoxel spectroscopy provides lower-resolution spectra from a larger area. Multivoxel spectroscopy is more helpful in tumor imaging and biopsy planning, and single-voxel spectroscopy is more important in the evaluation of metabolic disorders. Spectroscopy can also be performed with short (~ 35 msec), medium (~ 144 msec), and long (~ 288 msec) echo times (Fig. 14.1), which refer to the durations of the pulses of resonant electromagnetic radiation used to refocus the spin magnetization of atomic nuclei within a chemical substance.

The three main metabolites identified on MR spectroscopy of the brain are choline (at 3.2 ppm), creatine (at 3.0 ppm), and N-acetyl aspartate (NAA) (at 2.0 ppm). Choline, an organic cation, is present in cell membranes in the form of phosphatidylcholine and sphingomyelin, and is present in elevated concentrations in proliferative tumors. Creatine is related to energy metabolism, and NAA is a marker of neuronal integrity. At birth, the concentration of NAA in the brain is low, after which it increases over the first 6 months to 1 year of age. Eventually, there is a progressive increase in height of the peaks of the MR spectra for choline, creatine, and NAA, leading to an increased angle of ascent of a straight line connecting these peaks, an angle known as Hunter’s angle. Additional metabolic peaks of which to be aware include that of lactate, seen as a double peak at 1.33 ppm, and myoinositol myoI, seen as a single peak at 3.55 ppm. Detailed evaluation of spectra of additional metabolites requires a highly calibrated MR system and is beyond the scope of this chapter. Magnetic resonance spectra can also be obtained with voxels centered in the deep gray nuclei and the deep white matter (either frontal or parieto-occipital) (Fig. 14.1).
14.4 Patterns of Involvement
Differential diagnoses including metabolic disorders can be narrowed by evaluating the patterns of involvement of the central nervous system (CNS) (s. Tab.). Although a given case of such a disorder may appear challenging, breaking down the findings according to sites and types of involvement can clarify its diagnosis and management, and allow a more intelligent interpretation than is possible with a random and haphazard approach. s. Tab. lists the features that should be evaluated for the diagnosis of leukodystrophic disorders.
Central white matter predominant |
Metachromatic leukodystrophy |
X-linked adrenoleukodystrophy |
Vanishing white matter disease |
Neuronal ceroid lipofuscinosis |
Phenylketonuria |
Nonketotic hyperglycinemia |
Gray and white matter abnormality (pandystrophy) |
Canavan disease |
Alexander’s disease |
Krabbe disease |
Maple syrup urine disease |
Leigh disease |
Urea-cycle disorders |
Glutaric aciduria |
Anterior predominant |
Alexander’s disease |
L-2 Hydroxyglutaric aciduria |
Posterior predominant |
X-linked adrenoleukodystrophy |
Mucopolysaccharidoses |
Enhancement |
Krabbe disease (cranial nerves, cauda equina) |
Metachromatic leukodystrophy (cranial nerves, cauda equina) |
X-linked adrenoleukodystrophy |
Alexander’s disease |
Restricted diffusion |
Leigh disease |
Mitochondrial disorders |
Maple syrup urine disease |
Canavan disease |
Metachromatic leukodystrophy |
X-linked adrenoleukodystrophy |
Nonketotic hyperglycinemia |
Feature | Consideration |
Symmetry | Does the abnormality involve both cerebral hemispheres relatively equally? |
Anterior vs. posterior | Are the findings more pronounced anteriorly (frontal lobes), posteriorly (parietal lobes), globally, or in a somewhat random pattern? |
Contiguous or discontiguous involvement | Are there multifocal areas of discontiguous involvement, or are the abnormalities confluent? |
Gray matter, white matter, or both | Does the abnormality predominate in the gray matter, white matter, or both? |
Subcortical U-fiber involvement | If the abnormality predominates in the white matter, is there involvement of the subcortical U fibers, or are these spared? |
Diffusion | Is there reduced water diffusion or facilitated diffusion in the areas of signal abnormality? |
Enhancement | Is there postcontrast enhancement, and if so, is there a specific pattern of enhancement?* |
Cerebellar vs. cerebral | Is the cerebellum involved, are the cerebral hemispheres involved, or are both involved? |
Macrocephaly vs. microcephaly | Does the patient have a large head, or small head, or is the child normocephalic? |
Age of onset | At what age did the patient present (shortly after birth, or later in childhood)? |
Progression | Has the abnormality progressed over sequential studies? |
Delayed milestones vs. loss of milestones | If the patient does not have age-appropriate milestones, is this because of delayed milestones, or has the patient lost milestones that were previously present? |
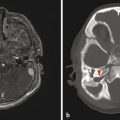
*See Fig. 14.4. | |
Stay updated, free articles. Join our Telegram channel

Full access? Get Clinical Tree


