and Bruce J. Barron2
(1)
Loyola University Medical Center, Maywood, Illinois, USA
(2)
School of Medicine, Emory University, Atlanta, USA
1 Neurology
1.1 Cerebral Death Scan
Tracers
Tc-99m-HMPAO (Ceretec©), Tc-99m- ECD (Neurolite©), Tc-99m DTPA, Tc-99m Pertechnetate.
Tc-99m
Generator produced in the form of Tc-99m Pertechnetate (TcO4 1−) from Mo-99. t phys 6 h. Emits gamma 140 keV (89 %).
Tc-99m HMPAO/Tc-99m ECD
Lipophilic structure, crosses BBB, first-pass extraction of roughly 80 %. Not dependent on blood pressure, temperature, or cessation of phenobarbital.
Tc-99m DTPA/Tc-99m Pertechnetate
Flow agents – lipophobic: Do not cross BBB.
Mechanism
Tc–99m HMPAO/Tc–99m ECD: Blood pool → crosses BBB (lipophilic) → intracellular (cortical cell, via glutathione) → convert to hydrophilic complex → trapped → taken up by the mitochondria and the nucleus. Blue dye is used to stabilize the Tc-99m HMPAO molecule. It prevents the conversion of the Tc-99m HMPAO to a stereoisomeric form that rapidly washes out from the brain tissue. This may also be used as a quality control; blue color indicates the use of a brain agent. Useful when flow images were not obtained properly and carotids flow cannot be evaluated → no need to repeat exam if no brain uptake is noted by the end of the exam.
Tc–99m DTPA and Tc–99m pertechnetate: IV bolus → flow to the internal carotid arteries → Circle of Willis to the anterior, middle, and posterior cerebellar arteries.
Dose
20 mCi. Negative study can be repeated in 6 h with 20 mCi of lipophobic tracers or x2 the initial dose of lipophilic tracer.
Protocol: IV bolus → angiographic phase (flow images) 1 s/frame for 1 min. Blood pool phase: Anterior and lateral images until 500 K counts for 10–20 min with lipophilic tracer +/− SPECT. Or immediate and 10 min delay images with lipophobic tracers.
Target Organ
Bladder: Tc-99m ECD, Tc-99m DTPA, Tc-99m pertechnetate. Lacrimal gland: Tc-99m-HMPAO.
Negative Scan
Lipophilic tracer: Uptake within brain parenchyma. Lipophobic tracer angiographic phase: Visualization of “trident sign” (anterior and middle cerebellar arteries); blood pool phase: Visualization of venous sinuses.
Positive Scan
(brain death):
Lipophilic tracer: No uptake within brain parenchyma. Increase nasal uptake.
Lipophobic tracer: angiographic phase: No “trident sign” with an “empty bulb” appearance (only scalp perfusion from external carotid with no brain perfusion). Blood pool phase: May or may not see venous sinuses.
False Positive
Absence of angiography phase with lipophobic tracers. Use tracer that does not cross BBB (obtaining flow phase is important even with lipophilic tracers).
False Negative
Scalp perfusion on lateral images mimics brain perfusion – apply tourniquet (absolute contraindication in small children).
Poor Prognostic Signs
Tc–99m DTPA/Tc–99m pertechnetate: No flow noted on angiography phase, with a sagittal sinus sign on delay phase images (may also be false negative). Tc – 99m HMPAO / Tc – 99m ECD “Helmet sign” – no perfusion to brain stem and cerebellum. Persistent cerebral perfusion.
Distribution and Clearance
Distribution Trapped in the brain (intracellular, trapped); muscle and soft tissue (not trapped).
Clearance By decay in the brain (trapped). Kidneys and hepatobiliary (not trapped).
Distribution and Clearance: Brain-Specific Agents
Distribution and Clearance: Brain Nonspecific Agents
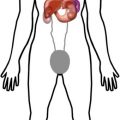
Patient progressed from a negative to a positive brain perfusion scan. Fig. A – flow study demonstrates visualization of “trident sign” on arterial flow phase. Ten-minute delay image demonstrates appearance of a sagittal sinus. Fig. B – on a repeated study 3 days later, a complete loss of brain perfusion is noted on flow images, as well as loss of sagittal sinus uptake on 10 min delay images.

1.2 Brain Scan: Dementia and Epilepsy
Indications
Cerebral perfusion and metabolism (dementia, epilepsy, and brain death).
Tc-99m
Generator produced in the form of Tc-99m pertechnetate (TcO4 1−) from Mo-99. t phys 6 h, emits gamma 140 keV.
Tc-99m HMPAO/Tc-99m ECD
Lipophilic structure, crosses BBB, first-pass extraction of roughly 80 %.
Mechanism
Cerebral flow: Blood pool → crosses BBB (lipophilic) → intracellular (cortical cell, via glutathione) → convert to hydrophilic complex → trapped → taken by the mitochondria and the nucleus. Tc–99m ECD has a longer shelf life, which permits longer delay in administration while waiting on ictal activity to be demonstrated on EEG.
F-18
Cyclotron produced. t phys 109.8 min. Decay: Positron emission; gamma ray energy = 511 keV. Decays to O-18.
F-18 FDG
(fluorodeoxyglucose) is a glucose metabolism agent.
Mechanism
FDG-6P → trapped in cell (missing 2’OH group needed for metabolism). After full decay from F-18 to O-18 (heavy oxygen), it will combine with H+ ion to create 2’OH group that will be metabolized in glycolysis.
Brain scan: Will demonstrate changes in cerebral glucose metabolism associated with foci of epileptic seizures/tumors/dementia.
Dose
Cerebral flow: 20 mCi. Metabolism 10–15 mCi.
Protocol
Tc–99m HMPAO/Tc–99m ECD: IV (Ceretec©) or Tc-99m ECD (Neurolite©) → 15 min- 2 h postinjection SPECT as close as possible to the head. Ictal: done with SPECT under EEG monitoring → inject at the time of seizure. (FDG tphys is too short and preparation is needed).
FDG: Fasting for 4 h (brain) → IV FDG → “cooking” time for 45 min to 1 h. → CT (attenuation correction) and PET images.
Critical Organ
Tc–99m HMPAO lacrimal glands. F–18 FDG Bladder.
Abnormal Brain Distribution Patterns
Alzheimer’s disease: Decreased uptake within the temporal parietal cortex with sparing of the frontal lobe, basal ganglia, thalamus, and cerebellum. Posterior cingulate gyrus is often first to go.
Lewy Body dementia: Decreased uptake within the temporal parietal cortex and occipital lobes with sparing of the cerebellum, basal ganglia, and thalamus.
Frontotemporal dementias: Decreased uptake within the frontal lobe, sparing posterior parietal regions.
Vascular dementia: Diffuse decreased uptake within multiple locations. Can be wedge shaped.
Epilepsy: Ictal: Asymmetrically increased perfusion to the epileptic focus (FDG PET is not used in this phase). Interictal (less sensitive phase than ictal): Asymmetrically decreased perfusion to the epileptic focus (with SPECT) or hypometabolism within the epileptic focus (with FDG PET). FDG PET is slightly more sensitive than SPECT.
Distribution: Tc-99m HMPAO/Tc-99m ECD
Trapped in the brain (intracellular, trapped); muscle and soft tissue (not trapped). F-18 FDG: Brain >> kidneys, ureters, and bladder >> liver, variable: heart, GI, salivary glands, uterus, ovaries, and testes.
Clearance
Tc–99m HMPAO: By decay in the brain (trapped). Kidneys and hepatobiliary (not trapped). F-18 FDG: kidneys, ureters, and bladder.
Distribution and Clearance
Distribution Tc-99m HMPAO Trapped in the brain (intracellular, trapped); muscle and soft tissue (not trapped). F–18 FDG: Brain >> kidneys, ureters, and bladder >> liver. Variable: Heart, GI, salivary glands, uterus, spleen, ovaries, and testes.
Clearance Tc-99m HMPAO By decay in the brain (trapped). Kidneys and hepatobiliary (not trapped). F–18 FDG: kidneys, ureters, and bladder.
Distribution Patterns: Normal
Abnormal Distribution

1.3 I-123 Ioflupane (DaTscan)
Indication
Evaluation of patients presenting with dopaminergic symptoms to differentiate parkinsonian syndromes from essential tremors.
I-123
Cyclotron-produced tphys 13.3 h. Emits gamma photons 159 KeV.
Additional I-123 Uses
Thyroid uptake and scan, whole-body scan for thyroid cancer and I-123 MIBG scan.
Ioflupane
Dopamine Transporter (DaT) visualization agent. Cocaine analog. Phenyltropane compound.
Mechanism
Isoflurane has high binding affinity (reversible) for presynaptic dopamine transporters (DaT) in the striatal region of the brain. Loss of DaT significantly correlates with loss of nigrostriatal neurons in Parkinson disease.
Side Effects
Headache, vertigo, increased appetite, and tactile hallucinations. Accepted medical use with strict inventory. Classified as DEA Schedule II controlled substance due to abuse and dependence potential.
Protocol
Preparation: 1 h prior – 5 drops of thyroid-blocking agent Lugol’s Solution orally. May also use SSKI Solution.
Dose
3 to 5 mCi IV.
Image
3–6 h postinjection, brain SPECT images (approx 30 min).
Interpretation
Normal: Human striatal anatomy, comma shape. Abnormal: Right or left asymmetry within the putamen or caudate nucleus structures, or bilateral decrease/change of normal comma shape.
Critical Organ
Bladder.
Distribution
Consistent with human striatal anatomy (peak uptake 3–6 h with 30 %).
Clearance
By 48 h postinjection, 60 % will be excreted via urine, 14 % GI.
Distribution and Clearance
Distribution Consistent with human striatal anatomy (peak uptake 3–6 h with 30 %).
Clearance By 48 h postinjection, 60 % will be excreted via urine, 14 % GI.
Distribution Patterns: Normal
Distribution Patterns: Abnormal
Semi-quantitative Ratios of region interest (ROI) of highly binding DaT structures (striatum) with ROI of low binding DaT structures such as the occipital lobe. Striatal binding ratio = [mean counts of striatal ROI – mean counts of occipital ROI]/mean counts of occipital ROI.
1.4 Indium-111 DTPA Cisternography
Indications
Cerebral spine fluid (CSF) circulation: (1) Hydrocephalus, (2) CSF leak, (3) ventriculoperitoneal (VP) or ventriculoatrial (VA) shunt patency.
Indium-111
Cyclotron produced from cadmium (Cd-112) target. t phys 2.83 days (67 h). Decays: Electron Capture (EC). Emits: gamma 173 keV (89 %) and 247 keV (94 %).
DTPA (Diethylenetriaminepentaacetic Acid)
A polyaminopolycarboxylic acid chelator, similar to ethylenediaminetetraacetic acid (EDTA) derivatives.
Mechanism
Intrathecal injection of the radiopharmaceutical; will slowly be absorbed in the subarachnoid space which allows tracking of CSF flow dynamics.
Dose
0.5 mCi in 10 % dextrose. Lumbar puncture (LP) and intrathecal injection of the radiotracer.
Hydrocephalus
Concept of normal CSF production and flow CSF will be produced predominantly by the choroid plexus of the lateral, 3rd, and 4th ventricles which will determine the dynamics of normal flow. At any time point, there will be no reverse flow toward the lateral ventricles in a normal individual. Normal CSF flow: Lateral ventricle (CSF production) → 3rd vertical via the foramen of Monro (CSF production) → flow via the cerebral aqueduct of Sylvius → 4th vertical (CSF production) → spinal cord subarachnoid via the foramen of Magendie and two Luschka foramina → basal cisterns → subarachnoid over the convexities.
Protocol Image at 1 h postinjection, 3–4 and 24 h postinjection images of the head and spine in the vertex, anterior, posterior, and lateral projections. 48 h images as needed.
Normal flow following intrathecal injection: Basal cistern activity shows in 4 h images → tracer over the entire convexities in 24 h.
Abnormal flow: Brain atrophy due to age: Delay migration of the tracer over the convexities – no lateral ventricles are seen. Communicating hydrocephalus (normal pressure hydrocephalus) → visualization of the lateral ventricles without migration of tracer over the convexities.
Nasal CSF Leak
Protocol: Intrathecal injection followed by insertion (usually by ENT) of 6 nasal meatus pledgets labeled as superior, middle, and inferior nasal meatus, bilaterally (1–6). Image protocol may vary per location of the radiotracer with time – image at 1 h, followed by 4 and 24 h as needed. Once full migration of the tracer is seen → remove the pledgets → place each in a test tube → measure and record counts of each pledget with a well counter. Draw 10 ml of blood, measure, and record counts. Interpretation: Pledgets counts/plasma counts > 2.5–3 are abnormal. Use pledget labels for accurate localization. Ear CSF leak: Look for asymmetry in the images.
Shunt Patency
Protocol: Inject tracer into a scalp shunt reservoir or via LP. Images at 10 min, 1 h, 6 h and 24 h to confirm migration of the tracer into the peritoneum with ventriculoperitoneal shunts or intravascular with ventriculoatrial shunt.
Critical Organ
Spinal cord.
Pitfalls: In-111, DTPA is used in adults with the advantage of longer half-life and the need of delay images. However, it is not recommended in pediatric population due to high radiation. Tc-99m DTPA may be used instead.
Distribution
CSF flow dynamics.
Clearance
Absorption of labeled CSF into the blood by the arachnoid villi and by the cerebral and spinal leptomeninges in a lesser extent. Within the first 24 h, approximately 65 % of the dose will be excreted by the kidneys and 85 % at 72 h postinjection.
Distribution and Clearance
Distribution CSF flow dynamics.
Clearance Absorption of labeled CSF into the blood by the arachnoid villi and by the cerebral and spinal leptomeninges in a lesser extent. Within the first 24 h, approximately 65 % of the dose will be excreted by the kidneys and 85 % in 72 h postinjection.
Normal Distribution and Clearance
Abnormal Distribution


2 Eyes
2.1 Dacryoscintigraphy
The technique of Dacryoscintigraphy (DS) has not been standardized, with several protocols existing in the literature.
Tracers
Tc-99m pertechnetate or Tc-99m sulfur colloid.
Purpose
Evaluation of lacrimal drainage patency (epiphora – overflow of tears onto the face).
Tc-99m
Generator produced in the form of Tc-99m pertechnetate (TcO4 1−) (+7 valence) from Mo-99. t phys 6 h Emits gamma 140 keV (89 %).
Dose
0.1 mCi.
Mechanism
Direct application of tracer to the eye will demonstrate the normal pattern of tear drainage. (Optimal with special dispenser).
Protocol
Tracer instilled in the inferior fornix simultaneously or near simultaneously via a micropipette, preferably, or a syringe. The volume per eye ranges from 10 to 25 μl (with smaller volumes, it is less likely to cause overflow of tracer onto the cheek).
Image
Patient seated/supine with their cornea less than 2 cm from the collimator (LEAP or LEHR typically, pinholes have been used). Dynamic images (1 min frames for 10–15 min or 10–30 s frames for several min). Static images up to 45 min after instillation.
Target Organ
Lens.
Interpretation
Pre-lacrimal sac (pre-sac) delay → tracer fails to reach the sac by 2–3 min, pre-ductal delay → no sac emptying is seen by 3–5 min, and ductal delay if tracer has not entered the nose by 6 min. Delay to drainage defined as mild (6–15 min), moderate (16–30), and severe (31–45).
Distribution Patterns: Normal
Distribution Patterns: Normal

Distribution Patterns: Abnormal

3 Neck
3.1 Thyroid Uptake and Scan
Indication
Hyperthyroidism, thyroid nodule, neonatal hypothyroidism.
I-123 (Oral)
Cyclotron-produced t phys 13.3 h Emits gamma photons 159 keV.
Tc-99m Pertechnetate (for IV Administration)
Mo-99 generator-produced t phys 6 h. Emits gamma 140 keV.
Mechanism
I-123 Na Iodide Rapid GI absorption of iodine in the extracellular fluid → active uptake in the thyroid follicles by Na/I symporter → protein-bound iodine (organification). Chemical form T3 and T4. All drugs which affect the thyroid hormone synthesis pathway (Synthroid, PTU, Tapazole, Armour Thyroid) will affect iodine uptake (highly regulated by TSH). Additional uptake (non-protein-bound uptake mechanism) by salivary glands, stomach cells (no trapping), and hepatocytes (thyroglobulin metabolism).
Tc-99m Pertechnetate
will be transported via the I/Na Symporter channel to the thyroid follicles without organification → No trapping; will wash out with time.
Dose
Adult: I–123 NaI (0.1–0.3 mCi). Tc–99m pertechnetate (2–10 mCi). Children: I–123 NaI (0.1–0.2 mCi). Tc–99m pertechnetate 1–5 mCi.
Protocol
preparation: stop Tapazole, Methimazole, and PTU for 3 days; no iodinated contrast study in the last 6 weeks. Stop Amiodarone 3–6 m prior to treatment.
Image: At 24 h with I-123 NaI or at 2 h with Tc-99m pertechnetate. Using a LEHR collimator, acquire anterior images followed by pinhole images in ANT, RAO, and LAO projections.
Interpretation
- 1.
I-123 NaI
Hyperthyroidism: Thyroid uptake at 24 h (uptake at 4 h is optional). Normal range is 10–35 % at 24 h and 6–18 % at 4 h .
Assumption: The capsule is counted at T0 and the thyroid is counted at T24.
Formula for I-123: Use a 24 h decay factor = 0.2863.
![$$ \%\ \mathrm{Uptake}\ \mathrm{at}\ {\mathrm{T}}_{24}=\frac{\left\{\left[\mathrm{Neck}\ \mathrm{counts}\ \left(\mathrm{C}\mathrm{P}\mathrm{M}\right)-\mathrm{Thigh}\ \mathrm{counts}\ \left(\mathrm{C}\mathrm{P}\mathrm{M}\right)\right]\times 100\kern0.5em \%\right\}}{\left\{0.2863\ \left[\mathrm{Capsule}\ \mathrm{counts}\ \left(\mathrm{C}\mathrm{P}\mathrm{M}\right)-\mathrm{Room}\ \mathrm{background}\ \mathrm{counts}\ \left(\mathrm{C}\mathrm{P}\mathrm{M}\right)\right]\right\}} $$](http://radiologykey.com/wp-content/uploads/2018/05/A327756_1_En_2_Chapter_Equa.gif)
- 2.
Tc-99m pertechnetate and I-123 NaI
Evaluation of thyroid nodules: Decreased uptake (cold nodule) associated with 15–20 % chance of malignancy → biopsy.
- 3.
Tc-99m pertechnetate
Evaluation of thyroid agenesis/lingual thyroid in neonates with hypothyroidism: If uptake is noted in the thyroid bed → evaluate for organification failure with I-123 scan.
Evaluation of thyroid nodules: If increased uptake is noted on TcO4 1− (hot nodule) → perform I-123 scan → if no uptake → discordant nodule (positive on Tc-99m and negative on I-123 scans) → biopsy (15–20 % chance of malignancy).
Critical Organ
Thyroid.
Concept
Once TSH < 0.1 mIU/L → no uptake will be demonstrated in a normal regulated thyroid cell due to negative pituitary-thyroid feedback.
TSH < 0.1 mIU/L with homogenous uptake in thyroid gland: Graves – if uptake is less than 30 % → look for history of recent large iodine uptake such as multivitamins or contrast CT.
TSH < 0.1 mIU/L with heterogamous uptake in thyroid gland: Multinodular goiter.
TSH < 0.1 mIU/L with one “hot” nodule and no uptake in the surrounded thyroid tissue: Toxic nodule.
TSH < 0.1 mIU/L with no uptake in the thyroid tissue: Subacute thyroiditis or factitious thyroiditis.
Distribution
Iodine-containing tissue (thyroid tissue, salivary gland, and stomach) + GI lumen (oral admin), 7 days post-scan – liver uptake due to thyroid hormone metabolism.
Clearance
Renal, metabolized in the liver.
Suggested Reading
Society of Nuclear Medicine Procedure Guideline for Therapy of Thyroid Disease with Iodine-131 (Sodium Iodide) 3.0
Distribution and Clearance
Distribution Iodine-containing tissue (thyroid tissue, salivary gland, and stomach) + GI lumen (oral admin).
Clearance By kidneys, metabolized in the liver.
Normal Distribution
Distribution Iodine-avid tissue (thyroid tissue, salivary gland, and stomach) + GI lumen (oral admin).
Clearance By kidneys, metabolized in the liver.
Abnormal Distribution
3.2 Tc-99m Sestamibi (MIBI): Parathyroid Scan
Indications
Parathyroid adenoma, elevated PTH with hypercalcemia.
Other Uses
Cardiac stress scan, breast cancer.
Tc-99m
Generator produced in the form of Tc-99m pertechnetate (TcO4 1−) (+7 valence) from Mo-99. t phys 6 h emits gamma 140 keV (89 %).
Mechanism
Lipophilic structure: Passive diffuse to the cell → uptake by mitochondria due to membrane electric potential → retention due to electrostatic interactions → trapped within the mitochondria.
Oxyphil cells: Secreting cell → higher mitochondria concentration → higher tracer retention. Parathyroid adenoma expression of oxyphil secretion cells is higher than normal thyroid gland.
Washout by Pgp (P glycoprotein). Tumor cell [Pgp] expression is related to tumor drug resistance (used in breast CA).
Protocol
IV injection of Tc-99m sestamibi. Early images – anterior static images at 10–15 min of neck and upper chest → delay anterior static images at 1–2 h with or without SPECT/CT, institution dependent.
Dose
20 mCi.
Image Interpretation
Normal: Early images – homogeneous tracer uptake within the thyroid. Delay: Thyroid tracer washout.
Abnormal: Early images – homogeneous/heterogeneous uptake within the thyroid gland. Delayed image: Thyroid tracer washout with persistent uptake within a parathyroid gland. No retention of tracer in delay images may indicate early washout from a clear cell parathyroid adenoma.
Ectopic Parathyroid Adenoma
Intrathyroidal, along the thyroid bed toward the thymic bed, thymus, carotid artery sheath, mediastinum, along the esophagus, and retropharyngeal space.
Hyperplasia: Visualization of all four glands.
Distribution
Early 30 min: Thyroid salivary gland, heart >>> liver, kidney.
Late >60 min: Biliary tract, GI, kidney, bladder > liver, heart >> thyroid, salivary gland.
Clearance
Bile to GI and kidney.
Suggested Reading
GOMES, Elaine Maria Santos et al (2007) Ectopic and extranumerary parathyroid gland location in patients with hyperparathyroidism secondary to end-stage renal disease. Acta Cir Bras. [online]. 22(2)
Distribution and Clearance
Distribution
Early 30 min: Thyroid salivary gland, heart >>> liver, kidney.
Late >60 min: Biliary tract, GI, kidney, bladder > liver, heart >> thyroid, salivary gland.
Clearance Bile to GI and kidney.
Normal Distribution
Abnormal Distribution
4 Lungs
4.1 V/Q Scan: Ventilation
Indications
Acute pulmonary embolism. Also, chronic pulmonary embolism due to pulmonary hypertension.
Ventilation Imaging
Obtained usually before perfusion. Xe-133/Tc-99m MAA: Prevents down scatter energy of higher energy (140–80 keV). Tc/Tc exam: lower dose ratio for ventilation (1 mCi Tc-99m DTPA vs. 3–6 mCi of Tc-99m MAA).
Xenon 133 Gas (Xe 133)
Nuclear Reactor (Fission of U-235), Lipophilic. t phys 5 days, t biol 30 s. Decays: Beta minus. Emits: 81 keV gamma dose 10–30 mCi. Target Organ: Lungs. Operation requires a negative-pressure room.
Image Protocol
Gas is inhaled via a closed system using face mask/mouthpiece:
- 1.
Single–breath phase: Patient breathes Xe-133. Patient takes one deep breath and holds his/her breath.
- 2.
Equilibrium phase: Patient breathes mixed air and Xe-133.
- 3.
Washout phase: Breathes only air. Exhaled Xe-133 delivered to activated charcoal trapping system.
Imaging
Method 1 – Xenon phase performed prior to perfusion: Three anterior/posterior spot images are obtained for each phase (total of nine images). Advantage – no down scatter of higher energy. Disadvantage: All patients required ventilation in the anterior posterior projection.
Method 2 – Xenon phase performed after perfusion: Will be performed only if perfusion images are suspicious for pulmonary embolism. Xenon images will be obtained in the required projection with three images for each phase (total of nine images). Advantage – patients required ventilation in the clinically indicated projection (after review of perfusion images). Patients may not be ventilated at all. Disadvantage: Down scatter of higher energy is present.
Normal Distribution
Homogenous tracer distribution and washout (no defects or trapping).
Abnormal Distribution
Single–breath and equilibrium phases: Normal/slow/no tracer filling.
Washout phase: Tracer trapping/no filling.
Tc-99m-DTPA
Tc–99m: Generator produced in the form of Tc-99m pertechnetate (TcO4 1−) (+7 valence) from Mo-99. t phys 6 h. Emits gamma 140 keV (89 %).
DTPA Aerosol Particle Size 0.1–0.5 μm. Aerosolized by nebulizer.
Mechanism Aerosols precipitate in airway mucosa → crossing the airway membrane → entering the circulation → cleared by the kidney.
t biol is 60–100 min in healthy people and ~ 25 min in smokers.
Target Organ Bladder.
Dose 30–45 mCi liquid is aerosolized by nebulizer to administer a total dose equal to 1–2 mCi.
Imaging Protocol After breathing the aerosols via mouthpiece with nose clip for several min, images can be obtain. (A) multi planar views: ANT/POS, RL/LL, RAO/LPO, LAO/LPO. Or (B) SPECT.
Distribution
Normal: Homogenous tracer distribution (no defects or clumping).
Abnormal: Heterogeneous distribution, cold defects, clumping.
Technetium-99m Technegas
Tc-99m-labeled solid graphite particles (0.005–0.2 μm) in argon carrier gas (gas and particle properties).
Preparation Technegas generator: In a crucible, Tc-99m-pertechnetate is heated to high temperatures in the presence of argon gas to create labeled Tc-99m-carbon particle encapsulated within a layer of graphite carbon.
Mechanism Particles carried to the alveoli by the argon gas and adhere to alveoli mucosa.
Benefits No central clumping and advantage of performing multiview planar images or SPECT.
Target Organ Lung
Dose 20 mCi of Tc-99m is inserted to the Technegas generator to administer a total dose of 1 mCi.
Protocol Radiopharmaceutical delivered to the patient via Technegas generator contains Tc-99m-labeled graphite particle in argon gas. (1) Supine position, (2) nose clip + mouthpiece on, (3) deep breathe and hold for 3 s, (4) exhale, (5) repeat two to three times.
Images (A) Multiview planar images: Ant/Pos, RL/LL, RAO/LPO, LAO/LPO. Or (B) SPECT.
Distribution
Normal: Homogenous tracer distribution (no defects or clumping).
Abnormal: Heterogeneous distribution, cold defects.
Extrapulmonary Distribution
Xenon: Liver uptake – Fatty liver, fatty marrow. Aerosols: Oral cavity, esophagus. Stomach – swallow of particles.
4.2 V/Q Scan: Perfusion
Indication
Acute pulmonary embolism. Other indications: Chronic pulmonary embolism due to pulmonary hypertension.
Perfusion Study
Obtain after ventilation. Xe-133/Tc-99m MAA – Prevents down scatter of higher energy (140–80 keV). Tc/Tc exam – lower dose ratio for ventilation (1 mCi Tc-99m DTPA vs. 3–6 mCi of Tc-99m MAA).
Tc-99m
Generator produced in the form of Tc 99m pertechnetate (TcO4 1−) (+7 valence) from Mo-99. t phys 6 h. Emits gamma 140 keV (89 %).
Macroaggregated Albumin (MAA) Particles
Size: 90 % between 10–90 μm and 0 % > 150 μm; actual range: 20–40 μm. Particles in a size of 1 to ~7 μm are taken up by the reticuloendothelial system (RES). MAA Kit – contains four to eight million MAA particles and stannous ion (to reduce TcO4 1− oxidation state from +7 to +4). Each vial should be reconstituted with up to 100 mCi of Tc-99m pertechnetate.
Tc-99m-MAA: Mechanism of Localization
(known as “capillary blockade”): t biol 2–3 h. MAA particles are larger than the capillaries. Hence, once injected via the venous system, they will be trapped within the pulmonary alveolar capillary bed.
Study Protocol
Dose: Healthy adult: 1–6 mCi, 200–700K MAA particles; ideal number: 350 K with a minimum of 200 K particles. Pulmonary hypertension patient: maximum of 150 K particles. Dose modification 1–3 mCi pregnant (preferred perfusion only with 150 K MAA); known right to left shunt and chronic pulmonary hypertension (1–3 mCi, 150 K particles MAA V/Q). Pediatric 25–50 μCi/kg. Newborn 200–500 μCi.
Imaging (A) Multiview planar images: ANT/POS, RL/LL, RAO/LPO, LAO/LPO. (B) Lung SPECT.
Critical Organ
Lung.
Distribution
Pulmonary alveolar capillary bed.
Abnormal distribution (no PE) (A) right-to-left cardiac shunt: lung, brain, kidneys (B). SVC occlusion: lung, hepatic caudate lobe. (C) Atrial-venous collaterals: lung, kidneys, no brain. (D) Edge scalloping: microemboli due to fat, sepsis, air, tumor, amniotic fluid.
Clearance
MAA particles are fragile and will undergo degradation to be phagocytized in the RES (reticuloendothelial system in the liver and spleen).
4.3 V/Q Interpretation
Pre-test Risk Probability of PE
Well’s criteriaa | |
|---|---|
DVT (diagnosis, clinical signs, symptoms) | 3 points |
PE is highly suspected | 3 points |
HR is > 100 bpm | 1.5 points |
Immobilization > 3 days ar Surgery in the past 4 weeks | 1.5 points |
Prior history of DVT or PE | 1.5 points |
Hemoptysis | 1 point |
Malignancy undergoing treatment in the past 6 m | 1 point |
Score
Well’s criteria
1–2.0 points: Low risk with 15 % probability of PE
2.5–6.0 points: Moderate risk with 29 % probability of PE
6.5–12.5 points: High Risk with 56 % probability of PE
OR:
≤4 PE unlikely
>4 PE likelyRelated posts:

Stay updated, free articles. Join our Telegram channel

Full access? Get Clinical Tree