2 Mammography
Introduction
Mammography uses X-ray projection imaging to acquire images of the breast. Mammography has been the gold standard for breast cancer screening since the 1990s. In addition to breast cancer screening, mammography is used for diagnostic breast imaging. Conventional mammography produces 2D projection images of the breast. The complex anatomical background of structures can hinder tumor detectability. With the advent of digital full-field detectors for mammography, digital breast tomosynthesis (DBT) became feasible. DBT produces quasi-3D images of the breast that provide some depth resolution to overcome limitations of geometric superpositioning in conventional 2D projection images. DBT has helped reduce callback rates from screening mammography and potentially helps increase cancer detection rates.
Mammography utilizes ionizing radiation to detect breast cancers. Since ionizing radiation also induces cancer (albeit at a much lower rate), it is important to limit and monitor the average dose to glandular breast tissues during mammography.
Common Image Quality Problems
Mammography is a unique imaging modality in the sense that it is dedicated to and optimized for a single anatomy. The energy of the X-ray beam, X-ray absorption, and resolution of the detector are optimized for the detection of low-contrast tumors and microcalcifications in the breast. X-ray energies impact radiographic contrast and patient dose, and are optimized to produce images with the best tumor signal-to-noise ratio at the lowest dose. Over- or underexposure of the mammogram due to incorrect X-ray technique is less common in digital detectors than film because of their wide dynamic range. However, there are a number of detector artifacts in digital mammography that can potentially mimic or obscure suspicious findings that must be recognized. In DBT, a quasi-3D image volume is synthesized from a series of low-dose projection images acquired with the X-ray tube moving across an arc of 15 to 50 degrees (depending on vendor implementation). The limited angle acquisition provides some depth resolution, but also causes artifacts in the tomosynthesis image volume.
As in radiography, the most common problem affecting image quality is patient positioning and patient motion. Further, image quality can be affected by artifacts that mimic or obscure relevant anatomy. Speck-like artifacts can potentially mimic microcalcifications. There are multiple causes for these artifacts as described below. Artifacts caused by the image receptor include row dropout and electromagnetic interference (EMI). Mammography utilizes a grid in contact mode. Artifacts due to grid positioning, such as grid cutoff, do not occur because the grid and X-ray source are in a fixed geometry.
2.1 Case 1: Magnification Imaging
2.1.1 Background
Magnification views are acquired when visualization of fine detail is required. Magnification views are often used in the diagnosis of microcalcifications. Fig. 2‑1 demonstrates this effect. A microcalcification cluster is imaged in magnification mode (Fig. 2‑1 a), which is shown enlarged in Fig. 2‑1 b. Fig. 2‑1 c shows the microcalcification cluster imaged in contact mode. The resolution in Fig. 2‑1 c is markedly lower and as a result less detail is perceived.

2.1.2 Findings
The images shown in Fig. 2‑1 a, b were acquired with the breast placed on the magnification stand at a height of 31 cm, resulting in a magnification factor of 1.8 for a source-to-detector distance of 70 cm. An increase in resolution is gained from the magnification setup that includes use of a smaller focal spot compared to contact mode to minimize focal spot blurring. 0
2.1.3 Discussion
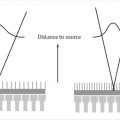
In magnification mode, the breast is positioned on a magnification stand and is thus located closer to the X-ray source (Fig. 2‑1 d). As a result, structures within the breast are magnified by a factor M, depending on the distance between the X-ray focal spot and the breast on the magnification stand (d mag), and the distance between the X-ray focal spot and the detector (d det). The magnification factor M is given by the ratio of these distances as M = d det/d mag.
2.1.4 Resolution
The height of the magnification stand determines the magnification factor. Most mammography systems allow for several heights of the magnification stand.
2.2 Case 2: Focal Spot Size Selection in Magnification Views
2.2.1 Background
Magnification views can help visualize small structures, such as microcalcification clusters, with greater detail. In contact imaging, when the breast is placed directly on the breast support, the system uses a large focal spot (typically 0.3 mm).
When the breast is positioned on the magnification stand and magnification mode is used, the system switches to a small focal spot (typically 0.1 mm).
2.2.2 Findings
Fig. 2‑2 a, b shows a comparison of a test phantom imaged with a large (0.3 mm) and a small (0.1 mm) focal spot. When the phantom is placed on the breast support (Fig. 2‑2 a), the images acquired with a large or small focal spot exhibit similar sharpness. When the test phantom is placed on the magnification stand, the image acquired with the large focal spot is less sharp due to focal spot blur.

2.2.3 Discussion
The focal spot of an X-ray tube is not a single point, but a small area from where X-rays are emitted. In mammography, the size of the focal 0.3 mm (large) and 0.1 mm (small). The finite size of the focal spot results in blurring of the image. 0 This is demonstrated in Fig. 2‑2 a, b and depends on the distance between the focal spot, the breast, and the detector. When the object (i.e., breast) is located in close contact with the detector and the focal spot is far away, focal spot blur is negligible for both the large and the small focal spot. Therefore, the images shown in Fig. 2‑2 a are equally sharp. In magnification mode, the breast is half-way between X-ray focal spot and the detector. In this configuration, the size of the projected focal spot is equal to the actual focal spot size and blurs the image accordingly. This is shown in Fig. 2‑2 b.
The differences in blur become visible when focal spot blur is the dominant factor that limits image resolution. In contact imaging, shown in Fig. 2‑2 a, image sharpness is limited by detector resolution, and therefore no difference in image sharpness is observed when the focal spot sizes are changed.
Fig. 2‑2 c shows how the distance of the object from the X-ray focal spot, d mag, affects focal spot blur. Focal spot blur can be computed from the imaging distances as:

where w is the size of the focal spot, and wblur is the width of focal spot blur.
2.2.4 Resolution
The small focal spot needs to be selected when performing imaging in magnification mode to optimize resolution of the system.
2.3 Case 3: X-ray Acquisition Technique Factors in Mammography
2.3.1 Background
In mammography, technique factors, such as mAs, kVp, filtration, are chosen depending on compressed breast thickness and composition (fatty/heterogeneous/dense). Higher kV is chosen for larger breast thicknesses.
2.3.2 Findings
Mammograms of two different patients are shown in Fig. 2‑3 a, b. The compressed breast thicknesses are 35 and 82 mm. The patients were imaged on the same mammography system using automated exposure control.
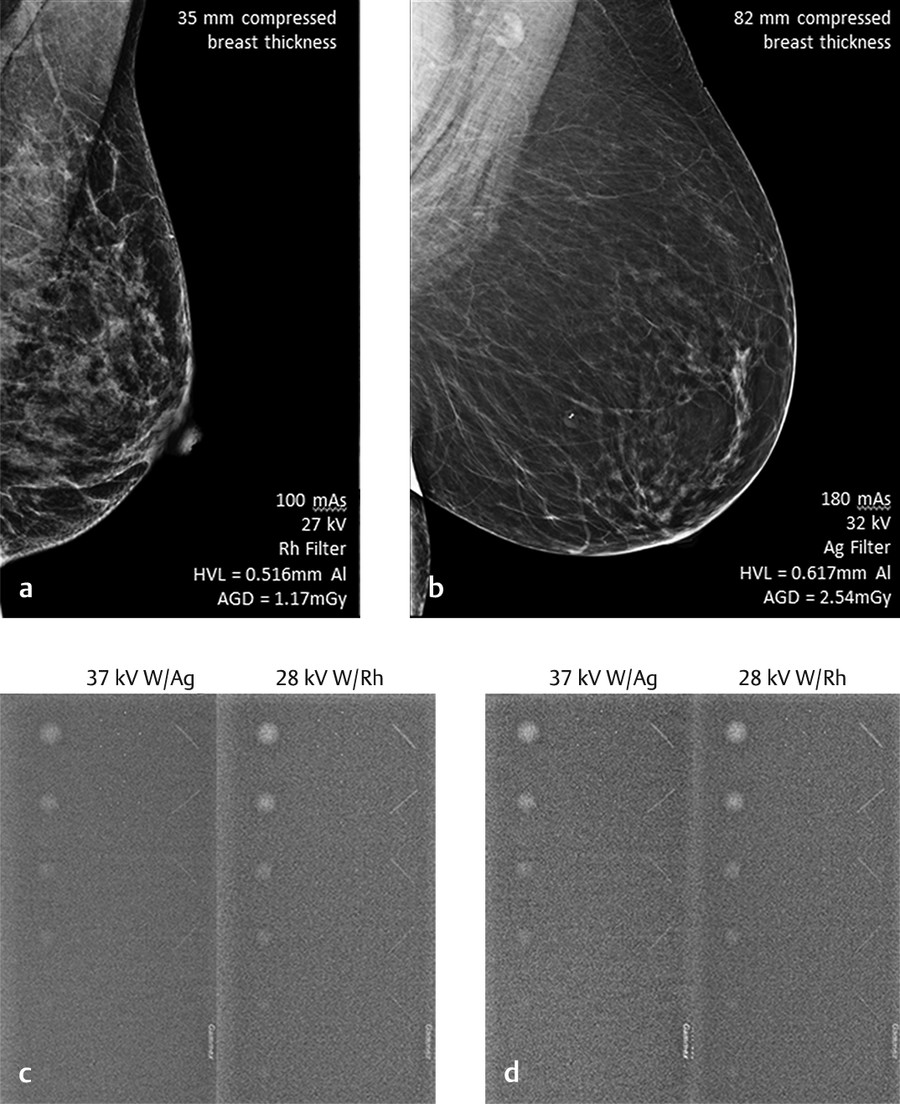
Fig. 2.3 (a, b) Mammographic technique for different breast sizes. (c, d) Signal insert of the full-field digital mammography accreditation phantom imaged at equal average glandular dose (AGD), but different filtration and kV settings. In (c), the display window width is equal for both images. In (d), the display window is different for both kV settings and was chosen to produce equal contrast of the largest mass in both images.
X-ray technique factors (mAs, kV, filter) for the acquisition of these two images are shown in the figure, along with half-value layer (HVL) and average glandular dose (AGD).
The system selected higher mAs, kV, and a different filter to image the 82-mm breast, resulting in a greater HVL and AGD.
The ACR digital mammography accreditation phantom was imaged at equal average glandular dose but different kV and target/filtration settings, and image quality was compared (Fig. 2‑3 c, d).
2.3.3 Discussion
As the X-ray tube potential (i.e., kV) increases, subject contrast is reduced. This is demonstrated in Fig. 2‑3 c, where the contrast of all masses is greater for the 28 kV W/Rh image, compared to 37 kV W/Ag. As the X-ray tube potential (i.e., kV) increases, contrast-to-noise ratio reduces, as shown in Fig. 2‑3 d. The display window width is set to achieve equal displayed contrast of the largest mass, compared to the background. The 37-kV image is noisier, and it is more difficult to see the smaller masses and fibers. Technique factors are set so as to optimize the contrast-to-noise ratio per average glandular dose. For the phantom images, the optimum X-ray technique is 28 kV compared to 37 kV, because it gives better image quality in terms of higher contrast and contrast-to-noise ratio. When imaging a thicker breast, generally a higher kV is used to achieve a more penetrating beam. This is manifested in the increased HVL of the X-ray beam. Improved image quality could also be achieved by increasing mAs to maintain subject contrast, but prolonged exposure times can lead to artifacts from patient motion (see Case 9, Patient Motion Causing Blurred Parenchymal Structure in a Mammogram), and it can also potentially cause X-ray tube heat overloading. In addition, increasing mAs increases dose. Average glandular dose is linearly proportional to mAs, i.e., doubling mAs produces twice the AGD.
2.3.4 Resolution
kV should be increased with breast thickness and breast density to produce a more penetrating X-ray beam that optimizes subject contrast.
2.4 Case 4: Digital Breast Tomosynthesis: Artifacts due to High-Contrast Objects
2.4.1 Background
Tomosynthesis imaging is a quasi-3D imaging modality of the breast. The X-ray source travels along an arc of 15 to 50 degrees, depending on vendor implementation, and a series of low-dose projections are acquired. The tomosynthesis images are reconstructed from these projections.
2.4.2 Findings
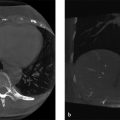
Fig. 2‑4 a shows a large calcification as it appears in the focus plane, i.e., in the tomosynthesis image at the actual depth of the object. The insets show slices displaying the calcification at different depths. The calcification is clearly seen at other depths, but it becomes more distorted as the tomosynthesis image is further away from the in-focus depth.

Fig. 2.4 (a) Artifact due to a high-contrast calcification in tomosynthesis volume. Regions centered on the calcification are shown at different depths. Repeated ghosts of the calcification can be observed at depths far from its in-focus plane. (b) Perpendicular slice through the tomosynthesis volume at the level of the high-contrast calcification. The X-ray tube moves along the X-direction during the tomosynthesis scan.
Fig. 2‑4 b shows a perpendicular slice through the breast volume. The calcification is clearly seen as it fans out as the distance to the focus slice increases. The angle of the fan is that of the tomosynthesis scan.
Related posts:

Stay updated, free articles. Join our Telegram channel

Full access? Get Clinical Tree


