4 Magnetic Resonance Imaging
Introduction
From its inception in the 1970s, and through humble beginnings in the early 1980s, magnetic resonance imaging (MRI) has experienced overwhelming growth in utility and innovation across virtually all diagnostic applications. The power of MRI lies in image contrast, exploiting the inherent magnetic properties of protons predominantly found in tissue water, but also in other biochemical species. The essential tool for an MRI experiment is a large main magnetic field (> 0.5 Tesla), which creates an observable net magnetization in biological samples that can be subsequently manipulated for image formation. A carefully designed collection of radiofrequencies (RF) and time-varying gradient pulses work in conjunction with the main magnetic field to produce image contrast “maps” from received signals that are “weighted” toward specific tissue properties, such as T1, T2, T2*, proton density (PD), and, if desired, diffusion and flow. This image contrast versatility is akin to histopathological tissue staining, wherein specific tissue substructures are highlighted by altering the chemical fixation. Anatomical visualization in MRI can be prescribed in any orientation using multiplanar 2D or 3D slices; however, gating and repetition can be employed to manifest a temporal dimension, allowing cine or 4D visualization.
Since MRI acquisitions depend on tissue relaxation properties (i.e., T1 and T2), adequate time is needed to impart appropriate weighting to the encoded MR signal. In its basic sense, the received signal represents information pertaining to tissue properties, pulse timing, and signal location, which is subsequently stored. A multitude of additional signals are generated, encoded, and stored that are eventually combined and decoded through a process called Fourier analysis to produce a final image. Though some MR acquisitions are on the order of 500 miliseconds for one slice, most scan times are on the order of minutes due to the repeated process of excitation, encoding, timing, and signal reception. Many significant innovations in MRI over the past two decades have focused on reducing acquisition times, mostly by limiting the required data needed for image reconstruction.
In actuality, only a tiny percentage of protons make up the observable net magnetization for MRI. This places significant importance on coil reception sensitivity to optimize signal-to-noise ratio (SNR). Moreover, these SNR constraints may place practical limits on image resolution, especially in comparison to computed tomography (CT). Although SNR can be improved through signal averaging, this prolongs scan times significantly.
Common Image Quality Problems
Motion (bulk tissue movement and flow)
Susceptibility
Aliasing
Truncation
Field inhomogeneity
Coil use and placement
4.1 Case 1: Appearance of Discrete Image Ghosts on Abdominal Imaging
4.1.1 Background
Subject underwent routine abdominal MRI, using multislice gradient echo imaging.
This type of gradient echo data acquisition interleaves collection of phase-encoded data signals from all slices over the course of one repetition time (TR) period (~ 170 miliseconds). Subsequent phase-encode steps are repeated every TR period, until k-space is filled.
Most abdominal MRI acquisitions, such as this, require the subject to suspend breathing for the duration of the scan. Typically, the breath-hold duration is < 20 seconds.
4.1.2 Findings
Subject was not able to suspend breathing during the acquisition.
Upon reconstruction, distinct image “copies” (ghosts) are seen propagating in the anterior-posterior direction (Fig. 4‑1 , Fig. 4‑2 , and Fig. 4‑3).

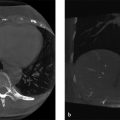
Fig. 4.1 Axial T1 gradient echo of the abdomen showing gross appearance of image ghosts, propagating in the anterior-posterior direction. 
Fig. 4.2 (a–c) Three abdominal cases, showing acquisition during (a) heavy breathing (period motion); (b) incomplete or irregular breath holding, and (c) perfect breath holding. Variation of phase encode data collection accompanies each case. 
Fig. 4.3 Discrete ghosts from pulsatile flow in the aorta propagate in the anterior-posterior direction.
4.1.3 Discussion
The essence of MR signal acquisition and reconstruction relies on data consistency in k-space over the complete duration of the scan (seconds to minutes). A positional change of an object during acquisition will induce an amplitude or phase modulation of the expected k-space encoding step, especially in relation to previous (and future) encoding steps. This modulation in k-space will manifest as a replication of the object in the resultant image due to properties of the discrete Fourier transform. The nature of the replication depends on the nature of the object motion, and how it synchronizes with data acquisition: periodic motion, such as respiration, will usually result in discrete ghosts, while random motion, such as eye movement and swallowing, will result in faint, unstructured ghosts.
Since the effective sampling rate is slower in the phase encode direction (1/TR, for single-echo imaging; 1/echo-spacing, for echo train imaging) compared to the frequency encode direction (1/∆t = bandwidth (BW), ∆t = sampling interval), the sensitivity of k-space modulation and inconsistency is commonly seen along the phase encode direction. This is depicted in Fig. 4‑2 which plots the degree of (normalized) k-space modulation as a function of three types of motional behaviors: deep periodic breathing, shallow breathing, and perfect breath holding. As seen, the change in amplitude among phase-encode steps are much greater than individual frequency-encode steps.
Flow due to moving spins also may induce image ghosts. Like respiratory motion, flow pulsatility coupled with signal amplitude changes from unsaturated spins moving through the imaging plane and can cause modulation of k-space across phase-encode steps (Fig. 4‑3).
4.1.4 Resolution
The simplest tactic to remedy the clinical significance of image ghosts is to exchange phase and frequency directions in order to redirect ghosts into a perpendicular direction, and better reveal tissue under examination. However, any strategy to reduce or entirely eliminate image ghosts involves ensuring k-space consistency over the duration of the data acquisition. As seen in Fig. 4‑2, eliminating ghosts ultimately requires synchronizing phase-encode data collection with known object motion. This synchronization, as employed with navigator or respiratory gating, collects data only from particular motional states (e.g., expiration) and disregards others. Depending on the complexity of motion, data synchronization may result in long scan times or even insignificant motion compensation. Alternatively, if one is able to reduce TR such that the phase encode sampling rate is high relative to the object motional rate, ghosts may become indistinguishable from edge blurring. Reducing TR and echo spacing may also allow breath holding. This latter strategy is the most robust compensation method and is becoming increasingly more applicable due to advancements in parallel imaging and compressed sensing.
4.2 Case 2: A Well-Defined Area of Signal Hyperintensity Appears Bilaterally at the Level of the Internal Auditory Canal on Diffusion-Weighted MRI, Affecting Visualization of Surrounding Structures
4.2.1 Background
Routine brain MRI exam without specific pathologic indication. Diffusion-weighted imaging (DWI) is a standard-of-care acquisition for describing cellular integrity of various tissue types.
DWI is an echo-planar imaging (EPI) technique, utilizing large directionally sensitive gradients to encode movements related to diffusion.
EPI is a rapid gradient echo method that collects all k-space data following one RF excitation (“single-shot”). This typically involves fast gradient reversals, interleaved with incremental phase-encoding steps.
4.2.2 Findings
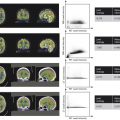
The high signal intensity is an artifact evolving from constructive signal “pile-up” related to susceptibility (arrows, Fig. 4‑4).

Fig. 4.4 Diffusion EPI brain acquisition showing hyperintense signal at the level of the internal auditory canal caused by susceptibility.
The internal auditory canal (IAC) region is an air-filled region with changing geometry that represents a sharp transition of magnetic susceptibility compared to the rest of the brain structure.
4.2.3 Discussion
Tissues and other substances in the body will alter the applied magnetic field based on their tissue properties and chemical composition. “Magnetic susceptibility” is a term that describes the degree to which a substance is able to disrupt the local magnetic field in terms of its strengthening (paramagnetic) or weakening (diamagnetic). Some substances, such as iron, are ferromagnetic which cause significant disruption of the local magnetic field. Significant magnetic susceptibility has two common outcomes: (1) image distortion (or warping), and (2) susceptibility related signal loss. When adjacent tissues have very different magnetic susceptibility, image distortion is likely since the local magnetic field is altered from its expected value. This inhomogeneous environment may disrupt the applied spatial encoding gradients during an MRI acquisition, which are assumed to be linear. In the frequency-encoding direction, a nonlinear gradient will change the overall frequency distribution of encoded spins, where some spatial locations may now be “mapped” with more than one spatial frequency (Fig. 4‑5), resulting in image distortion or signal “pile-up.” The more shallow the applied gradient (low encoding BW), the more significant the spatial mismapping and distortion. Even though this effect occurs predominantly in the frequency-encoding direction, single-shot EPI shows susceptibility-related distortion in the phase-encode direction (Fig. 4‑4) due to the relatively low sampling rate in this direction. Accelerated signal loss is another result of high magnetic susceptibility environments. The large local field alterations induce additional spin dephasing in the transverse plane causing signal loss. Even though the additional field inhomogeneities are mitigated by RF rephasing in spin echo techniques, accelerated T2 decay will still occur. This is not the case for gradient echo techniques, where T2*-related signal loss is the predominant result in high magnetic susceptibility environments (Fig. 4‑6). It is important to note that exploiting susceptibility effects to enhance tissue characterization has recently become an active area of research. Susceptibility-weight imaging (SWI) uses the effect of susceptibility to characterize tissue properties and is especially useful for looking at iron content and hemorrhages in the brain.


4.2.4 Resolution
Complete elimination of image distortion and signal loss due to large magnetic susceptibility may not be attainable, especially for metal implants or other ferromagnetic substances. However, there are several tactics to reduce the impact on surrounding anatomy. Susceptibility artifacts are most prevalent on gradient echo sequences and high field strengths (3T), so switching (if possible) to spin echo alternatives and lower field strengths (1.5T) are the primary options. Also, one should address the key parameters that affect signal loss and image distortion. The former can best be impacted by using lower times to echo (TEs), while still maintaining the desired image contrast. Distortion can be addressed by increasing the imaging BW, which allows for more encoding frequencies and lessens the degree of spatial misregistration. This also allows for shorter TEs. While other strategies exist (such as reducing voxel size), new MR innovations have been developed to incorporate specific susceptibility-reducing attributes, especially for imaging in the presence of metal implants for orthopedic applications.
4.3 Case 3: Appearance of Extra Field-of-view Anatomy on the Inferior Portion of Sagittal 3D T2-Weighted Acquisition of the Spine
4.3.1 Background
3D MR acquisitions are subject to phase encoding in two directions.
Isotropic resolution allows high-resolution reconstructions in secondary directions.
Additional image quality issues exist for 3D acquisitions.
4.3.2 Findings
Large superior-inferior FOV requires activation of both multichannel head coil and cervical/thoracic spine coil elements. Lumbar spine coil elements are deactivated.
Ghost-like artifact resembling the head appears superimposed on the lower part of the image and on the resultant axial reconstruction.
No other abnormal artifacts appear on the upper half of the sagittal image, nor in the left-right direction of the axial series.
3D T2 TSE sequence was applied using volume selective RF excitation, but with minimal oversampling of data in the in-plane phase-encoding direction (superior-inferior direction) to save imaging time.
4.3.3 Discussion
The example shows clear evidence of anatomical wrap-around artifact, also known as “aliasing,” in the superior-inferior direction with a section of the head superimposed onto the lower thoracic spine. This is also apparent on an axial reformatted slice (Fig. 4‑7 a). Aliasing occurs in the phase-encoding direction for both 2D and 3D acquisitions when employing Cartesian k-space trajectories. The possibility of aliasing in any imaging scenario depends on three main situations: (1) whether tissue is within the sensitivity region of an activated RF receiver coil; (2) whether the prescribed FOV is smaller than the anatomical extent in the (2D or 3D) phase-encoding direction; and (3) the excitation region of the RF transmission pulse. In Fig. 4‑7, the top of the head is within a region that has both been excited by an RF pulse and observable by the activated head coil. Since the in-plane phase-encode direction is superior-inferior and the FOV is smaller than this “activated” anatomy, the portion of the head outside the FOV is superimposed, or “wrapped,” onto the other side. This is another form of spatial mismapping due to the MR signal encoding process. To understand the phenomena, note that the tissue outside of the prescribed 2D FOV has still been excited by an RF pulse and thus still subject to applied field encoding gradients. The phase encoding process imparts phase shifts between −180 and +180 degrees within the FOV. However, tissues outside of the FOV still experience phase encoding, but with shifts outside this range (> +180, or < −180). For example, due to the cyclical nature (i.e., sine wave) of MR signals, a phase shift of +185 degrees is equivalent to −175 degrees and is “wrapped” onto other encoded steps of −175 degrees as illustrated in Fig. 4‑8. Aliasing can also occur in the slice direction in 3D imaging. However, the case in Fig. 4‑7 employed slab-selective RF, so that little to no tissue outside the intended volume (FOV in the slice direction) is excited. Even with slab-selective excitation, some residual aliasing may occur, as shown in Fig. 4‑9, since no selective RF pulses have a perfect slice profile.


4.3.4 Resolution
The straightforward remedy for aliasing is to be conscious of the three criteria mentioned above. One must first observe what tissue resides outside the imaging FOV, but within the RF excitation and activated coil sensitivity region. If possible, specific coil elements should be deactivated to avoid encoding this residual signal. However, no receive coils have sharp sensitivity cut-offs. Moreover, the entire coil-sensitivity region may be needed for particular 3D acquisitions. Mostly, users are resigned to “oversample” the tissue outside the FOV, especially if one does not want to increase FOV or coverage for resolution or data limit purposes, respectively. While this strategy is liberally applied in the 2D phase-encode direction, a lesser amount is generally applied in the slice-encoding direction, particularly if slab-selective excitation is used. Phase encode oversampling costs time, but adds SNR, and therefore, should be balanced against other imaging criteria for specific applications. It should be noted, finally, that some aliasing is tolerable: if aliased anatomy does not impinge on the diagnostic region of interest, significant time-savings or optimized resolution can be achieved. Two applications that exploit this are cardiac and phase-contrast imaging.
4.4 Case 4: Precontrast, Axial 3D T1-Weighted Gradient Echo with Fat Suppression Shows Adequate Anatomical Detail, but Minor Edge Ripple and Blur that is Presumed to be Motion
4.4.1 Background
3D gradient echo imaging of the abdomen is a breath-hold technique that will be subject to motion artifacts if the patient cannot comply.
Imaging resolution is 1.4 × 1.7 mm in-plane, with 3 mm (interpolated) slice thickness.
The subject appeared cooperative with breath holding instructions, judging from other acquisitions (not shown).
4.4.2 Findings
There are several areas of edge ripple and blur in the image, including the liver capsule and portal vein.
There is also some signal fluctuation in the visceral fat in the retroperitoneum.
While most ripples emanate in the anterior-posterior direction, some extend in lateral directions as well.
Incomplete breath holding is a source of minor blur in the phase-encode direction; however, the external abdominal wall appears fairly sharp, without indication of signal propagation (Fig. 4‑10).

Fig. 4.10 Breath-hold 3D T1 spoiled-gradient echo with fat suppression, showing adequate breath holding, but subtle ringing and edge enhancements (arrows).
4.4.3 Discussion
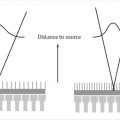
Given the requirements of breath-hold imaging in the abdomen, 3D acquisitions are significantly undersampled in both the phase- and slice-encoding direction to achieve appropriate scan durations. This amounts to a reduced phase resolution and increased slice thickness, respectively. When resolution is too low in a certain direction, truncation (or Gibbs) artifact may occur. Truncation artifact is identified by periodic low- and high-signal intensity ripples emanating from high-contrast edges. While this appearance may closely mimic motion artifact, truncation effects are exclusive to sharp, high-contrast edges, and fade thereafter; there is no replicating of anatomy. This phenomenon is due to the inability of the acquisition to accurately define sharp edges, using the available frequency encoding range, particularly high-frequency data. The consequence is an overestimation and underestimation of the high-contrast structure, which decays with distance (Fig. 4‑11). The propagation distance of ripples is longer if more high-frequency data points are absent from the acquisition.

In-plane truncation artifacts affect both 2D and 3D acquisitions. However, truncation in the slice direction is unique to 3D imaging. Fig. 4‑12 shows a coronal reconstruction of the original data set, given in Fig. 4‑12. The reconstructed data makes the truncation artifact more conspicuous, especially realizing that the axial 3D volume was acquired with 6 mm (3 mm interpolated) slice thickness. The ripples, which are best seen in the spleen and against the fat-suppressed retroperitoneum, are large due to the low resolution in the slice direction. The significance of this artifact is not appreciated when viewed in the standard axial orientation.

4.4.4 Resolution
The 3D truncation artifact seen in Fig. 4‑10 can be improved by reducing the slice thickness, or rather, improving the slice resolution. Similarly, a fully sampled in-plane data set, such as 288 × 288, will also reduce edge ripple in 2D. However, it is important to note that a complete elimination of edge ringing is not possible. This is due to the discrete nature of digitized data sampling in MRI and subsequent Fourier reconstruction. In practice, an infinite frequency range would be necessary to describe a sharp step change in signal intensity between two objects, which is not possible in MRI experiments. However, when high enough resolution imaging is employed, a greater frequency range is available to approximate edge information, with high-contrast features being more well defined (Fig. 4‑13). Even though ringing may still be present, both intensity and ripple distance from the edge location will be progressively reduced, which makes them less conspicuous. If increasing the resolution is not practical due to SNR and time constraints, applying a filter to smooth the image helps to reduce much of the ringing, at the expense of some edge blurring.

Related posts:

Stay updated, free articles. Join our Telegram channel

Full access? Get Clinical Tree


