3 Neonatal Cranial Ultrasonography
The neonatal skull is easily accessible by ultrasound because of its small size and multiple acoustic windows. In sick or preterm neonates, serial brain imaging is indicated to follow brain development and injuries. As minimal handling is recommended, ultrasonography, which can be performed at the bedside, is the preferred tool to visualize the brain of both preterm and high-risk full-term neonates. For a successful neonatal cranial ultrasound (cUS), the examination experience of the sonographer and the use of a modern, portable ultrasound machine with appropriate transducers and presets are required. In addition, the examiner should take the necessary precautions to prevent hypothermia, infection, and disturbance of the infant.
Besides bedside imaging, there are other major advantages of cUS compared with other imaging modalities, including that it is safe, does not involve ionizing radiation, and is relatively cheap. cUS can reliably diagnose most congenital anomalies, hemorrhagic lesions, calcifications, and many forms of hypoxic–ischemic injury. It is, however, less reliable than magnetic resonance (MR) imaging for subtle lesions and does not depict myelination.
In this chapter, we will discuss ultrasound anatomy of the neonatal brain, how to differentiate normal findings from (subtle) abnormalities, the optimal timing of ultrasound examinations, and the most frequently occurring brain lesions of the preterm infant.
3.1 Ultrasound Anatomy of the Neonatal Brain
For a routine ultrasound examination of the neonatal brain, the anterior fontanel is used as the acoustic window. Appropriate presets and well-fitting, appropriate transducers are used. The scan frequency for a standard examination is set at 7.5 to 8 MHz.
The examination includes assessing anatomy, maturation, and the presence of abnormalities by:
Systematically scanning the whole brain in the coronal (from frontal to occipital) and sagittal (from right to left) planes, recording images in at least six standard coronal and five standard sagittal planes.
Additionally recording images of (suspected) abnormalities in two planes.
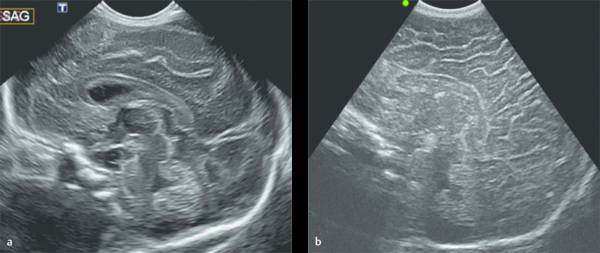
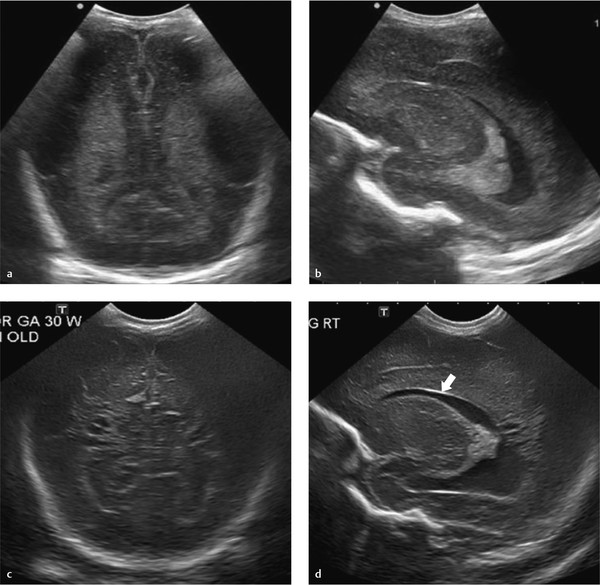
Examples of the standard coronal planes, showing the anatomical structures in both the very preterm and the full term infant’s brain, are presented in Fig. 3.1 , Fig. 3.2 , Fig. 3.3 , Fig. 3.4 , Fig. 3.5 , Fig. 3.6 , Fig. 3.7 , Fig. 3.8 , Fig. 3.9 . For details on the anatomical structures seen in these planes, we refer to recent literature.
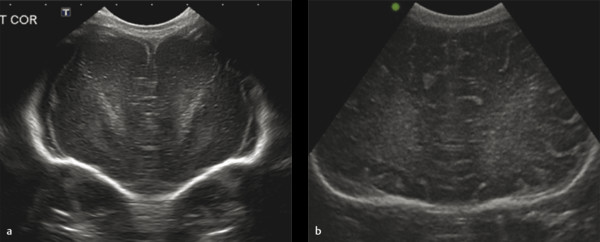
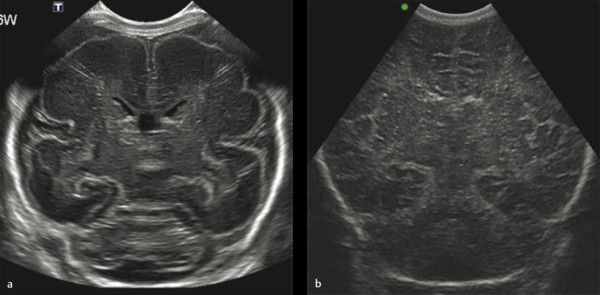


Scanning through the anterior fontanel generally allows an accurate assessment of most supratentorial structures. The posterior parts of the brain, the infratentorial structures, and the brainstem are farther away from the transducer, especially in larger preterm and full-term neonates. These structures can therefore be reliably assessed only if the supplemental acoustic windows (posterior fontanel, mastoid fontanels, and temporal windows) are additionally used. For detailed descriptions on how to use the supplemental windows for cUS and on the anatomical structures visualized while scanning through these windows, we refer to recent literature.
3.2 Maturational Changes and Distinction between Physiologic and Pathologic Echogenic Areas in the Neonatal Brain
Areas of echogenicity are often seen in the neonatal brain. Some of these are normal and related to maturational changes, whereas others may reflect (serious) injury. The distinction is not always easy.
3.2.1 White Matter
The immature white matter is characterized by its very high water content, almost complete absence of myelin, and, in cases of very preterm birth, additionally by migrating glial cells.
So-called frontal echodensities (subtle, homogeneous, symmetric echogenic zones in the frontal white matter and bilateral echogenic lines around/below the lateral ventricles on anterior coronal cUS scans) are related to this glial cell migration and seen in preterm neonates before term equivalent age (TEA; Fig. 3.10 and Fig. 3.11 ). Frontal echodensities should be distinguished from nonphysiologic periventricular echodensities (PVE) that may indicate white matter injury. These are more echogenic, less homogeneous, and less symmetric ( Fig. 3.12 ). “Flag-shaped” echogenicities in the parietal white matter on parasagittal scans, subtle echogenic blushes superolaterally from the lateral ventricles, and linear echogenicities running parallel to the trigone of the lateral ventricles on coronal scans are all considered physiologic phenomena in both preterm and full-term neonates ( Fig. 3.13 , Fig. 3.14 , Fig. 3.15 ). These echogenicities are symmetric, and homogeneous, and they tend to fade with age. The latter are thought to represent the optic radiation. These normal echogenicities should be distinguished from pathologic PVE in the parietal white matter, which are likely to represent white matter injury ( Fig. 3.16 ).


3.2.2 Deep Gray Matter
The immature deep gray matter has a higher cell and tissue density than the immature white matter and therefore appears relatively echogenic compared with the surrounding white matter on ultrasound scans performed in preterm infants before TEA. Especially the caudate nucleus and globus pallidus may look strikingly echogenic. The echogenicity is symmetric and homogeneous and tends to fade with age ( Fig. 3.17 ).

Echogenicity in the deep gray matter should, however, never be considered a normal phenomenon in (near)-term neonates or in preterm neonates beyond TEA. In this age group, it most likely represents hypoxic–ischemic injury, which is associated with serious consequences for outcome. The echogenicity may also be subtle and symmetric and often includes the thalami. A zone of low echogenicity can sometimes be seen between the basal ganglia and thalami, representing the internal capsule. This may cause a so-called onion peel appearance, whereby the echogenic basal ganglia and thalami are seen as separate echogenic structures and are interspersed by the low echogenicity of the internal capsule ( Fig. 3.18 ).

Other echodensities in the deep gray matter, resulting from infarction or hemorrhage, are more echogenic, asymmetric, focal, and easily distinguished from physiologic echodensities ( Fig. 3.19 ).

Lenticulostriate vasculopathy is characterized by linear or punctate hyperechoic areas in the basal ganglia and thalami. It is probably caused by a benign vasculitis of the lenticulostriate vessels and suggestive of mineralization of the arterial wall. It is seen in healthy preterm neonates, but also in association with various abnormal conditions such as central nervous system infections, metabolic disorders, and chromosomal abnormalities. It can easily be distinguished from the aforementioned physiologic deep gray matter echogenicity in preterm infants as it is linear or punctate and follows a typical vascular pattern ( Fig. 3.20 ).

Tips from the Pro
In summary, white matter echogenicities are likely to be physiologic if they have the following characteristics:
The echogenicity does not exceed that of the choroid plexus;
The echogenicity is homogeneous and symmetric;
The echogenicity fades with age.
Echogenicity in the deep gray matter is likely physiologic if it is seen in the preterm period, fades with age, and does not persist beyond TEA. It is subtle, homogeneous, and symmetric. The internal capsule should not be visible as a separate entity.
3.3 Timing of Examinations
The optimal timing and frequency of examinations is of great importance. In the preterm infant, cUS performed on the first day of life will first of all diagnose an antenatally or perinatally acquired lesion (see Fig. 3.16 ; Fig. 3.21 and Fig. 3.22 ) or congenital anomaly ( Fig. 3.23 ). Secondly, it enables the detection of (new) lesions within hours or days after the onset. Most of these lesions are clinically silent. Once the diagnosis is made, the evolution of the lesion over time should be assessed. In infants with germinal matrix–intraventricular hemorrhage (GMH-IVH), this enables timely recognition of post-hemorrhagic ventricular dilatation (PHVD), a potentially serious condition that may need intervention. Another serious complication of GMH-IVH is periventricular hemorrhagic infarction (PVHI). This lesion and its evolution can be diagnosed and followed if serial cUS scans are performed on a regular basis. In preterm infants with nonphysiologic PVE, sequential imaging will show whether the echogenicity will resolve without cystic evolution or whether cystic changes occur. Small cystic lesions develop only 3 to 6 weeks after the abnormal echogenicity is first seen and tend to resolve within several weeks. They may thus not be visible around TEA. In most infants, some degree of ventriculomegaly, resulting from white matter loss, will then be recognized. Not only cystic periventricular leukomalacia (PVL) but also nonphysiologic PVE of longer duration without cystic evolution (noncystic PVL) is associated with suboptimal neurodevelopmental outcome. Therefore, it is important to know the total duration of abnormal echogenicity.


Although GMH-IVH generally develops within the first few days after birth and is thus diagnosed on cUS scans performed during the first week of life, white matter injury may develop at any time during the neonatal period. Late-onset cystic PVL may occur following sepsis, viral infections, necrotizing enterocolitis, surgery, or recurrent apneic spells ( Fig. 3.24 ). It is therefore important to perform serial cUS scans from the day of birth until TEA and to increase the number and intensity of cUS examinations following any acute deterioration ( Table 3.1 ).
GA at birth (weeks) | 23–26 | 27–32 | 33–37 |
Postnatal age | Days 1, 2, 3,a 7a | Days 1, 3,a 7a | Day 3a |
2 weeks | 2 weeks | ||
Weekly to PMA 31 weeks | Weekly to PMA 31 weeks | Before discharge | |
Alternating weeks to PMA 35 weeks | At PMA 32 weeks or before discharge | ||
TEA | TEA | ||
Abbreviations: GA, gestational age; PMA, postmenstrual age; TEA, term equivalent age. Note: aInclude scanning through posterior fontanel and mastoid fontanel. | |||
A cUS examination around TEA is recommended in every very preterm neonate (GA < 32 weeks). It enables the detection/evaluation of the following:
Late-onset cystic PVL;
Focal infarction;
The later stages of cystic PVL and PVHI;
Ventriculomegaly resulting from white matter loss in infants with diffuse, noncystic white matter injury;
Ventricular dilatation and white matter injury due to PHVD.
In the preterm neonate, serial cUS scans from birth until TEA are needed to detect and follow brain injury.
In the preterm neonate, serial cUS scans from birth until TEA are needed to detect and follow brain injury. Table 3.1 shows an example of a scan protocol used in our hospitals. The frequency of cUS examinations should be increased when injury is seen and following any clinical deterioration or recurrent apneic spells.
For other useful scan protocols, we refer to recent literature.
3.4 Measurements
3.4.1 Ventricular Measurements
In preterm neonates with progressive ventricular dilatation, mostly due to PHVD, it is recommended to perform serial measurements of the ventricular system. The decision to treat ventricular dilatation depends largely on these measurements. In order to prevent any further increase in ventricular size and raised intracranial pressure and thereby white matter injury, the treatment of PHVD should be considered when ventricular dilatation is rapidly progressive. In this paragraph, we will demonstrate how ventricular measurements are performed and will refer to reference values. The most frequently used measurement of the lateral ventricles is the so- called ventricular index (VI), introduced by Levene in 1981. It is defined as the distance between the falx and the lateral wall of the anterior horns in the coronal plane. The VI is measured in the third coronal plane (at the level of the interventricular foramina of Monro) at the largest width of both lateral ventricles ( Fig. 3.25 ). The VI increases with age. Values above the 97th percentile indicate ventricular dilatation. The first sign of an increase in intracranial pressure is, however, not dilatation of the lateral ventricles, but a change in ventricular shape with rounding of the frontal horns, so-called ballooning. This phenomenon results in an increase of the width of the anterior horns. The anterior horn width (AHW) is defined as the diagonal width of the anterior horn of the lateral ventricle, measured at its widest point in the coronal plane ( Fig. 3.26 ). The AHW remains constant with age. In the majority of neonates, the AHW is less than 3 mm. Values above 6 mm are associated with ballooning, and intervention should be considered. In extremely preterm infants, dilatation of the occipital horns often occurs before an increase in frontal horn size. The occipital horns are usually more dilated than the frontal horns and may even be the only site of ventricular dilatation. The thalamo-occipital distance (TOD) is defined as the distance between the outermost point of the thalamus at its junction with the choroid plexus and the outermost part of the occipital horn. It is measured in the parasagittal plane ( Fig. 3.27 ). The TOD remains rather constant with age.


The VI graph of Levene has an age range between 27 and 40 weeks. New reference values for the VI, AHW, and TOD were recently published by Brouwer et al, with an age range between 24 and 42 weeks. A summary is presented in Table 3.2 .
GA (weeks) | VI (mm) | AHW (mm) | TOD (mm) | ||||||
P 2.5 | Estimated mean | P 97.5 | P 2.5 | Estimated mean | P 97.5 | P 2.5 | Estimated mean | P 97.5 | |
24+0 | 6.8 | 8.0 | 9.4 | 1.1 | 1.5 | 2.8 | 11.2 | 14.5 | 18.7 |
25+0 | 7.0 | 8.3 | 9.7 | 1.1 | 1.5 | 2.8 | 11.4 | 14.7 | 19.0 |
26+0 | 7.2 | 8.5 | 10.1 | 1.1 | 1.5 | 2.8 | 11.6 | 15.0 | 19.3 |
27+0 | 7.4 | 8.8 | 10.3 | 1.1 | 1.5 | 2.8 | 11.8 | 15.2 | 19.6 |
28+0 | 7.6 | 9.0 | 10.6 | 1.1 | 1.5 | 2.8 | 11.9 | 15.4 | 19.8 |
29+0 | 7.8 | 9.3 | 10.9 | 1.1 | 1.5 | 2.8 | 12.0 | 15.5 | 20.0 |
30+0 | 8.0 | 9.5 | 11.2 | 1.1 | 1.5 | 2.8 | 12.1 | 15.6 | 20.2 |
31+0 | 8.2 | 9.7 | 11.5 | 1.1 | 1.5 | 2.8 | 12.2 | 15.8 | 20.3 |
32+0 | 8.4 | 10.0 | 11.8 | 1.1 | 1.5 | 2.8 | 12.3 | 15.9 | 20.5 |
33+0 | 8.6 | 10.2 | 12.0 | 1.1 | 1.5 | 2.8 | 12.3 | 15.9 | 20.5 |
34+0 | 8.8 | 10.4 | 12.3 | 1.1 | 1.5 | 2.8 | 12.4 | 16.0 | 20.6 |
35+0 | 9.0 | 10.6 | 12.5 | 1.1 | 1.5 | 2.8 | 12.4 | 16.0 | 20.6 |
36+0 | 9.2 | 10.8 | 12.8 | 1.1 | 1.5 | 2.8 | 12.4 | 16.0 | 20.6 |
37+0 | 9.4 | 11.1 | 13.1 | 1.1 | 1.5 | 2.8 | 12.4 | 16.0 | 20.6 |
38+0 | 9.5 | 11.3 | 13.3 | 1.1 | 1.5 | 2.8 | 12.3 | 15.9 | 20.6 |
39+0 | 9.7 | 11.5 | 13.5 | 1.1 | 1.5 | 2.8 | 12.3 | 15.9 | 20.5 |
40+0 | 9.9 | 11.7 | 13.8 | 1.1 | 1.5 | 2.8 | 12.2 | 15.8 | 20.4 |
41+0 | 10.0 | 11.9 | 14.0 | 1.1 | 1.5 | 2.8 | 12.1 | 15.7 | 20.2 |
42+0 | 10.2 | 12.0 | 14.2 | 1.1 | 1.5 | 2.8 | 12.0 | 15.5 | 20.0 |
3.4.2 Measurements of Cerebral Structures
Preterm infants have lower volumes of supratentorial white and gray matter on MRI performed at TEA compared with full-term infants. The corpus callosum (CC) is thinner and the cerebellar volume reduced.
The CC is the main white matter commissure connecting the cerebral hemispheres. It is essential for cognitive development and function. In a normal fetus, the CC grows rapidly, with an almost linear increase in length between 20 and 40 weeks of gestation, while the height remains rather constant during the same period. The cerebellum has important connections with supratentorial brain structures and the spinal cord. It plays an important role not only in motor control but also in language processing, auditory and visual memory, cognition, and social development and behavior. During the fetal period, growth and development of the cerebellum are rapid and critical.
In the human fetus, the CC and cerebellum are markers for brain development. This is related to the rapid growth of both structures and the fact that they are easily visualized by ultrasonography. There can be partial or complete agenesis of the CC. This may be an isolated finding but is also seen in association with other (more serious) central nervous system abnormalities and syndromes.
The cerebellar vermis is abnormal in the fetus with a Dandy–Walker malformation or variant and, again, in association with other central nervous system malformations and syndromes. The transverse cerebellar diameter (TCD) serves as a predictor of gestational age in the fetus. It is also used to assess cerebellar growth and to diagnose cerebellar hypoplasia when the gestational age is known.
In preterm infants, abnormal growth of the CC is associated with delayed cognitive and motor development. Injury to the cerebellum, a frequent complication in very preterm neonates, may severely disrupt its normal growth and development and is associated with abnormal motor and cognitive outcome and behavioral problems. Measurement of cerebral structures in the brain of the preterm neonate can be of clinical importance to diagnose and quantify brain abnormalities and altered development.
The length and height of the CC and the width (maximum anterior–posterior diameter) and height of the vermis are measured in the midsagittal plane during scanning through the anterior fontanel ( Fig. 3.28 ). The TCD (widest diameter of the cerebellum) is measured in the coronal plane through the fourth ventricle, with the mastoid fontanel used as an acoustic window ( Fig. 3.29 ).


3.5 Preterm Infants: Pathology
3.5.1 Germinal Matrix–Intraventricular Hemorrhage
GMH-IVH remains a common neurologic complication of preterm birth, occurring in about 10 to 20% of preterm infants with a GA below 30 weeks. A large IVH and especially a hemorrhage with PVHI are often associated with an adverse neurologic outcome. The risk to develop PHVD increases when GMH-IVH is more severe. About 30 to 50% of infants with a large GMH-IVH will develop PHVD, and around 20 to 40% of infants with a severe GMH-IVH will consequently need a permanent ventriculoperitoneal shunt. The presence of associated white matter injury due to a unilateral PVHI or the presence of more diffuse, bilateral white matter damage as well as the development of PHVD further increases the risk for an adverse neurodevelopmental outcome.
The classification system suggested by Volpe is suitable to describe early and late ultrasound appearances ( Table 3.3 ). It is better to avoid the use of grade 4 and instead provide a separate description of the size, site, and appearance of a parenchymal lesion. Making a distinction between a small hemorrhage restricted to the germinal matrix or a GMH with some blood ruptured through the ependyma into the ventricular lumen is not always possible. The use of the posterior fontanel as an alternative acoustic window has been advocated, showing improvement in the diagnosis of a small GMH-IVH ( Fig. 3.30 ). Using the posterior fontanel is also helpful for looking at the degree of dilatation/ballooning of the occipital horn in infants with PHVD ( Fig. 3.31 ). A GMH at a site other than the head of the caudate nucleus, like the roof of the temporal horn, often remains undiagnosed and will be diagnosed only when MR imaging is also performed.
Description | Generic term |
Grade 1: GMH | GMH-IVH |
Grade 2: GMH and small IVH without ventricular dilatation | GMH-IVH |
Grade 3: GMH and large IVH with ventricular dilatation (clot fills > 50% of ventricle) | GMH-IVH and ventriculomegaly |


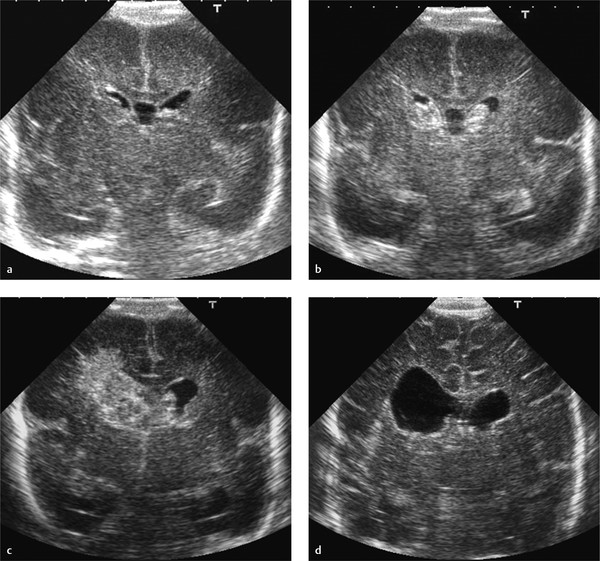
A large GMH-IVH, grade 3, is diagnosed based on presence of a large clot in the ventricle, filling the ventricle more than 50%, as well as acute dilatation of the ventricle involved. A grade 3 IVH may lead to PHVD over a period of 1 to 3 weeks. The diagnosis of a grade 3 IVH cannot be made on a single examination performed during the second or third week, when ventricular dilatation is not acute but has occurred because of PHVD ( Fig. 3.32 ). The maximal extent of the hemorrhage may take a few days. Many centers therefore perform a first scan at the end of the first week. The evolution of a small GMH-IVH to a large hemorrhage would then be missed ( Fig. 3.33 ).


Blood can sometimes be seen in the cavum septum pellucidum. This is not an isolated finding but tends to occur in combination with a GMH-IVH ( Fig. 3.34 ). Blood can also extend into the corpus callosum as a consequence of involvement of the septal vein (Dudink et al; Fig. 3.35 ).


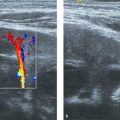
A PVHI is usually unilateral, either globular in shape and communicating with the ventricle containing a moderate to large ipsilateral GMH-IVH, or triangular in shape, with the apex at the outer border of the lateral ventricle and not or partly communicating with the ipsilateral ventricle ( Fig. 3.36 ). In the past, PVHI was considered to be due to direct extension of the hemorrhage into the periventricular white matter, but this is no longer considered to be the most likely explanation for this type of parenchymal lesion. Most would now agree that this type of lesion is due to the presence of a GMH-IVH, which can lead to impaired venous drainage and subsequent venous infarction of the medullary veins of the white matter. This sequence of events can sometimes be followed with sequential ultrasound examinations, with change from a normal image to a stage of simple GMH-IVH and PVHI on the following day ( Fig. 3.37 ). Whereas the globular type of PVHI tends to evolve into a porencephalic cyst ( Fig. 3.38 , Fig. 3.39 , Fig. 3.40 ), the triangular type of lesion is more likely to evolve into multiple cysts, which are partly or even not at all communicating with the lateral ventricle and are therefore sometimes wrongly diagnosed as cystic PVL ( Fig. 3.41 ). This is especially likely to happen when sequential scans are not available and the initial GMH-IVH has been missed. A PVHI may also resolve with cystic evolution, with eventual ex vacuo dilatation on the affected side ( Fig. 3.42 ).


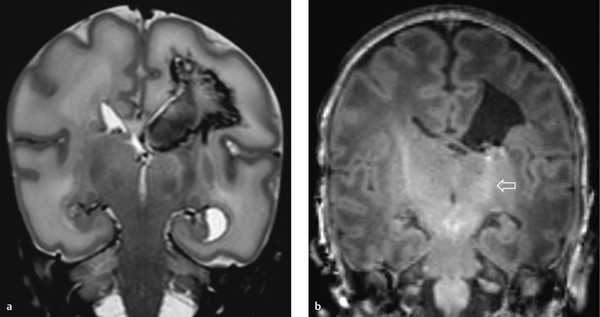


The PVHI is most often seen in the parietal lobe but can also develop in the frontal or temporal lobe, depending on the veins involved (see Fig. 3.42 ; Fig. 3.43 ). The site of the lesion in relation to the area of the trigone of the lateral ventricle is important for outcome prediction. If the lesion is anterior to the trigone (frontal or temporal lobe), the development of a unilateral spastic cerebral palsy is unlikely (see Fig. 3.42 and Fig. 3.43 ). The location is more important than the size of the lesion for outcome prediction. The scoring system of Bassan et al uses size, midline shift, and the presence of bilateral involvement as predictors of outcome. It is sometimes possible to see wallerian degeneration when a scan is performed through the temporal bone in a child at term or near-term age ( Fig. 3.44 ). MR imaging at TEA is highly recommended to look for asymmetry of myelination of the posterior limb of the internal capsule (PLIC), as well as atrophy of the affected cerebral peduncle ( Fig. 3.45 ). Both abnormalities (abnormal myelination of the internal capsule and wallerian degeneration) are highly predictive of abnormal motor outcome.


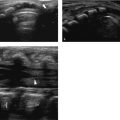
GMH-IVH can be associated with a cerebellar hemorrhage (CBH). This is probably explained by the comparable etiology of the two lesions; GMH-IVH originates from the germinal matrix in the supratentorial ventricular wall, whereas CBH originates from the germinal matrix in the fourth ventricle and/or the extensive granular layer covering the cerebellar surface. CBH can also occur following extension of supratentorial IVH into the fourth ventricle and cerebellum. CBH affects the smallest and sickest preterm neonates, and large CBHs are associated with adverse neurodevelopmental outcome. This is probably related to the fact that a large CBH may permanently disrupt further development of the cerebellum, which undergoes critical and rapid growth and development during the late fetal period and, in case of preterm birth, the preterm period. Recent studies have shown that when the mastoid fontanel is used as an additional acoustic window, most large (> 4mm) CBHs and clots in the fourth ventricle will be visualized ( Fig. 3.46 , Fig. 3.47 , Fig. 3.48 , Fig. 3.49 , Fig. 3.50 ). The small and punctate CBHs ( Fig. 3.51 ) will still be missed, but these are not related to an abnormal outcome, at least during the preschool period. Many centers have now included the mastoid fontanel approach to their routine cUS examinations (see Fig. 3.4 ). CBHs generally develop within the first few days after birth, around the onset of GMH-IVH. We recommend the addition of mastoid fontanel imaging to the routine anterior fontanel cUS procedure at least once in the first week of life and at least twice (with an interval of 4 to 7 days) in preterm neonates with a GMH-IVH.
Tip from the Pro
Use imaging through the mastoid fontanel at least once in the first week of life and at least twice in preterm neonates with a GMH-IVH.
Related posts:

Stay updated, free articles. Join our Telegram channel

Full access? Get Clinical Tree


