Abstract
Dynamic contrast-enhanced MRI (DCE-MRI) is the most effective method for detection of breast cancer. MRI contrast agents are injected intravenously, and significantly decrease the longitudinal relaxation time (T1) of water. This increases signal intensity in heavily T1-weighted images. Large and rapid signal increases (enhancement) are detected in cancers relative to surrounding normal tissue, due to the increased blood supply and capillary permeability of cancers. Experienced radiologists can use DCE-MRI to efficiently and reliably identify lesions that are very likely to be cancers. In this chapter we review mechanisms of contrast enhancement and the distribution of contrast agents in the micro-environment of the breast. Then we discuss the MRI methods used to follow the uptake and washout of contrast agents and the physiologic parameters obtained from DCE-MRI. We discuss new approaches to sampling and reconstruction that can accelerate image acquisition and improve image quality. Very rapid imaging during the first 60 seconds after contrast injection, referred to as ultrafast DCE-MRI, increases sensitivity to cancers, facilitates quantitative, standardized image analysis, and allows measurement of new physiologic and morphologic parameters. Various methods of acquiring and reconstructing ultrafast (UF) DCE-MRI data will be discussed. These methods include ultrafast imaging with conventional Fourier sampling, sliding window or view sharing methods, and compressed sensing. While most commonly used MRI methods detect contrast agents using heavily T1-weighted images, contrast agents also produce large local magnetic field gradients that can be detected by susceptibility weighted MRI. We will discuss potential advantages of dynamic susceptibility weighted scans.
3 Screening MRI: DCE-MRI Methods
3.1 Introduction
Routine interpretation of dynamic contrast-enhanced magnetic resonance imaging (DCE-MRI) studies is based on signal intensity and how it changes with time after the injection of contrast media. Intrinsic lesion characteristics, acquisition parameters and concentration all play a role in signal enhancement. While the discrete categorization of lesion kinetics has been shown to be diagnostically useful, investigators have found that the descriptors of curve shape vary significantly between different scanners and acquisition parameters in malignant lesions. In this chapter, we will review the basic physiologic parameters for DCE-MRI and present new strategies based on significant improvements in MR hardware and new methods for image sampling and reconstruction. Various methods of acquiring ultrafast (UF) DCE-MRI will be discussed.
3.2 Rationale for Clinical Use of DCE-MRI
DCE-MRI is based on measurement of changes in the water proton signal following intravenous (IV) injection of MRI contrast agents. In routine clinical practice, the contrast agents are not detected directly, but rather through their effects on water proton relaxation. Most clinical applications rely on decreases in the longitudinal relaxation time (T1) of water molecules produced by low-molecular-weight chelates of gadolinium (III). Gadolinium (III) is strongly paramagnetic with seven unpaired electrons, and thus provides strong MRI contrast. 1 , 2 , 3 DCE-MRI data are generally acquired with gradient echo sequences with short repetition time (TR) and relatively large pulse angle, so that water proton magnetization is highly saturated. 4 , 5 As contrast agent passes through the arterial blood supply, arrives in each image voxel and leaks out of capillaries into the extracellular, extravascular space, the T1 of the water protons is shortened due to interactions with the large and fluctuating local magnetic field produced by the gadolinium. 2 , 3 This produces very easily detectable enhancement of the water signal, often as much as 300% of baseline intensity in routine clinical practice. The rate of enhancement following IV injection is used as a surrogate measure of perfusion as well as other physiologic and anatomic parameters such as contrast media distribution volume. Breast cancers are characterized by increased blood flow and increased capillary permeability associated with neoangiogenesis, resulting in more rapid enhancement and increased peak enhancement. 6 Thus, degree and rate of enhancement are primary markers for cancer on DCE-MRI.
The sensitivity of DCE-MRI of the breast has been uniformly high across many studies and meta-analyses. A recent analysis by Medeiros et al of 69 different studies found a pooled sensitivity of 90% (95% confidence interval [CI] 88–92%). 7 Individual studies have reported sensitivity ranging from 71 to 100%. Specificity of DCE-MRI, however, has a wide range of reported values, with individual studies finding specificity between 37% and 89%. 7 Medeiros et al reported a pooled specificity of 73% (95% CI 67–79%). However, this number is based on studies of high-risk women. The United States Preventative Task Force 8 cited the lack of studies of intermediate-risk women with MRI and the higher number of false-positives compared to mammography, as well as MRI’s higher cost, as a basis for their decision that there is insufficient evidence to recommend MRI as a screening modality for all women. 9 , 10
Recent studies have demonstrated the potential for advances in screening with DCE-MRI. Most of the studies cited above were performed at magnetic field strengths of 1.5 Tesla (T). While the majority of breast MRI examinations are currently performed at 1.5 T, 11 there has been a recent increase in the use of higher field strengths, specifically 3 T. Elsamaloty et al reported increased sensitivity and specificity of DCE-MRI performed at 3 T, finding values of 100 and 93.9%, respectively. 12 The authors noted that specificity increased from 92.8 to 94.5% over the duration of the study. This is an indication that growing experience in the field may lead to an overall increase of specificity. In the first study of its kind, Kuhl et al recently reported on the results of an abbreviated MRI protocol for the screening of women at mildly to moderately increased risk. 8 The goal of this study was to determine the feasibility of replacing mammography with MRI screening. The abbreviated protocol consisted of one precontrast and one postcontrast acquisition. This protocol can be completed in less than 10 minutes, and thus the true cost of the scan is modest. This protocol was used to screen 443 women with sensitivity of 100% and specificity of 94.3%. These values demonstrate the potential of this technique for breast cancer screening of an intermediate-risk population and/or women with dense breasts.
3.3 How Contrast Media Distributes in the Breast
3.3.1 Perfusion, Capillary Permeability, Extracellular Distribution
Contrast media reaches various areas within the breast between 5 and 15 seconds after IV injection, approximately 6 to 30 seconds after reaching the heart. Cancers often enhance before normal breast tissue due to greater arterial blood supply and higher capillary permeability. 13 Clinically used contrast agents—usually gadolinium chelates—are believed to remain primarily in the extracellular space, although recent studies demonstrated some uptake by cells. 14 The commonly used two-compartment method models 15 , 16 delivery of contrast media to tissue using a plasma compartment in the blood and an extracellular, extravascular compartment. Both compartments are assumed to be well mixed on the MRI time scale, so that the amount of contrast media in each compartment can be represented by a single concentration. The two-compartment model is discussed in more detail in Chapter 12.
In fact, this simple model may not be consistent with normal mammary gland anatomy and the distribution of low molecular weight contrast agents. In normal mammary glands, capillary networks traverse the stroma and reach the edge of epithelia surrounding the mammary ductal lumens. Contrast media molecules are released initially in the stroma, and then leak into the extracellular space in the epithelia. There is evidence to suggest that, after diffusing through stroma and into epithelium, contrast media eventually leaks into ductal lumens. 17 , 18 This is demonstrated by the fact that the contrast media is found in breast milk. 19 X-ray fluorescent studies of the distribution of gadolinium in mouse models of breast/mammary cancer provide important information regarding the contrast media distribution of contrast media in the mammary gland over time. To obtain X-ray fluorescent microscopic (XFM) images of gadolinium concentration in the mammary gland microenvironment as a function of time, mice were sacrificed at various times after contrast media injection and mammary gland tissue samples were frozen and prepared for XFM. 18 , 20 XFM results show a very heterogeneous distribution of contrast agent molecules (based on gadolinium concentration) in the stroma and epithelia surrounding ductal lumens (Fig. 3‑1). This supports the work of Yankeelov et al 21 suggesting that diffusion of contrast agent in the extravascular space may significantly affect the results of pharmacokinetic analysis. In addition, XFM shows leakage of contrast media in ductal lumens, with increasing concentrations in ducts with in situ cancer. This suggests that ductal permeability may be a marker for early preinvasive cancer.

In general, the concentrations of contrast media in the stroma, epithelia, and lumen of mouse mammary glands measured by XFM are very different, and the relative concentrations of contrast media in these compartments change as a function of time postinjection. If this is the case in the human breast, then a simple two-compartment model does not accurately describe the uptake and washout of contrast media in the breast.
A number of more complicated models for contrast media dynamics have been proposed and tested. 13 , 16 , 22 Addition of more compartments can improve fits to data, but the correspondence between the compartments in these models and the structural elements of mammary glands is not well understood. In addition, complicated models with multiple adjustable parameters can only be used effectively when signal-to-noise ratio (SNR) is very high, and this is rarely the case in routine clinical imaging.
The unidirectional flow model is an alternative to the use of multiple compartments. 23 , 24 , 25 , 26 , 27 This method applies to data acquired during the very early phase of contrast media uptake and approximates that the flow of contrast media is exclusively from the capillaries into tissue, with minimal backflow. This is a simple method that does not require a detailed understanding of contrast media distribution in the extravascular space but can only be used when very high temporal resolution imaging is performed to detect the early contrast media kinetics (more details are provided later in this chapter).
3.4 Data Acquisition Methods
3.4.1 Contrast Agent Injection
Contrast media is injected I.V. using an automated syringe at speeds of 2 to 3 mL/s. The concentration of contrast media in the injection solution is typically 500 mM in gadolinium. Therefore, a dose of 0.1 mM/kg is injected in approximately 15 mL of contrast media solution (about 7.5 mM for a 75 kg person), followed by a 20 mL saline flush. The entire dose is injected over 10 to 15 seconds. The contrast media bolus is broadened as it passes through the heart, lungs and vasculature, so that the width of the bolus when it reaches the tissue of interest is typically increased by an additional 5 to 10 seconds by the time it reaches the breast. Therefore, the width at half-height of the contrast media bolus when it reaches the breast is 20 to 30 seconds. 28 , 29 However, Gadavist (gadobutrol), the only contrast agent approved specifically for breast imaging to date, 30 contains 1 M gadolinium, and therefore injection volume is about 7.5 mL, and injections require 7 to 8 seconds. This is expected to produce a somewhat sharper arterial input function (AIF) in the breast. For conventional clinical DCE-MRI, with temporal resolution of 60 to 90 seconds per image, the width of the arterial input function has no influence on diagnostic accuracy. However, when ultrafast DCE-MRI is used to detect the early kinetics of contrast media injection, shorter injections with more concentrated contrast agent solutions may be helpful. 31 , 32 , 33 , 34 , 35
3.4.2 Standard Acquisition Protocols: 60 to 120 Second Scans
Standard DCE-MRI acquisition protocols consist of a series of T1-weighted (short repetition and echo times) spoiled gradient echo acquisitions before and after the administration of GBCA (see contrast injection section above), with or without fat suppression. The American College of Radiology recommends imaging with an in-plane resolution of at least 1 mm × 1 mm with a slice thickness of no more than 3 mm, with scans run bilaterally (i.e., both left and right breast present in the same series), and data acquired at intervals of 120 seconds or less. Typically, DCE-MRI protocols have temporal resolutions ranging from 60 to 120 seconds, and with imaging for 5 minutes or longer after the injection of contrast media. Table 3‑1 compares parameters for conventional clinical DCE-MRI with the ultrafast protocol currently used clinically at the University of Chicago.
Parameter | Fast | High spatial resolution |
TR/TE (ms) | 3.2/1.6 | 4.8/2.4 |
Acquisition voxel size (mm3) | 1.5 × 1.5 × 3.0 | 0.8 × 0.8 × 1.6 |
SENSE acceleration factor (RL) | 4 | 2.5 |
SENSE acceleration factor (FH) | 2 | 2 |
Halfscan (partial Fourier) factor | 0.75 (ky); 0.85 (kz) | 0.85 (ky); 1 (kz) |
Temporal resolution range (s) | 3.5–9.9 | 60–79.5 |
Number of slices | 100–120 | 187–225 |
Flip angle | 10° | 10° |
Field-of-view (mm) | 300–370 | 300–370 |
Fat suppression method | SPAIR (TR: 155 ms; inversion delay: 80 ms) | SPAIR (TR: 155 ms; inversion delay: 80 ms) |
Abbreviations: TE, echo time; TR, repetition time. | ||
A number of different methods have been developed to separate the water signal from the very large fat signal and allow detailed evaluation of the water-containing tissues where almost all cancers are found. Spectrally selective fat saturation (e.g. CHESS 36 , 37 , 38 ) takes advantage of the frequency difference between fat and water resonance to minimize the fat magnetization. To further improve fat suppression, spectrally selective inversion recovery methods take advantage of the frequency and T1 differences between fat and water to acquire signal when the fat signal is nulled. 36 , 39 , 40 Dixon-type sequences are used to provide images with low spectral resolution, and a number of different algorithms are used to calculate relatively pure fat and water images from these data 41 , 42 , 43 . Data acquired with higher spectral resolution, as in high spectral and spatial resolution imaging (HiSS 44 , 45 ), provide improved fat and water separation at the cost of increased run times. Both spectrally selective excitation methods and spectroscopic methods are sensitive to the T2* effects of contrast agents that result in decreased signal intensity during the first pass of the contrast media bolus. All these methods entail a tradeoff between fat suppression efficiency, sensitivity to T2* effects of contrast media, power deposition, SNR, and run time. The optimal fat suppression method will vary depending on the characteristics of the MRI scanner, especially field strength. An understanding of the different fat-suppression options allows radiologists to adopt the most appropriate technique for their clinical practice.
3.4.3 High Temporal-Resolution (“Ultrafast”) DCE-MRI
Standard clinical contrast enhanced scans are performed with high spatial resolution to facilitate morphological evaluation of lesions and detect small cancers. 46 , 47 , 48 The high spatial resolution required, combined with the large fields-of-view necessary to acquire bilateral images, leads to low temporal resolution. As a result, important kinetic information is obscured.
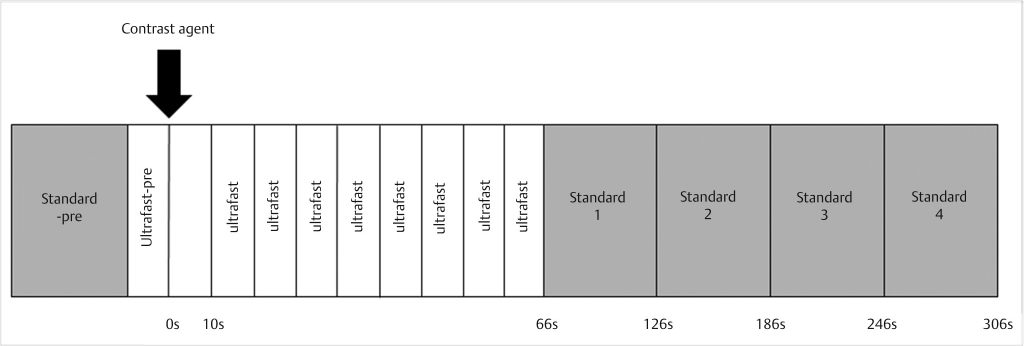
Acquiring DCE-MRI with high temporal resolution is important, as it allows accurate classification of contrast media dynamics in suspicious lesions, and thus aids discrimination between malignant and benign lesions. In addition, high temporal resolution allows accurate measurement of the AIF for each patient, a critical step in quantitative pharmacokinetic analysis. 29 , 49 , 50 , 51 , 52 , 53 , 54 However, the early events in contrast media uptake in normal breast and breast lesions have not been well characterized. Thus, it is difficult to know what temporal resolution is optimal for breast MRI. Ultrafast imaging can be included in both a screening and a diagnostic protocol. One standard acquisition after the ultrafast sequence is sufficient for an abbreviated protocol, whereas the standard 4 or 5 sequences can be added to ultrafast for a diagnostic examination. A diagram of an example protocol including ultrafast imaging can be seen in Fig. 3‑2. Recently several groups have reported promising results with ultrafast protocols, 31 , 32 , 33 , 35 , 54 , 55 and some groups have substituted the first post-contrast DCE-MRI phase in standard protocols with a series of ultrafast images, some of these results and approaches are summarized in the following sections.
Conventional Fourier Sampling Ultrafast Methods
Jansen et al, 35 Pinker et al, 54 and Planey et al 56 used the conventional Fourier sampling methods to image contrast media uptake in the breast at high temporal resolution. Improvements in temporal resolution in these studies came at the expense of either greatly reduced coverage, or lower spatial resolution than standard clinical scans (e.g., Pinker et al reduced spatial resolution from 1 mm to 1.7 mm isotropic voxels). 54 Nevertheless, these studies showed advantages in conspicuity of pre-invasive lesions, and estimation of pharmacokinetic parameters compared to standard, low temporal resolution, clinical scans.
Studies at the University of Chicago characterized the kinetics of early enhancement in arteries, veins, malignant lesions, benign lesions, and normal-appearing parenchyma; and evaluated the performance of parameters descriptive of early kinetics in differentiating malignant versus benign lesions. Potential advantages in lesion detectability were also investigated. The protocol used the conventional Fourier sampling to allow robust quantitative analysis and a novel filtering and analysis method to identify rapidly enhancing lesions. The acquisition protocol used in these studies can be easily implemented in a clinical setting, regardless of vendor or scanner type. Images were acquired at lower spatial resolution and relatively high SENSE (parallel imaging) acceleration factors during the first minute postcontrast injection, to produce full bilateral, fat-suppressed breast images with temporal resolution ranging between 6.2 and 9.9 seconds (higher temporal resolutions are possible with this protocol, particularly at 3 T). Following an initial 60 seconds of fast imaging, subsequent images were acquired using a standard clinical protocol with high spatial resolution, intermediate SENSE factors, and low temporal resolution. Table 3‑1 compares acquisition parameters for the conventional DCE-MRI and the ultrafast imaging.
The ultrafast images during the first minute after contrast media injection provide detailed information regarding the early kinetics in the breast, while later high spatial resolution acquisitions allow assessment of the morphology of small lesions. The results provide new information regarding contrast media uptake kinetics during the first minute after injection and demonstrate the potential diagnostic utility of high temporal resolution imaging.
In an initial pilot study, 31 , 32 ultrafast DCE-MRI was performed on 23 patients with biopsy proven lesions or lesions detected on prior imaging, including a mix of ductal carcinoma in situ (DCIS), invasive cancers, and benign lesions. The study was performed on a Philips Achieva 3T-TX scanner using a 16-channel bilateral breast coil. The DCE series consisted of one standard clinical acquisition, ultrafast acquisitions for 50 to 80 seconds after injection, followed by four standard clinical acquisitions (with the protocols described in Table 3‑1). Contrast media (0.1 mM/kg gadobenate dimeglumine; MultiHance, Bracco, NJ) was injected IV at 2 mL/s.
Arterial enhancement was easily visualized in maximum intensity projections (MIPs), identifying the time at which the contrast media reaches the breast. Thus, lesion enhancement was measured relative to the time of arrival of the contrast bolus in the mammary arteries, rather than the time of injection. This removed variability due to systemic physiology, for example, cardiac output. A digital filter was developed to identify significantly enhancing voxels, and to reduce spurious enhancement due to noise or artifacts. Only pixels with significant and stable enhancement were used for kinetic analysis.
Regions of interest (ROIs) were drawn around the lesions on ultrafast and standard clinical images (at each time point), under radiologists’ guidance, and average signal enhancement was measured at each time point. Background parenchymal enhancement (BPE) was measured for all cases by manually segmenting the parenchyma in a slice in the central part of the breast without any lesions present and measuring the average signal intensity at each time-point. The signal intensity in the blood vessels feeding the lesions was also measured for each time point. Percent signal enhancement (PSE) versus time data were fit to a truncated (uptake only) empirical mathematical model (EMM) for malignant lesions, benign lesions, and parenchyma, 57 , 58 for only the high temporal resolution time-points 57 , 58 , 59
Where A is the upper limit of percent enhancement, and α is the uptake rate (sec-1). From the EMM parameters, three secondary parameters were calculated: (1) initial area under the contrast enhancement versus time curve (iAUC), 60 (2) time to 90% of maximum enhancement (T90), and (3) initial slope (defined as the product of the uptake rate and the upper limit of enhancement). T90 was used as a surrogate for time-to-peak enhancement.
Lesion conspicuity was quantified by calculating the ratio of signal increase in the lesion to the signal increase of normal parenchyma at each time-point:
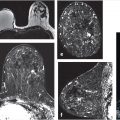
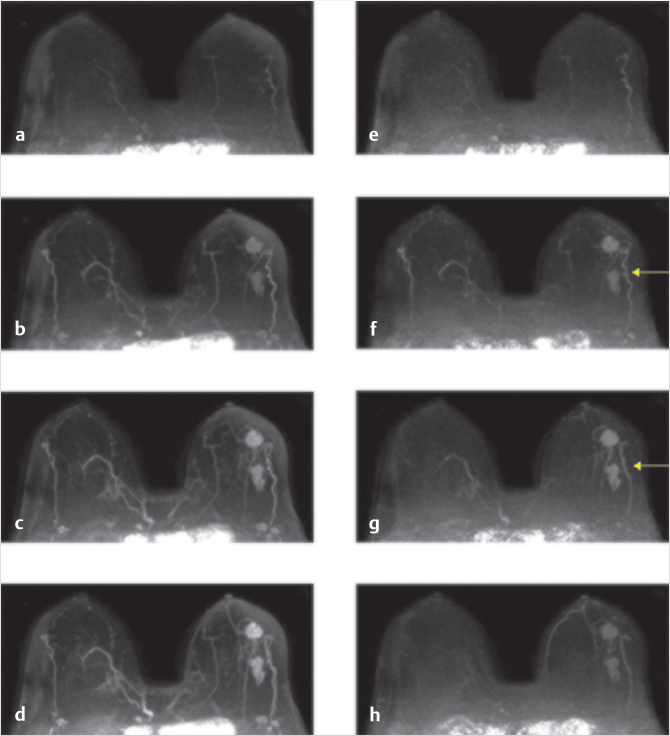
MIPs from ultrafast DCE-MRI (Fig. 3‑3 a-d) standard subtractions, (Fig. 3‑3g,h) enhancement gradient, show signal increase in the vessels, including very early enhancement in tortuous vessels directly feeding tumors followed by signal increase in the tumors. The enhancement gradient images (each image subtracted from the immediately succeeding image) show a slowing signal increase in the arteries, and in Fig. 3‑3g a blood vessel posterior and lateral to the lesions is seen enhancing immediately after enhancement of the lesion; this is likely a vein draining the tumor. For most cases (19 out of 20), significant arterial enhancement (> 20%) was measured in the second or third ultrafast postcontrast image, in the internal mammary artery. For three cases, the vessel feeding the lesion began to enhance at the same time as the internal mammary artery. In all other cases, the vessel feeding the lesion enhanced later than the internal mammary artery.
The average percentage of significantly enhancing voxels in the whole field-of-view (FOV) started at 0.4% of the FOV at the first time-point post injection (when in most cases only the heart was enhanced) and monotonically rose to 5.7 ± 1.9% at the fourth time point, and 7.3 ± 2.5% of the entire FOV by the last ultrafast acquisition. This means that enhancement at early times after contrast injection is very sparse.
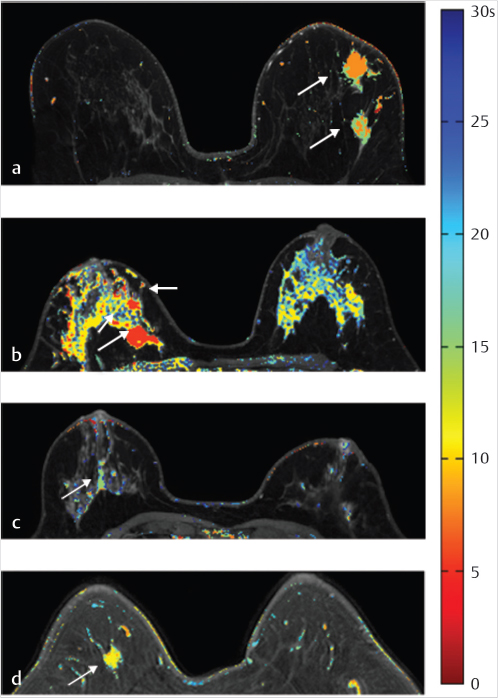
Time-to-enhancement (TTE) maps were created as a way of visualizing the time at which lesions began enhancing and the heterogeneity of the TTE within lesions. Examples of these maps can be seen in (Fig. 3‑4), for both malignant and benign lesions. The results shown are typical of the lesions imaged; the average TTE was much shorter (p < 0.01) for malignant lesions (18.4 ± 12.9 seconds) than for benign lesions (43.5 ± 36.1 seconds). Intralesion heterogeneity in TTE can also be appreciated in these maps. In benign ROIs, the average intralesion coefficient of variation in TTE was 0.58 ± 0.37, and in malignant lesions was 0.38 ± 0.51. Thus, heterogeneous enhancement patterns at early times after injection may be an additional marker for cancers that is only available from ultrafast DCE-MRI.
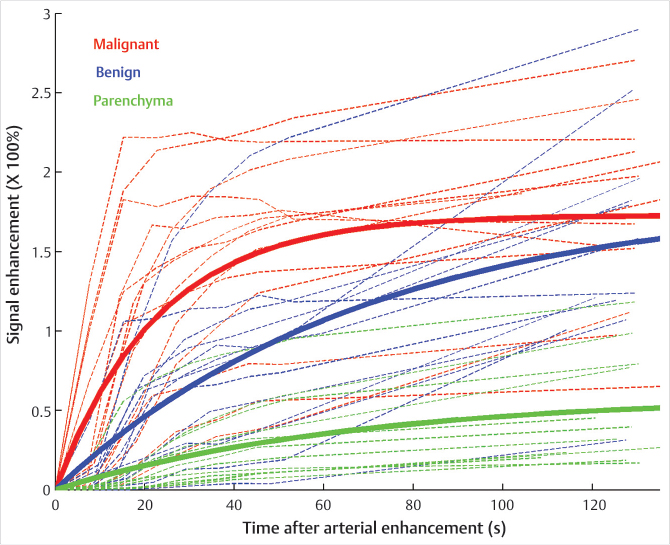
Average signal enhancement from the ROIs, as a function of time relative to the time of injection, is plotted in (Fig. 3‑5) for malignancies (n = 18), benign findings (n = 15), and BPE (n = 20). On average malignancies enhanced strongly throughout the first minute relative to benign lesions and parenchyma. The average EMM fits to the data from malignant lesions, benign lesions, and parenchyma are also plotted as solid lines, using the average value of arterial time-of-arrival, 11.6 ± 5.8 seconds relative to the injection time, for illustration purposes. Significant differences (post-Bonferroni corrections) were found between benign and malignant lesions for EMM parameters related to the rate of early enhancement.
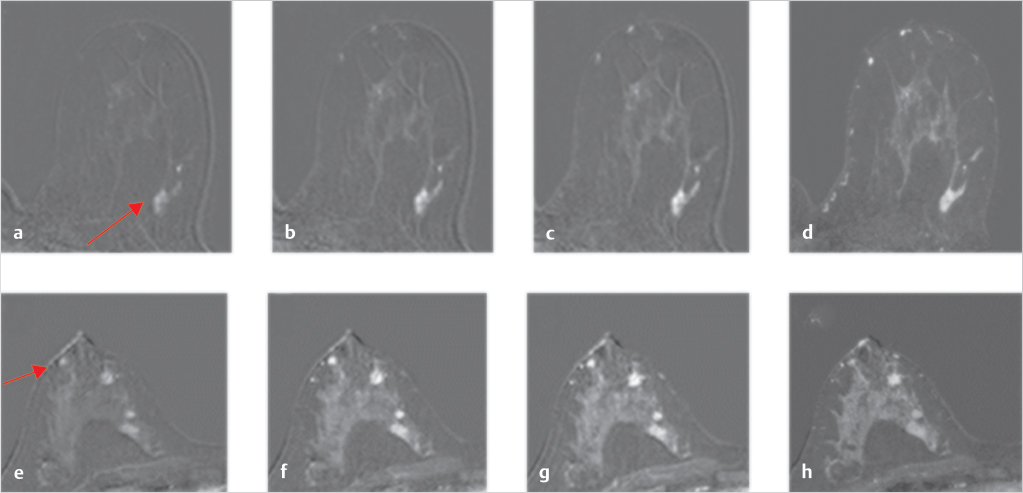
Lesion conspicuity (across all lesions) was highest during the early ultrafast acquisitions, particularly at the fourth ultrafast acquisition postinjection, where its average was 11:1. The difference between ultrafast and conventional acquisitions was most pronounced in cases with marked BPE. For all these cases, the maximum conspicuity of the lesions occurs too early to be detectable in the standard clinical protocol. Subtraction images for three-time points sampled with ultrafast imaging and the first time-point of the standard clinical protocol, from two of the cases (a fibroadenoma and a satellite invasive ductal carcinoma [IDC]) can be seen in (Fig. 3‑6 ).
These preliminary results show that ultrafast imaging accurately measures the early kinetics of enhancement in lesions, blood vessels, and parenchyma. Ultrafast imaging allowed analysis of the TTE data with respect to the time of initial arterial enhancement. In addition the speed of propagation of the arterial bolus can be measured – and used to estimate arterial blood flow. This is not possible in conventional DCE-MRI with temporal resolution more than 1 minute. As a result, ultrafast imaging allows evaluation of the local vasculature characteristics while reducing the influence of global variables such as cardiac output. The results suggest that ultrafast imaging may detect early enhancement of lesions that occurs before parenchymal enhancement, thus making lesions more conspicuous; this is especially useful in cases with marked parenchymal enhancement (i.e., younger women). 61 , 62 , 63 This is consistent with earlier results obtained by scanning a limited number of slices (include suspicious lesions and their surroundings) with 7-second temporal resolution and demonstrating that this approach detects significant differences between the early enhancement of DCIS and normal parenchyma, thus improving conspicuity of small diffuse cancers. The differences in average values of some of the kinetic parameters between benign and malignant lesions were very large, suggesting a large dynamic range for ultrafast parameters.
Although the current protocol used clinically at the University of Chicago allows detection of approximate “initial time of enhancement” in arteries and veins, the temporal resolution is not adequate to resolve the detailed shape of the contrast media bolus. Higher temporal resolution would allow accurate measurement of the AIF and precise arrival time of the bolus. These parameters can be combined with standard measures of contrast media uptake to increase diagnostic accuracy.
This study was performed on a 3 T scanner, while the majority of clinical scans in the United States are performed at 1.5 T. 11 A similar protocol has been implemented on a 1.5 T scanner with somewhat lower temporal resolution (at least 9 seconds) and good image quality. The protocol described here is used as the clinical protocol at the University of Chicago (at both 1.5 T and 3 T).
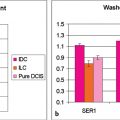
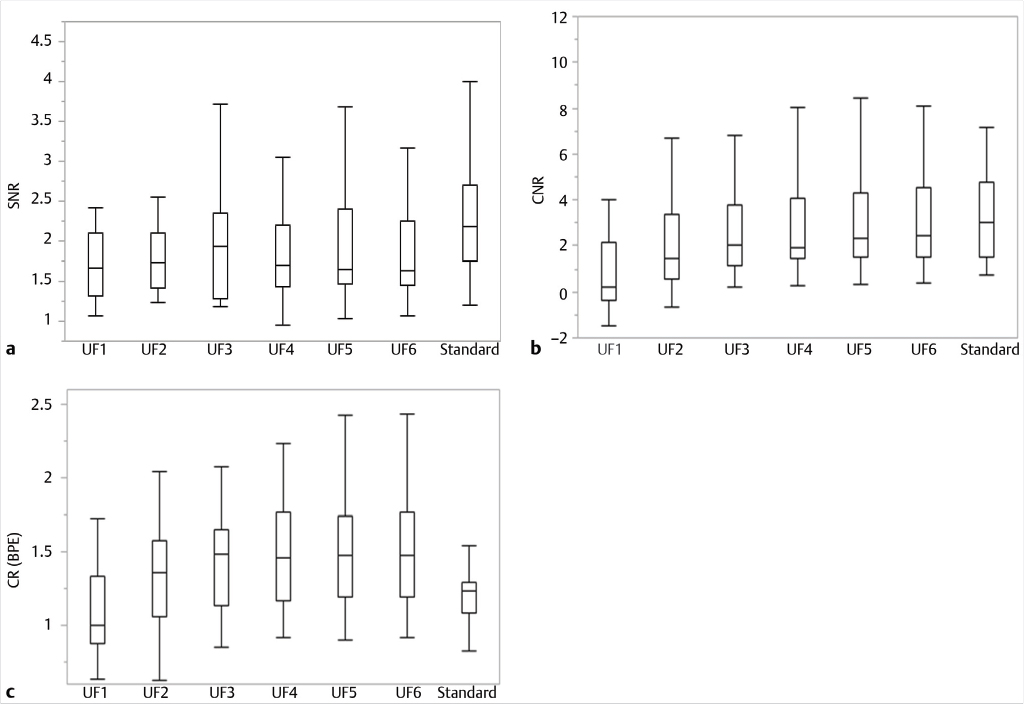
Mori et al implemented a similar ultrafast protocol at 1.5 T with a temporal resolution of 10 seconds (Table 3‑2). Image quality and enhancement kinetics of lesions were evaluated in a study of 33 patients imaged with this protocol, with 33 lesions present (15 benign and 18 malignant). SNR was calculated for each case using the method described by Yu et al. 64 The SNR of the ultrafast DCE-MRI was found to be lower than that of the standard DCE-MRI acquisition, however the difference was not statistically significant (Fig. 3‑7a). Lesion contrast-to-noise ratio was calculated by comparing the signals in the fibroglandular tissue and the lesions of interest (as described by Song et al). 65 The CNR in the phase when enhancement in the aorta was first detected, and in the time point immediately following it were lower than in the rest of the ultrafast phases and in the initial standard DCE phase (Fig. 3‑7b). Lesion conspicuity with respect to BPE was also calculated; lesion conspicuity (or contrast ratio) was higher in the ultrafast images than in the early standard images. However, these differences were not significant (Fig. 3‑7c). The difference in the lesion conspicuity between ultrafast and conventional images was most pronounced in cases with marked BPE.
Parameter | Ultrafast | Standard |
TR/TE (ms) | 4.7/2.3 | 5.5/2.7 |
Voxel size (mm3) | 1.5 × 1.5 × 3.5 | 0.8 × 0.8 × 2 |
SENSE acceleration factor (RL) | 4 | 3 |
SENSE acceleration factor (FH) | 2 | 2 |
Half-scan factor | 0.75 (ky); 0.85 (kz) | 0.85 (ky); 1 (kz) |
Temporal resolution | 10 | 60 |
Number of slices | 110 | 200 |
Flip angle | 12 | |
Field-of-view (mm) | 360 | |
Fat-suppression method | SPAIR (TR: 245 ms; inversion delay: 110 ms) | |
Abbreviations: TE, echo time; TR, repetition time. | ||
In another study by Mori et al, 66 this one performed on a 3 T scanner (Table 3‑3), the performance of using early lesion enhancement for classification of lesions was assessed. 37 patients with 15 benign and 22 malignant lesions were included in this analysis. Axial maximum projection images using this 3 second ultrafast protocol at 3 T are shown in Fig. 3‑8. Relative enhancement rate was calculated in a voxel-by-voxel basis in each lesion ROI. The percent lesion enhancement in the different ultrafast phases was compared between benign and malignant lesions by analyzing the histograms of relative enhancement for the entire ROI. The values from the 50th percentile of the histograms up to the maximally enhancing voxels were calculated for each lesion. Statistically significant differences were found between the relative enhancement of benign and malignant lesions, especially in the first 2 time points following aortic enhancement. For example, the 90th percentile values of enhancement in the first time-point following aortic enhancement were 111 ± 67%, and 26 ± 29% for malignant and benign lesions, respectively. For the following ultrafast phase, these values were 160 ± 61% and 57 ± 53%, again for malignant and benign lesions, respectively. These two phases were recommended by the authors as the most effective in which to detect the differential leakage of contrast agent between benign and malignant lesions.
Parameter | Ultrafast | Standard |
TR/TE (ms) | 2.8/1.5 | 5.2/2.6 |
Voxel size (mm3) | 1.1 × 1.7 × 4 | 0.7 × 1.2 × 1.8 |
SENSE acceleration factor (RL) | 3.2 | 1.6 |
SENSE acceleration factor (FH) | 2.2 | 1 |
Half-scan factor | 0.7 (ky); 0.7 (kz) | 0.75 (ky); 0.8 (kz) |
Temporal resolution(s) | 3 | 60 |
Number of slices | 80 | 170 |
Flip angle | 10 | |
Field-of-view (mm) | 350 | |
Fat-suppression method | SPAIR (TR: 153 ms; inversion delay: 57 ms) | |
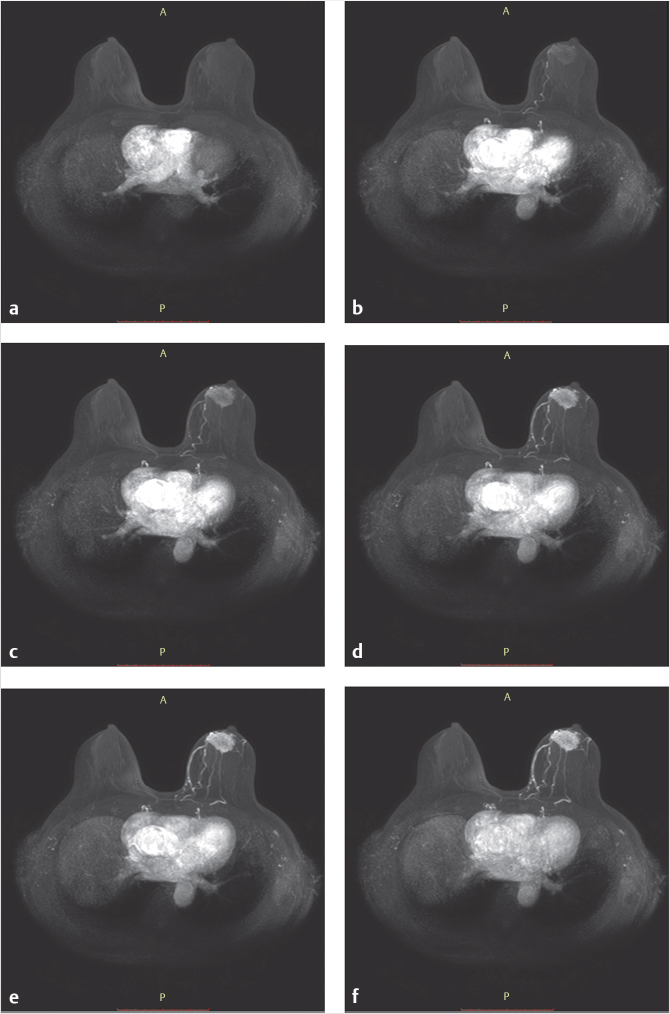
Axial maximum intensity projections (MIP) images of ultrafast DCE-MRI (obtained in the very early phase) show a mass lesion in the left breast. (a) The ultrafast scanning phase shows initial enhancement is referred to as “UF1.” (b–e) Subsequent 3-second phases are referred to as “UF2,” “UF3,” etc. (b) The feeding artery from internal mammary artery is detected (arrow). (c–f) Heterogeneous and gradual enhancement in the mass lesion is detected in each of the 3- second MIP images.
DCE-MRI (Standard) (b). CR (BPE) of UF2, UF3, UF4, UF5 and UF6 was higher than that of standard DCE-MRI (Standard) (c).
Pinker et al reported that a combined high temporal and high spatial resolution protocol (similar to the ones described above) allowed accurate detection and assessment of breast lesions, with a sensitivity of 100% and specificity of 72.2%. 54 In this study, ultrafast DCE images were acquired from 34 patients with a temporal resolution of roughly 13 seconds, and contrast media kinetics were sampled for 3.5 minutes after the injection of contrast.
In addition to potentially increased sensitivity, ultrafast imaging may also improve specificity by ruling out cancer in cases where there is no significant lesion enhancement at early times after arrival of the contrast bolus in the breast.
Stay updated, free articles. Join our Telegram channel

Full access? Get Clinical Tree


