34.1 Observation Using the Five Senses
The most fundamental skill used by the physician is observation. Engaging as many senses as possible, physicians construct a vision of the patient’s health and disease process. The five traditional senses with which physicians examine patients include sight (vision), hearing (audition), taste (gustation), smell (olfaction), and touch (somatosensation). Before the development of modern medical imaging, physicians inspected the outside of the body visually, noting abnormal color such as yellow sclera of eyes in patients with jaundice. Physicians have specialized techniques for the laying on of hands to percuss and palpate the body through which the source of pain is localized and evaluated. The stethoscope amplifies sounds, including the beating of the heart and peristalsis in the gastrointestinal tract. This is most frequently combined with touch and visual inspection. Smell is a powerful input for specific disease states. The sweet fruity odor of acetone in the patient’s breath is highly associated with diabetes and diabetic ketoacidosis.
Through these elements of physical examination, hypotheses are generated and tested until the physician has an understanding of the signs and symptoms of disease. It is from this process that physicians have long been able to diagnose common diseases and create differential diagnoses for diseases that require further testing for diagnosis.
34.2 Brief History of Imaging in Medicine
34.2.1 Visual Observations Made Possible by Radiography
Medical imaging began with Wilhelm Conrad Roentgen’s discovery of the cathode or X-ray while studying the effects of electrical charge on vacuum tubes in 1895 (Thomas and Banerjee, 2013). Prior to this discovery, images of the inner workings of the human body were done via careful observation during surgeries and postmortem examinations and the generation of hand-drawn images such as those made by Leonardo da Vinci. Roentgen, however, saw the bones inside his hand when he placed it between an electrically charged vacuum tube and a barium platinocyanide-coated screen designed to detect fluorescence. The fluoroscope was invented shortly after his discovery. Roentgen earned an honorary medical degree and was awarded the Nobel Prize in 1901.
Many advances followed, leading to the creation of hospital departments of radiology using fluoroscopy and radiography to look at multiple parts of the body, including the lungs, the gastrointestinal and genitourinary systems as well as bones. Fluoroscopy provided real-time visualization of physiologic processes. This was particularly helpful for examination of the gastrointestinal tract. Projection radiographs could create life-size still images (Figure 34.1). Radiologists were able to use series of such images to better localize findings and tomographic images to look more closely at localized structures within the body.

Figure 34.1 Example of a projection chest X-ray.
34.2.2 Development of Modalities from Projection to Volumetric Data
Medical imaging continued to develop rapidly in multiple directions using a variety of strategies with and without ionizing radiation. Artificial radioactivity was discovered in 1934 and by 1946 radionuclides were produced that could monitor biochemical processes. Iodine-131 allowed thyroid gland imaging as well as quantification of thyroid function and monitoring of treatment for hyperthyroidism (Figure 34.2). By the early 1970s nuclear medicine became a recognized modality for medical imaging (Mettler et al., 2009). The use of ultrasound for medical imaging began with the application of sonography to detection of gallstones in 1948 with clinical ultrasound systems introduced into obstetrical practice in 1956.

Figure 34.2 Nuclear medicine scan can provide valuable anatomic and physiologic information to correctly guide patient care. Sulfur colloid is trapped in liver and spleen tissue. The lateral chest radiograph to the left of the liver–spleen scan reveals the bullet that ruptured the spleen and brought splenic tissue from the abdomen to the chest. Without this specific identification of pleural splenosis, the nodules seen on computed tomography would have been treated as cancer.
Felix Bloch and Edward Purcell received the Nobel Prize in 1952 for the discovery of the magnetic resonance phenomenon, with development of a clinical scanning prototype in 1977. Cross-sectional imaging by computed tomography (CT) developed in the 1960s through the combination of developments in X-ray imaging and computing (Figure 34.3). Sir Godfrey Newbold Hounsfield and Allan McLeod Cormack received the Nobel Prize in Medicine in 1979.

Figure 34.3 Example of a computed tomography (CT) image slice. Today’s CT devices collect thousands of these slices to create volumetric representations of organs. LLL, left lower lobe; LUL, left upper lobe; RLL, right lower lobe; RML, right middle lobe; RUL, right upper lobe.
Since 1980, the number of images in an individual medical imaging study has increased exponentially over and over again. The ability to look at organs and diseases in different complementary ways has also propelled medical imaging to the premier diagnostic multimodality enterprise that is the modern radiology department, perhaps more appropriately described as the department of medical imaging.
Over the past 30 years, technological advances in CT and magnetic resonance imaging (MRI) have resulted in more rapid and complete imaging (Lowe and Kay, 2014; Smith, 2014). The relatively small size of the head and lack of significant movement within it make it the ideal target for early development of imaging protocols. The chest and abdomen raise more technological issues as the patient can only suspend respiration for less than 1 minute and the heart cannot be stopped, creating motion artifacts that degrade image quality.
Over time, CT technology moved from pixels to voxels and ultimately isotropic voxels. Multidetector CT provides volumetric images that can be reformatted in multiple planes without loss of resolution. Even this is not the end of the CT technology pathway, as dual-energy CT scanning brings physiologic parameters to join the high spatial resolution of anatomy in CT images. This is now entering clinical practice for differentiation of anatomy from physiology through creation of two sets of images from a single CT scan acquisition that can be tailored for a variety of investigations and through subtraction, creation of virtual noncontrast-enhanced CT images from a contrast-enhanced CT scan.
Even mammography has moved to volumetric imaging with digital breast tomosynthesis and breast MRI, creating a new deluge of tomographic/volumetric images (Gilbert et al., 2016). The number of imaging enhancements continues to increase across all areas of radiology, providing more sophisticated and often crucial data (see Chapter 21 for more information on three-dimensional imaging).
Medical imaging has fundamentally changed the process through which the senses are used to examine the patient, diagnose disease, and create plans for treatment. It is the noninvasive visualization inside the patient’s body that has propelled modern medicine to diagnose and treat many diseases that had not previously been understood. In the busy emergency room, medical imaging often replaces bedside physical examination. Consultations can be sought from around the world using medical imaging as a surrogate for physical examination. Telemedicine owes much of its development to medical imaging (Bashshur et al., 2016).
34.3 Observations and Pattern Recognition for Diagnosis
The primary goal of the evaluation of all medical imaging is to make a diagnosis. Findings pointed out by the radiologist can also be vital for the proper selection and execution of treatment. Descriptions of individual findings fill radiology reports and serve as an important guide to the radiologist. Pattern recognition operates on at least two levels in this process. The texture created by the contrast between structures creates a pattern within an individual anatomic unit. This is true whether the unit is the organ or the smallest unit of anatomy that can be adequately visualized without specialized magnification. In a lung, this ranges from the secondary pulmonary lobule to segment, lobe, and lung. For purposes of studying disease on medical images, this may also be extended to include both lungs. This allows description of disease from very focal, to multifocal and diffuse. This is a most common historical use of the term pattern recognition in the diagnosis of chronic lung diseases.
Pattern recognition can be applied in different ways to different tissues and imaging modalities. Individual organs have patterns of signal characterized by “spots and dots” on ultrasound and nuclear medicine tests. For the diagnostic endeavor, patterns of disease can also include findings in multiple organs. An individual finding may cause the radiologist to methodically search for additional findings that may be found together that will narrow the list of potential diagnoses to a single disease. Findings are more often related to one another than being truly independent. One finding may confirm other findings.
If the contour of the descending thoracic aorta exhibits focal narrowing with distal poststenotic dilatation, the radiologist will search for rib notching present in the majority of adults with coarctation of the aorta due to dilatation of intercostal arteries to confirm a diagnosis of coarctation of the aorta. Look-alike hypertension-induced tortuosity of the aorta will not produce the rib notching. Notching of specific ribs is subtle and might not be noticed without the eye having already been drawn to the aorta. The experienced radiologist will not look for this above the third rib as it does not occur in the first and second ribs. The expert will also have additional domain knowledge about rib notching due to other vascular anomalies, such as an aberrant right subclavian artery resulting in unilateral left-sided rib notching. This example provides insight into how the brain interacts with the visual system in the study of medical imaging.
Selective attention is a two-edged sword. It allows detection of valuable findings that might be overlooked and also leads to satisfaction of search that can preclude detection of other findings. The setting of a finding and coexisting findings also contribute to the ability of the radiologist to study an image at length and draw the wrong conclusion, resulting in an error of attribution. Merrill Sosman, MD, former chair of the Department of Radiology at Brigham and Women’s Hospital, was fond of saying, “You see what you look for and recognize what you know.”
The eye can also be fooled by expectations based upon anatomy. This may occur due to congenital variation, traumatic deformity, and, increasingly, through modern surgical interventions designed and executed using medical imaging. As a result of such distortions, we now find many of the rules developed in the era of radiography and axial CT to not hold true in such circumstances. Radiologists must look for new ways in which to look for pathology so that it is correctly recognized and appropriately treated.
CT scanning is the dominant workhorse in basic anatomic imaging, resulting in decreased availability of radiographs for comparison. Three-dimensional reconstructions of CT images are increasingly important for evaluation of the aorta (Figure 34.4).

Figure 34.4 Axial images reveal enlargement of proximal descending thoracic aorta that then narrows with what may raise concern for coarctation of the aorta that would have a pressure gradient across the change in caliber or pseudocoarctation of the aorta that would not exhibit a pressure gradient or rib notching on radiographs. In this case, the three-dimensional image (right) reveals transection, or traumatic rupture of the aorta that is contained by adventitial tissue in a pseudoaneurysm extending inferiorly from the aortic arch.
34.3.1 Combining Modalities
Multimodality examinations are now possible on a single scanner. Positron emission tomography (PET) and attenuation correction CT were initially obtained separately, often limiting interpretation. As currently performed, PET/CT provides the ability to scan from head to toe with a radioisotope such as fluorodeoxyglucose to provide functional data with CT scan (anatomical) registration (Figure 34.5). This type of examination is more commonly used for diagnosis and follow-up of cancer, although high utilization of glucose is also a characteristic of inflammatory diseases. PET/MR scanners have also been introduced and are being used in progressively more applications, such as prostate cancer imaging.
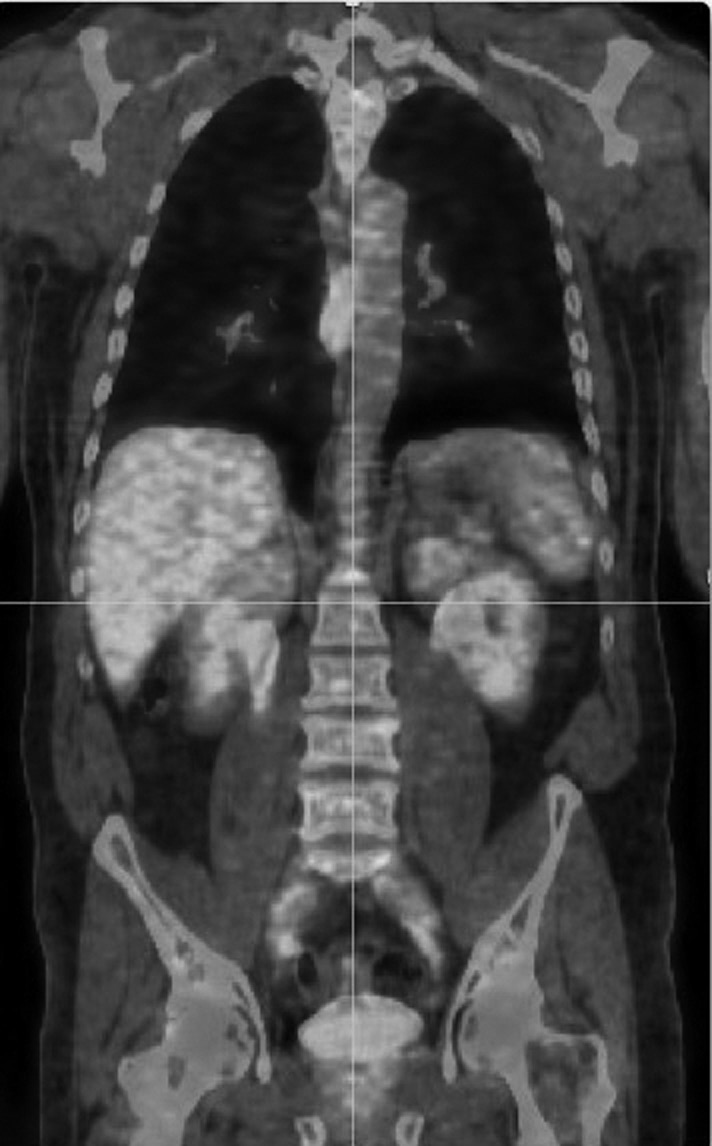
Figure 34.5 Fused coronal positron emission tomography/computed tomography image reveals abnormal mass to right of thoracic spine due to a squamous cell carcinoma of the esophagus and normal physiology throughout the rest of the image, including all of the abdominal organs.
MRI and CT scans are most frequently separate studies, each with thousands of individual images to be reviewed. Clinical decision making rests on combining the information available from these and other modalities, including mammography and ultrasonography, that often need to be considered together for proper interpretation, further increasing image data overload.
34.3.2 Image Data Overload
The first modality to experience image overload and impracticality of interpretation from hard-copy film was MRI, leading to interpretation on computer consoles that allowed radiologists to scroll through a stack of images and change the window and level of images while performing image interpretation. The recognition of this overload led to the performance of one of the first observer studies in which radiologists were asked to detect simulated lung nodules from CT images in two experimental conditions (Seltzer et al., 1995). Conventional single-detector spiral CT images were used to create both 10-mm images at 4-mm intervals for printing on 14 × 17-inch film and 10-mm images at 2-mm intervals displayed on a monitor using a supercomputer. Radiologists detected more nodules using cine display in which simulated small nodules in realistic locations would “pop out” when the image stack was put into motion.
This led to the change in viewing paradigm from tile to stack at an opportune time as the development of computer technology provided the opportunity to move from hard-copy film to soft-copy interpretation employing Picture Archiving and Communications Systems (PACS) as the primary source of images for interpretation in the radiology reading room. This also provided increasing ability to compare imaging across modalities as well as time.
Additional tools for image analysis have also been developed and in recent years are increasingly incorporated directly into the PACS workflow. Such tools are often underutilized in the clinical arena due to the time and effort with minimal improvement on the expertise of the radiologist as an observer. Furthermore, radiologists resist becoming the technologist creator of specialized reformatted images. In 2002, the Society for Computer Applications in Radiology’s Transforming the Image Interpretation Process (TRIP) initiative called for a new paradigm for medical image display (Jacobson et al., 2006). Since that clarion call, the primary change in image display has been to again multiply the number of images presented in a separate stack of thin sections and multiplanar reformatted images. Radiologists have increasingly chosen to look at specific stacks of images for specific information, rather than approaching each series of images for all possible findings.
An investigation of cine display with eye tracking identified two strategies for viewing stacked chest CT images (Drew et al., 2013). “Drillers” follow vessels up and down through the stack of images while “scanners” deal more completely with individual images (see Chapter 21). Unfortunately, radiologists fixate on only a small proportion of the CT image data. Image data overload is again in need of disruptive innovation in the conventional radiology image-viewing paradigm. The speed of computers and integration through cloud computing can do a better job of bringing tools to the radiologist without the radiologist going to a dedicated workstation.
One interesting approach to dealing with image data overload is currently in use for interpretation of colonography, whereby software reports to the radiologist what areas have been reviewed and points out which areas of the colon have not yet been studied. The US Preventive Services Task Force grade A recommendation for use of colonography every 5 years in place of colonoscopy every 10 years for colon cancer screening (US Preventive Services Task Force, 2016) has led to a significant increase in the number of screenings that require interpretation. Expertise in this realm has been investigated by tracking eye gaze, revealing differences between observers based upon experience (Mallet et al., 2014). Not unsurprisingly, inexperienced observers benefit more from computer assistance.
Expertise is not replaced by experience with virtual reality and computer games, although this likely contributes to the improvement in image interpretation by younger, less experienced observers when computer aid diagnostic tools are provided for their use. Ultimately, the time required for the use of computer-aided diagnosis results in discontinuing use as expertise is achieved. This type of experience offers insights that will eventually be incorporated into the design of future radiology training programs.
34.3.3 Integrating Clinical Information
Integration of guidelines and staging systems into radiology workstations has proceeded slowly, with clinical reporting of radiologic TNM classification of malignant tumors staging decreasing in clinical practice. It has become most difficult for the diagnostic radiologist to maintain current knowledge about all staging systems and drug effects on disease. Decision systems aids for medical imaging are not well integrated into contemporary PACS workstations, but current and pending implementation of regulations such as Medicare Access and CHIP Reauthorization Act (2015) makes integration a looming necessity.
On the other hand, contemporary radiology workstations now provide nearly instant access within the PACS environment to all of the patient’s clinical data within the electronic medical record. On one hand it is wonderful to have access to the clinical history and nonradiologic data that together maximize diagnosis and cost-effective patient care. Using notes from clinical colleagues, the radiologist can more than ever before perform complete history and physical examination functions with the view inside the body that exceeds the data available to prior generations of bedside physicians in every way possible. On the other hand, incorporating all of the data beyond medical imaging increases the burden on the radiologist beyond that of image overload alone.
34.3.4 Controlling Interruptions and Fatigue
Diversion of the radiologist’s attention has never been greater. The radiologist now gathers history from the electronic medical record and independently creates the finished radiology report while also viewing multiple images and creating specialized reformatted images. Managing interruptions, whether by phone or in-person visits from clinicians, interrupts work, increasing chances for errors. All of these systems have also allowed radiologists to interpret more cases during the work day (see Chapter 32). The unending work list deprives the radiologist of the satisfaction of completing work and does not provide the built-in breaks that existed when films had to be mounted and removed from alternators by support staff.
Related posts:
Stay updated, free articles. Join our Telegram channel

Full access? Get Clinical Tree


