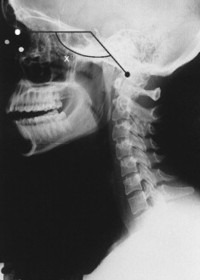
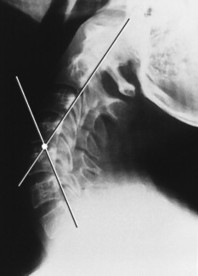
On the lateral skull or cervical projection, two lines are drawn. The first connects the frontal–nasal junction (nasion) to the center of the sella turcica. The second connects the anterior margin of the foramen magnum (basion) with the center of the sella turcica. The angle of intersection (x°) should not exceed 152 degrees, with a minimum value of 137 degrees (Fig. 4-1).
Abnormally high angle measurements indicate an elevation of the skull base in relation to the anterior portion of the skull. This occurs with basilar invagination/impression secondary to congenital bone deformity or acquired bone softening disease (e.g., Paget’s disease, fibrous dysplasia).
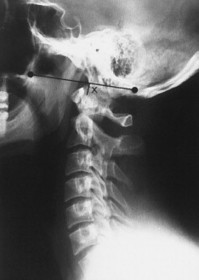
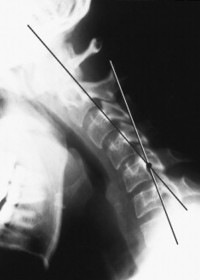
Chamberlain’s line
On the lateral skull or cervical projection a line is drawn from the posterior aspect of the hard palate to the posterior aspect of the foramen magnum (opisthion). The tip of the odontoid should not extend more than 7 mm above the line (x) (Fig. 4-2).
Elevation of the odontoid tip suggests basilar invaginationimpression or upward deformity of the skull base. This may occur secondary to congenital or acquired bone softening disorders (e.g., Paget’s disease, fibrous dysplasia).
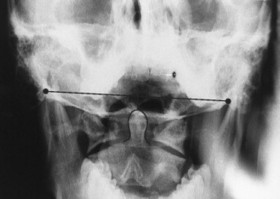
Digastric line
On the frontal skull or cervical projection a line is drawn connecting the right and left digastric grooves (just medial to the mastoid processes). The tip of the odontoid should not project above this line (Fig. 4-3).
Elevation of the odontoid tip suggests basilar impression or upward deformity of the skull base. This may occur secondary to congenital or acquired bone softening disorders (e.g., Paget’s disease, fibrous dysplasia).
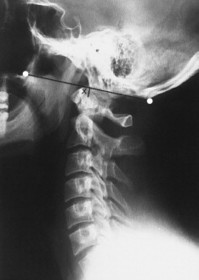
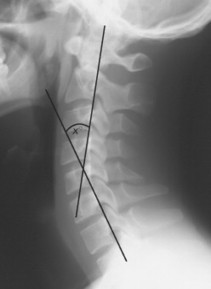
McGregor’s line
On the lateral skull or cervical projection a line is drawn from the posterior aspect of the hard palate to the inferior surface of the occiput. The tip of the odontoid should be below the line (x) and is always abnormal if it extends more than 8 mm above the line in men and 10 mm in women (Fig. 4-4).
Elevation of the odontoid tip suggests basilar impression or upward deformity of the skull base. This may occur secondary to congenital or acquired bone softening disorders (e.g., Paget’s disease, fibrous dysplasia). McGregor’s method is considered the best method to assess for basilar impression.
McRae’s line
On the lateral skull or cervical projection a line is drawn between the anterior (basion) and posterior (opisthion) margin of the foramen magnum. The posterior portion of the occiput should be below this line. In addition, a vertical line extended from the tip of the odontoid process should intersect in the anterior fourth of the foramen magnum line (Fig. 4-5).
If the posterior occiput is convex upward or extends above the foramen magnum line, an upward deformity of the skull surrounding the foramen magnum is present. This occurs with basilar impression secondary to congenital or acquired bone softening disorders (e.g., Paget’s disease, fibrous dysplasia). If the tip of the odontoid is found posterior to the anterior fourth of the foramen magnum line, fracture or dislocation is suspected.
FIG. 4-1
FIG. 4-2
FIG. 4-3
FIG. 4-4
FIG. 4-5
FIG. 4-6
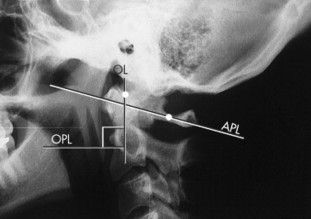
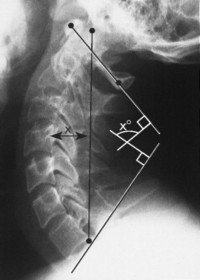
Occipitoatlantal alignment
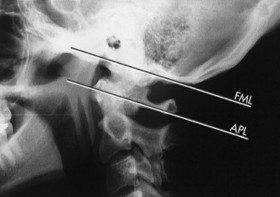
On the lateral skull or cervical projection, two lines are constructed: a foramen magnum line (FML) is drawn along the inferior margin of the occiput, and an atlas plane line (APL) is drawn through the center of the anterior tubercle and the narrowest portion of the posterior arch of atlas. The FML and APL should be parallel (Fig. 4-6).
Divergence of the FML and APL anteriorly suggests anterior-superior malposition of the occiput. Divergence of the lines posteriorly suggests posterior-superior malposition of the occiput.
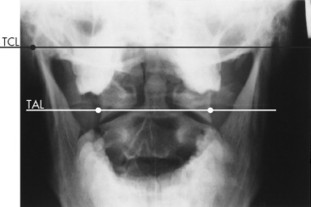
On the frontal open-mouth cervical projection, two lines are constructed: a transverse condylar line (TCL) is drawn connecting the grooves on the medial aspect of the mastoid processes bilaterally, and a transverse atlas line (TAL) is drawn connecting the lower junctions of the transverse processes and the lateral masses. The TCL and TAL should be parallel (Fig. 4-7).
Divergence of the TCL and TAL to the right suggests right occiput laterality. Divergence of the TCL and TAL to the left suggests left occiput laterality.
On the frontal open-mouth cervical projection, atlas rotational malposition is suggested by asymmetry in the width of the lateral masses. Occiput rotation is assumed to occur opposite atlas rotation.
The lateral mass with the wider measure is the side with anterior rotation of the atlas and posterior rotation of the occiput. Often the medial margin of the anteriorly rotated lateral mass appears more radiopaque.
Sella turcica size
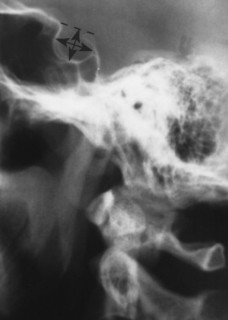
In the lateral skull projection (40 inches focal film distance [FFD]), the greatest horizontal dimension of the sella turcica should not exceed 16 mm, and the depth should not exceed 12 mm (Fig. 4-8).
An enlarged sella turcica may represent a normal variant or suggest the presence of a space-occupying lesion or condition (e.g., pituitary tumor, carotid aneurysm, and empty sella syndrome)
TABLE 4-2 Spine Measures
Description
Significance
Atlantoaxial “overhang”sign
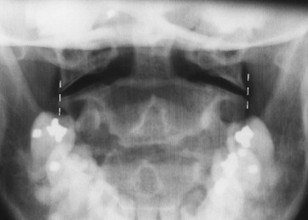
On the anteroposterior open-mouth projection the lateral margin of the lateral masses of atlas should not appear more lateral than the superior articular processes of the axis (Fig. 4-9).
Lateral displacement suggests fracture (atlas or odontoid process) or dislocation. A mild degree of “overhanging” of the atlas may be a normal variant in children.
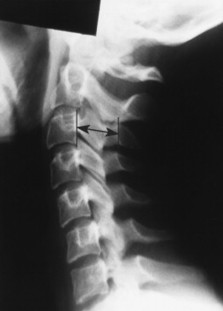
Atlantodental interval (ADI)
On the lateral cervical projection the distance (x) between the posterior surface of the anterior tubercle of the atlas and the anterior surface of the odontoid process of the axis should not exceed 3 mm in adults and 5 mm in children. The flexion lateral projection places the most stress on the atlantoaxial joint and would be most likely to reveal an abnormality. The ADI may appear V-shaped. In such cases the smallest portion of the joint space should be measured to limit false-positives (Fig. 4-10).
An enlarged atlantodental interval may result from congenital absence or weakness of the transverse atlantal ligament (e.g., Down syndrome, Morquio’s syndrome, Larsen syndrome), trauma, infection, or an inflammatory arthritide (e.g., rheumatoid arthritis, ankylosing spondylitis).
Atlas alignment
On the lateral cervical projection, two lines are constructed. An atlas plane line (APL) is drawn through the anterior tubercle and the narrowest portion of the posterior arch. Next an odontoid line (OL) is drawn to bisect the odontoid process. It is thought a line drawn perpendicular to the odontoid line (odontoid perpendicular line [OPL]) should be parallel to the APL (Fig. 4-11).
Anterior divergence of the lines suggests an anterior-superior malposition of the atlas in relation to the axis. Anterior convergence of the lines suggests an anterior-inferior malposition of the atlas.
FIG. 4-7
FIG. 4-8
FIG. 4-9
FIG. 4-10
FIG. 4-11
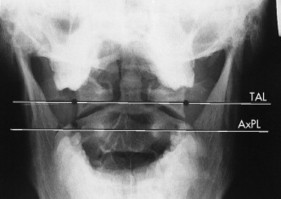
On the frontal open-mouth cervical projection, two lines are constructed: a transverse atlas line (TAL) is drawn connecting the lower junction of the transverse processes and the lateral masses, and an axis plane line (AxPL) is drawn between the lamina–pedicle junctions bilaterally. The TAL and AxPL should be parallel (Fig. 4-12).
Right atlas lateral malposition is suggested if the TAL and AxPL diverge to the right. Left atlas lateral malposition is suggested if the TAL and AxPL diverge to the left.
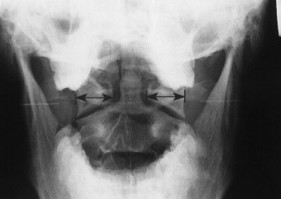
On the frontal open-mouth cervical projection, atlas rotational malposition is suggested by asymmetry in the width of the lateral masses (Fig. 4-13).
The lateral mass with the wider measure is the side with anterior rotation. Often the medial margin of the anteriorly rotated lateral mass appears more radiopaque.
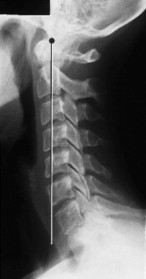
Cervical gravity line
In the lateral cervical projection, a vertical line drawn from the tip of the odontoid should intersect the seventh cervical vertebral body (Fig. 4-14).
An anterior weight-bearing posture is noted if the line is found anterior to C7 (as shown in figure), and a posterior weight-bearing posture is noted if the line is behind C7.
Cervical Jackson’s stress lines
On the lateral cervical flexion and extension projections, lines are drawn along the posterior aspect of C2 and C7. The posterior body lines should intersect the C5-C6 intervertebral disc space on the flexion film and C4-C5 intervertebral disc space on the extension film (Figs. 4-15 and 4-16).
The intersection of the lines is postulated to occur at the levels of greatest stress. Degeneration, muscle spasm, aberrant intersegmental mechanics, and other conditions may alter the levels of intersection.
Cervical lordosis
Harrison posterior tangent methods
On the lateral cervical projection, lines are drawn along the posterior body of C2 and a second line is drawn along the posterior body of C7. The superior or inferior angle of intersection (x°) is measured as the cervical lordosis. Another application of the posterior tangent lines employs a comparison of lines of adjacent segments, yielding a measure of relative rotational angles. Normative values for such are found in the related literature (Fig. 4-17).
The average value of the cervical curvature from C2 to C7 using these methods is 34 degrees with a standard deviation of 9 degrees as reported by Harrison and others (1996). This method can be extended to the thoracic or lumbar regions.
Visual assessment
On the lateral cervical projection a subjective appraisal of the cervical curve is made. Well-maintained anterior convexity is lordosis, exaggerated anterior convexity is hyperlordosis, slight anterior convexity is hypolordosis, lack of curvature is alordotic, and posterior convexity is kyphosis.
Altered cervical lordosis may be caused by factors such as trauma, degeneration, muscle spasm, and aberrant intersegmental mechanics.
Depth method
On the lateral cervical projection a line is drawn from the tip of the odontoid process to the posterior surface of C7. A horizontal measure is taken from the vertical line to the posterior surface of the C4 body (x°). The average depth is 12 mm. (Fig. 4-18)
Negative values indicate kyphosis, and large values indicate hyperlordosis. The depth method provides a more accurate assessment of cervical lordosis than the angle method. Lower measurements may result from factors such as trauma, degeneration, muscle spasm, and aberrant intersegmental mechanics.
Angle of curve
On the lateral cervical projection a line is drawn connecting the anterior and posterior tubercles of the atlas, and a second line is drawn along the inferior endplate of C7. Perpendicular lines are drawn from the atlas and C7 lines, and their angle of intersection is recorded as the cervical lordosis (x°). The average value is 40 degrees, although a variety of average values has been reported in the literature (Fig. 4-18).
Negative values indicate kyphosis, and large values indicate hyperlordosis. This method of measuring cervical lordosis is more common but less accurate than the depth method. Because the measurements depend only on C1 and C7, a kyphotic curve with compensatory extension of C1 has the false measurement of a lordotic curve. Reduced cervical curvature may be caused by factors such as trauma, degeneration, muscle spasm, and aberrant intersegmental mechanics.
FIG. 4-12
FIG. 4-13
FIG. 4-14
FIG. 4-15
FIG. 4-16
FIG. 4-17
FIG. 4-18
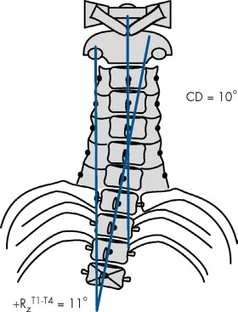
Harrison modified Risser-Ferguson method (cervical spine)
On the anteroposterior (AP) cervical radiograph, the narrow waists of the articular pillars are used to find the center of the vertebrae. Second, the spinous–lamina junctions are identified. The centrad for each vertebra is found by bisecting these two points on the segment. Next best-fit lines are constructed from C2 to the lowest visible thoracic vertebra. The angle of intersection of the best-fit line of the upper cervical vertebrae and the best-fit line of the lower cervical and upper thoracic vertebrae is measured as the cervical dorsal (CD) angle. In addition, the angle created by the best-fit line of the lower cervical and upper thoracic vertebrae and a true vertical line create a lateral flexion angle termed RT1-T4Z. These lines and angles have been studied for reliability, yielding intraclass correlations in the good-to-excellent range with low mean absolute value of observer differences (see Harrison, 2002) (Fig. 4-19).
The Harrison modified Riser-Ferguson method for measurement of the AP cervical regions is based on the location of the two-dimensional center of mass of each vertebra. The resultant CD angle provides information of spinal distortion in a sagittal plane. The benefit of this method is that it accounts for both axial rotation and lateral bending displacements of vertebra. It can be applied to the cervical, thoracic, or lumbar region. The RT1-T4Z angle is a measurement of lateral bending of the upper dorsal region.
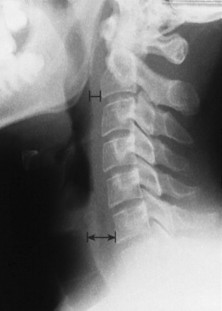
Cervical prevertebral soft tissues
On the lateral cervical projection the distance between the anterior aspect of C2 and the pharyngeal air shadow should not exceed 5 mm, and the distance between C6 and the tracheal air shadow should not exceed 20 mm (Fig. 4-20).
Posttraumatic hematoma, tumor, abscess, or other space-occupying lesion of the prevertebral space may distend these measures beyond their normal values.
Cervical spinal canal
On the lateral cervical projection the horizontal width of the spinal canal between the posterior surface of the vertebral body (or odontoid) and the spinolaminar line should be at least 16 mm at C1, 14 mm at C2, 13 mm at C3, and 12 mm at C4-C7. (These measurements are for adults.) (Fig. 4-21)
Sagittal canal widths less than these values indicate spinal canal stenosis. Spinal stenosis is more accurately assessed on the axial images provided by magnetic resonance imaging (MRI) or computed tomography (CT).
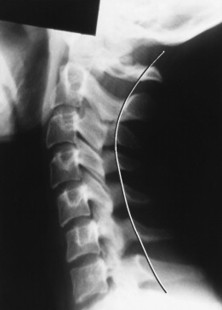
Cervical spinolaminar line
On the lateral cervical projection a curvilinear line is drawn along the spinous process and lamina junctions. The curve should have a smooth contour without segmental disruption (Fig. 4-22).
Disruption is caused by segmental anterolisthesis or retrolisthesis. Disruptions at multiple consecutive levels may be caused by normal flexion and extension patterns. Care should be taken not to interpret this as abnormal.
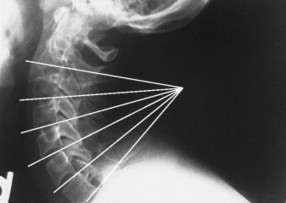
Cervical, thoracic, and lumbar endplate lines
On the lateral cervical projection, lines are drawn along the inferior endplate of the C2-T1 vertebrae and extended posteriorly to the cervical spine. The cervical endplate lines should all intersect at a common point located posterior to the spine (Fig. 4-23).
Lack of convergence suggests alterations in the normal lordotic cervical spine curve or intersegmental malpositions. Lines that cross closely to the spine suggest extension malposition of the superior segment. Lines that diverge sharply suggest flexion malposition of the superior segment.
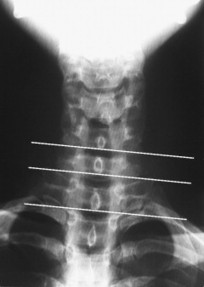
On the frontal cervical, thoracic, and lumbar projections, lines are drawn to approximate the inferior vertebral endplates. The lines at adjacent levels should be parallel (Fig. 4-24).
Divergence of the endplate lines drawn on the frontal projection suggests lateral flexion malposition opposite the side of divergence.
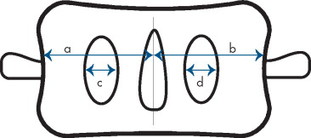
Cervical, thoracic, and lumbar vertebral rotation
Body width method
On the frontal cervical, thoracic, and lumbar projections, the distance from the lateral margins of the vertebral bodies to the origin of the spinous process (a and b) should be equal bilaterally (Fig. 4-25).
If the distances from the base of the spinous process to the lateral margins of the vertebra are not equal, vertebral rotation is suggested, with spinous process deviation to the side of the smaller distance. A better analysis of vertebral rotation would probably incorporate the rotation of the vertebra above and below the segment in question. For instance, if a vertebra demonstrates 5 mm rotation to the right, and the segment below demonstrates 7 mm rotation to the right, the first segment demonstrates 2 mm of relative rotation to the left. Analysis of relative rotation attempts to limit spurious measurements of vertebral rotation caused by errors in patient positioning.
FIG. 4-19
FIG. 4-20
FIG. 4-21
FIG. 4-22
FIG. 4-23
FIG. 4-24
FIG. 4-25
FIG. 4-26
FIG. 4-27
Pedicle method
On the frontal cervical, thoracic, and lumbar projections the appearance of the pedicle shadows may suggest vertebral rotation. It is expected that the pedicle shadows demonstrate bilateral symmetry (c and d).
If the width of a pedicle shadow appears narrower than the contralateral pedicle shadow, it suggests (1) segmental rotation with the spinous process deviated to the side of the narrower pedicle shadow, and (2) posterior vertebral body rotation to the side of the wider pedicle shadow.
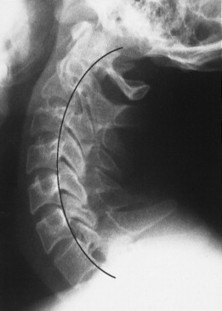
Cervical, thoracic, and lumbar vertebral sagittal alignment
George’s line
On the lateral cervical, thoracic, and lumbar projections, a curvilinear line is drawn along the posterior surfaces of the vertebral bodies. The curve should maintain a smooth contour throughout the spinal region without segmental disruption (Fig. 4-26).
Disruption is caused by segmental anterolisthesis or retrolisthesis. Disruptions at multiple consecutive levels may be caused by normal flexion and extension patterns. Care should be taken not to interpret this as abnormal. However, the adjacent posterior body lines should not demonstrate more than 3.5 mm of net relative translation in a comparison of the flexion and extension radiographs.
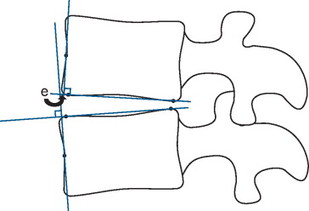
Barge’s “e”space
On the lateral lumbar projection, lines are drawn along the superior and inferior vertebral endplates of each segment. Lines perpendicular to each endplate line are then drawn and extended across the intervertebral disc space. The distance between the perpendicular lines at the inferior endplate of each lumbar segment is measured as the “e” space. The space should not exceed 3 mm (Fig. 4-27).
A larger Barge’s “e” space suggests retrolisthesis of the segment above. Negative values indicate anterolisthesis. A more complete assessment would include the “e” space measurements at adjacent levels to determine relative retrolisthesis or anterolisthesis, thereby reducing spurious measurements that are caused by patient posture.
Visual method
Segmental retrolisthesis may be indicated by the presence of the following:
• The lowest segment of a “stack” of three or more vertebrae that do not contribute to a sagittal curvature may be posterior
• The lowest involved segment of three or more consecutive segments that appear to be flexed or extended during neutral patient posture may be posterior
• Segmental rotation in a coronal plane that produces an hourglass appearance
• Narrowed sagittal diameter of the intervertebral foramen
• Visual disparity of segmental alignment when comparing the margins of adjacent vertebrae
Retrolisthesis of L5 is often seen as a normal variant, accompanying short pedicles.
Only gold members can continue reading. Log In or Register to continue