Abstract
This chapter outlines a practical approach for achieving a standard, high-quality breast MRI examination. Excellent image resolution is a prerequisite for accurate diagnosis. Key components of a high-quality study include a protocol that balances spatial and temporal resolution, achieves homogeneous fat suppression, minimizes artifacts and is consistently applied. Various magnet platforms and breast coils are available for conducting breast MR examinations. Therefore, each facility must tailor their approach to their breast MRI diagnostic protocol accordingly. Shown in this chapter are examples of imaging protocols that include a T2-weighted sequence, a non-fat suppressed T1-weighted sequence and a multi-phase T1-weighted sequence. It is important to recognize that a standard dynamic contrast-enhanced (DCE-MRI) series should be as short as possible and therefore reformatted images (obtained from the initial acquisition plane) rather than multiple acquisitions (obtained in planes other than the initial plane) should be used. A review of patient administration of Gadolinium-based contrast agents and Gadolinium retention in tissue is provided. Also included is a discussion of computer-aided diagnostic (CAD) systems that can improve interpretation and workflow times by organizing and presenting large image datasets and by analyzing lesion kinetic characteristics. Protocols identified as “ultra-fast” (UF)” or “accelerated” imaging are shown and are now being used in clinical practice. The remainder of the chapter concentrates on the many technical challenges that may occur during the course of achieving optimal DCE-MRI studies, including the identification and review of imaging artifacts that may hamper image quality. The chapter concludes with a discussion of breast MRI accreditation requirements.
5 Diagnostic MRI: Imaging Protocols and Technical Considerations
5.1 Introduction
The imaging protocol for a dynamic contrast-enhanced magnetic resonance imaging (DCE-MRI) study is demanding and should be carefully considered, a practical approach requiring a simple and relatively short (< 20 minutes) standardized acquisition is usually sufficient. There is no single protocol used in clinical practice today, and a variety of acquisitions are employed. Technical requirements for a DCE-MRI acquisition include a magnetic field strength greater than or equal to 1.5 T, a dedicated breast coil, through-plane slice thickness less than or equal to 3 mm, and administration of a gadolinium-based contrast agent (GBCA). Protocols are aimed to balance spatial and temporal resolution in order to exploit maximum sensitivity and specificity, providing analysis of both morphologic and kinetic lesion features. Studies can be streamlined, by adjusting the T2-weighted (T2w) precontrast and T1w dynamic series so that multiplanar reformatting, obtained at or near isotropic resolution, can replace the need for multiple additional series in various planes. A general approach for a standard DCE-MRI study (including a T2w series) should be to provide a protocol that is completed within 15 to 20 minutes, attains image consistency, minimizes extraneous artifacts, and addresses any other technical challenges. Special acquisitions such as diffusion-weighted imaging (DWI) may be added to the basic protocol as needed.
5.2 Current Standard DCE-MRI Protocols
The American College of Radiology (ACR) and the European Society of Breast Imaging (EUSOBI) have set minimum standards for breast MRI acquisition, these guidelines allowing flexibility regarding acquisition parameters and equipment specification. Essential equipment requirements include access to a high-homogeneity high magnetic field MRI platform (1.5 T or higher), a dedicated bilateral breast receive or transmit-receive coil, and strong magnetic field gradients with short gradient rise times.
5.2.1 Acquisition Plane
Selection of the primary imaging acquisition plane is critical when choosing a breast DCE-MRI protocol and may be the only acquired imaging plane needed. High-resolution multiplanar reformatted images can be reconstructed from the acquired plane, eliminating the need for additional scans and shortening the scanning time. Axial and sagittal acquisition planes are generally preferred to the coronal plane, given that the anatomic segments of the breast are oriented from the nipple to the chest wall and are not aligned segmentally in the coronal plane. Selection of the acquisition plane is particularly important when assessing DCIS, because axial and sagittal imaging may demonstrate linear or segmental enhancement to advantage, whereas coronal imaging may only show cross-section of ducts. Selection of the field-of-view (FOV) depends on the primary acquisition plane and in general should be chosen to be as small as possible, in order to maximize in-plane spatial resolution while also including all breast tissue and axillary regions. Axial acquisition is the most commonly used primary plane in the United States, providing easy bilateral side-by-side assessment of enhancement at identical postcontrast injection time points.
5.2.2 Imaging Protocol
The current standard-of-care breast DCE-MRI protocol consists of a precontrast T2w acquisition followed by a dynamic sequence encompassing a series of T1w acquisitions obtained before and for approximately 5 to 7 minutes after the intravenous administration of a GBCA. In most practices, temporal resolution has remained between 60 and 120 seconds, with a maximum temporal resolution of 240 seconds allowed in the Breast Magnetic Resonance Imaging Accreditation Program. 1 Standard diagnostic imaging protocols capture diffusion rather than perfusion of contrast material into enhancing lesions. The ACR Accreditation Program requires both a T2w (bright fluid) series and a multiphase T1w dynamic series. The dynamic series must include a precontrast T1w series, an early-phase (first) postcontrast T1w series to be completed within 4 minutes of contrast injection, and a late-phase T1w series with features matching the precontrast T1w series.
T2-Weighted Sequence
Inclusion of a precontrast T2w sequence in a breast DCE-MRI protocol allows improved characterization of enhancing lesions visible on the T1w postcontrast sequences. Additionally, the T2w bright fluid sequence identifies fluid collections, breast edema, and benign findings such as lymph nodes, simple cysts, some fibroadenomata, and posttreatment changes. T2w sequences are typically acquired using spin echo (SE), fast spin echo (FSE), or short time inversion recovery (STIR) technique with an inversion time selected to null fat. The long repetition times required for fat-suppressed T2w result in longer scanning times, and the T2w series is usually obtained as a multislice two-dimensional acquisition. Using this protocol, the acquired T2w images are unable to match the higher spatial resolution of the T1w DCE images within a reasonable scan time, thus direct slice-by-slice comparison of the T2w and T1w images is not possible. Some practices choose to acquire T2w images without fat suppression allowing three-dimensional (3D) imaging matching of the spatial resolution of the T2w series with the T1w DCE series. This non–fat-suppressed T2w sequence also allows an overview of breast anatomy, assessment of the amount of fibroglandular tissue (FGT), and identification of fat-containing lesions.
Non–Fat-Suppressed T1-Weighted Sequence
If a fat-suppressed T2w sequence is used, then an additional T1w sequence without fat suppression is recommended prior to acquiring the multiphase T1w sequence. The T1w non–fat-suppressed sequence can provide an overview of anatomy, assess the amount of FGT, and identify fat-containing lesions. This protocol should provide similar parameters and spatial resolution to the subsequent fat-suppressed DCE series. It should be noted that if a non–fat-suppressed T2w series is used in the breast MR protocol, then this sequence is not necessary.
Multiphase T1-Weighted Sequence (DCE-MRI)
This key sequence is used for lesion detection, characterization, and evaluation of lesion contrast enhancement over time. Identical scan parameters must be used for the pre- and postcontrast multiphase T1w series sequences, so that image registration can be performed. A 3D gradient echo (GRE) pulse sequence with a short time of repetition (TR) is commonly used for multiphase T1w imaging. It is also recommended that in order to avoid any confounding T2 contrast, the GRE pulse sequence should be spoiled. 2 Precontrast images are subtracted from postcontrast images and signal differences between the sequences can be directly compared. Most practices in the United States use fat suppression in the T1w dynamic series, and subtraction images are helpful for highlighting signal from contrast agents. If the dynamic series is performed without fat suppression, then subtraction images are essential for elimination of the fat signal. Knowledge of the k-space sampling pattern is helpful, most Cartesian sequences use rectilinear sampling with the center of the acquisition capturing the high-frequency data providing optimal contrast resolution. When setting up a breast MRI protocol, there is no recommended consensus as to the number of postcontrast acquisitions within a DCE series, or requirements for the total length of the acquisition time. A minimum of at least two postcontrast sequences are needed to provide a basic assessment of kinetic features, and these should include measures of the initial slope of enhancement and the delayed phase.
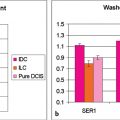
Measures of the rate of uptake and washout of contrast media within breast lesions contain diagnostically useful information, and microvascular density is a key factor in determining the initial rate of contrast media uptake and the heterogeneity of enhancement within tumors. 3 The shape of a signal intensity versus time curve (TIC) (or signal time course or kinetic curve) has shown to be useful in the classification of enhancing lesions. 4 Lesions with a fast uptake of contrast followed by a washout phase are more likely to be malignant, while lesions with a slow but persistent uptake are more likely benign. Discrete thresholds are used to classify two parts of the kinetic curve: the initial uptake and the delayed phase (Fig. 5‑1).

5.3 Contrast Agents
Although noncontrast MRI techniques are currently under investigation, clinical breast MR examinations currently require the administration of a GBCA. Gadolinium is paramagnetic, shortens the T1 and T2 relaxation times of nearby protons and in most clinical DCE examinations, it is the T1 shortening effect of a GBCA that results in increased signal intensity. Standard DCE-MRI examinations involve injection of a GBCA and subsequent analysis of the kinetic characteristics of any enhancing lesion. Contrast agents should be injected intravenously, ideally using a power injector, and administered as a bolus with a standard dose of 0.1 mmol/kg followed by a saline flush of at least 20 mL. This method ensures rapid arrival at the intravascular space allowing for consistency in contrast enhancement timing across examinations. The paramagnetic properties of chelated gadolinium result in decreased T1, T2, and T2* relaxation times. 5 Acquisitions geared toward fluid detection, such as the T2w series, should be acquired prior to contrast administration. DCE-MRI is performed with T1w because the decrease in relaxation following injection of a GBCA is greatest for T1w sequences. The effect of gadolinium shortening of the T1 (the spin–lattice relaxation time) in its microenvironment results in increased signal in a T1w acquisition. Lesion conspicuity therefore increases after the injection of a GBCA and is highlighted on subtraction (postcontrast minus baseline) images. Relaxivity is the property that is most closely related to differences in signal intensity between enhancing lesions and surrounding parenchyma. In clinical breast imaging, the shorter the T1 (in a T1w dynamic sequence), the larger the R1 and the brighter the enhancement and this depends, in part, on the chemical structure of a particular GBCA. A high relaxivity GBCA indicates a greater uptake of contrast in enhancing tissues per unit concentration of contrast agent. The term relaxivity (rl) refers to the change in relaxation rate (R1) per unit concentration of contrast agent describing the effect of a GBCA on T1 and T2 per molar concentration of contrast agent. Regions or lesions with increased blood flow and permeability, such as cancers, will accumulate contrast media to a greater extent than the surrounding tissue.
5.3.1 Deposition of Gadolinium in Tissue
It is well known that not all gadolinium chelates are entirely stable in vivo. There are two structurally distinct categories of commercially available GBCAs: linear and macrocyclic. The structure of a linear GBCA provides a polyamino-carboxyl acid backbone wrapping around the gadolinium ion which is incompletely enclosed, whereas in the macrocyclic structure, the gadolinium ion is “caged” in the ligand. Although patients with normal renal function clear almost all gadolinium from the circulation within a few hours by renal excretion, some free gadolinium may disperse into tissues. Intracranial gadolinium retention has been reported recently showing that trace amounts of gadolinium accumulation, as evidenced by concomitant T1 shortening on MRI, are present in the brains of patients who have received multiple doses of GBCA. 7 , 8 This effect is seen in patients without renal or hepatic dysfunction and is predominantly found in the globus pallidus, thalamus, pons, and dentate nucleus. 9 The magnitude of the effect is proportional to the cumulative lifetime patient dose. Some research suggests that this phenomenon occurs more commonly when linear agents with weaker chemical binding to gadolinium are administered, compared to the stronger chemical binding of macrocyclic agents. 10 Visible intracranial changes on T1w images may be present after only four exposures of a GBCA, and these findings often remain for years after the MR studies took place. In 2015, the U.S. Food and Drug Administration (FDA) instituted a review of gadolinium contrast agents to determine whether a safety risk to patients exists. On March 10, 2017, the Pharmacovigilance Risk Assessment Committee (PRAC) of the European Medicines Agency (EMA) formally submitted its recommendation to suspend use of four linear GBCAs due to the potential risk of gadolinium accumulation within humans. 11 The PRAC noted that no clinical diseases or even symptoms have been reported in connection with gadolinium deposition, but the committee decided on a “precautionary approach,” noting the paucity of data as well as concern regarding gadolinium’s past history of association with nephrogenic systemic fibrosis (NSF) in patients with kidney impairment. A response to the European PRAC recommendations was published by the ACR on April 4, 2017. This report concluded that “after extensive review of the PRAC position and voluminous other materials, the ACR Committee on Drugs and Contrast Media disagrees with the PRAC recommendation.” The ACR report concluded that there is abundant evidence that the amount of gadolinium deposited in tissues after a single GBCA dose is incredibly small and found no compelling evidence that any GBCA (including linear agents) pose a safety risk. The ACR additionally endorsed the need for additional research efforts to be directed toward a greater understanding of the mechanisms, cellular effects, and clinical consequences of gadolinium tissue deposition. 12 On September 8, 2017, the Medical Imaging Drugs Advisory Committee (MIDAC) of the U.S. FDA voted to recommend the addition of a warning to labels of GBCAs used during MRI. The new labels will warn that gadolinium may be retained in various organs, including the brain; after use of these agents, linear GBCAs exhibit a greater risk than macrocyclic agents. The warning will also note a greater risk in specific patient populations that include the fetus and children and patients who receive large cumulative doses of GBCAs, such as women undergoing annual GBCA-enhanced MRI because of high risk for breast cancer. At the present time however, although there is clear evidence that residual amounts of gadolinium may be retained in the brain and other parts of the body after administration of GBCA for MRI examinations, there is no definitive evidence that residual gadolinium is associated with adverse health effects. Ongoing research on this topic is underway.
Computer-Aided Analysis
Standard pharmacokinetic models that evaluate lesion enhancement kinetics attempt to replicate the physiology of MRI contrast agent distribution in relationship to normal breast tissue, various parameters describing lesion contrast delivery, accumulation, and washout. Peak lesion enhancement relative to background parenchymal enhancement (BPE) occurs at 1 to 2 minutes after contrast injection for most mass lesions and 2 to 3 minutes after injection for nonmass lesions. 13 Maximum contrast weighting timing of 3D GRE pulse sequences occurs about halfway into the scan for most MRI systems, and absent a time gap between the end of injection and the start of imaging, a postcontrast series of 90-second duration will deliver peak contrast weighting at about 45 seconds from the start of the series. Computer-aided diagnostic (CAD) systems can improve interpretation and workflow times by organizing and presenting large image datasets and by analyzing lesion kinetic characteristics. These systems display color overlays on voxels within enhancing lesions, thereby, demonstrating the kinetics of the delayed phase of lesion enhancement as washout, plateau, or persistent, and the initial rise as slow, medium, or rapid. Implementation of time intensity curves and angiomaps allows a convenient and efficient way for radiologists to assess kinetic enhancement.
A combined assessment of both lesion morphology and kinetics is necessary for diagnosis. MR interpretation may be affected by the variable enhancement of normal tissue (BPE), which usually enhances slowly, generating a persistent kinetic curve. The hormonal response of breast tissue in premenopausal women varies during the menstrual cycle. Marked BPE can limit the sensitivity of the examination, 14 , 15 and differentiation of enhancing abnormalities from BPE may present a diagnostic challenge. 16 For this reason, it is recommended that screening of premenopausal women should be scheduled preferentially during the second week of the menstrual cycle avoiding week 4 if at all possible. For women undergoing diagnostic applications, including assessment of malignant disease extent, a delay in diagnosis in order to accommodate menstrual cycle scheduling is generally not advisable.
5.4 University of Chicago Protocol
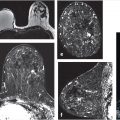
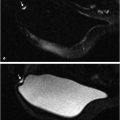
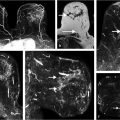
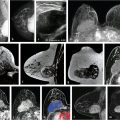
The current routine diagnostic breast MRI protocol at University of Chicago (UC), at field strengths both 1.5 and 3 T, includes a T2w non–fat-suppressed axial sequence followed by a T1w fat-suppressed axial dynamic series, with images acquired before and after intravenous administration of contrast media. The images shown in this book were almost all obtained on a 3-T magnet that was installed in 2010. Although images obtained at both field strengths can provide excellent diagnostic quality, improved contrast and spatial resolution at 3 T reflect the higher signal-to-noise ratio (SNR) per voxel as shown by comparison images of the same lesion obtained at both 1.5 and 3 T (Fig. 5‑2, Fig. 5‑3). The UC protocol at 3 T includes five postcontrast acquisitions at a temporal resolution of approximately 70 seconds and spatial resolution of 0.8 × 0.8 × 0.8 cm, obtained for both the T2w and the T1w series. The images from both acquired series are isotropic and are matched spatially, thus allowing multiplanar formatting of both the T2w and the T1w sequences at identical spatial resolution. These protocols both at 1.5 and 3 T are shown in Table 5‑1and Table 5‑2, respectively. Examples of a benign and a malignant lesion obtained with this protocol at 3 T are shown (Fig. 5‑4, Fig. 5‑5).


Parameters | VISTA | DCE-MRI |
Geometry | 3D axial | 3D axial |
FOV (mm) | 320–400 | 320–400 |
Spatial resolution/interpolated (mm) | 0.8/0.8 | 0.8/0.7 |
Slice thickness/interpolated (mm) | 2/1 | 2/1 |
Number of slices | 200 | 175 |
Slice oversample | Default | 1 |
Slice gap (mm) | N/A | N/A |
SENSE acceleration | 3 × 2 | 2.5 × 2 |
TR (ms) | 2,000 | 5.5 |
TE (ms) | 368 | 2.7 |
Flip angle (deg) | 90 | 12 |
Fast imaging mode | TSE | TFE |
Fast imaging factor | 120 | 44 |
Fat suppression | None | SPAIR |
Partial Fourier imaging | No | No |
k-space sampling | Cartesian | Cartesian |
Number of averages | 1 | 1 |
Duration (m:s) | 2:32 | 5:24 |
Temporal resolution (m:s) | N/A | 0:54 |
b values (s/mm2) | N/A | N/A |
Abbreviations: DCE-MRI, dynamic contrast-enhanced magnetic resonance imaging; FOV, field-of-view; SPAIR, spectral attenuated inversion recovery; TE, echo time; TR, time of repetition; TFE, turbo fast echo; TSE, turbo spin echo. Note: Parameters for VISTA, DCE-MRI are standard clinical parameters, so there is no special consideration to their selection beyond optimization for image quality in given time. VISTA (non–fat-suppressed T2w). DCE-MRI (fat-suppressed T1w): precontrast mask, followed by standard DCE-MRI for two postcontrast acquisitions. | ||
Parameters: | VISTA | DCE-MRI |
Geometry | 3D axial | 3D axial |
FOV (mm) | 320–400 | 320–400 |
Spatial resolution/interpolated (mm) | 0.8/0.65 | 0.8/0.6 |
Slice thickness/interpolated (mm) | 1.6/0.8 | 1.6/0.8 |
Number of slices | 250 | 250 |
Slice oversample | 1.33 | 1 |
Slice gap (mm) | N/A | N/A |
SENSE acceleration | 3 × 2 | 2.5 × 2 |
TR (ms) | 2,000 | 4.8 |
TE (ms) | 221 | 2.4 |
Flip angle (deg) | 90 | 10 |
Fast imaging mode | TSE | TFE |
Fast imaging factor | 120 | 27 |
Fat suppression | None | SPAIR |
Partial Fourier imaging | No | 0.85 × 1 |
k-space sampling | Cartesian | Cartesian |
Number of averages | 1 | 1 |
Duration (m:s) | 3:44 | 2:13 |
Temporal resolution (m:s) | N/A | 1:02 |
b values (s/mm2) | N/A | N/A |
Abbreviations: DCE-MRI, dynamic contrast-enhanced magnetic resonance imaging; FOV, field-of-view; SPAIR, spectral attenuated inversion recovery; TE, echo time; TFE, turbo fast echo; TR, time of repetition; TSE, turbo spin echo. Note: Parameters for VISTA and DCE-MRI are standard clinical parameters, so there is no special consideration to their selection beyond optimization. VISTA (non–fat-suppressed T2w). DCE-MRI (fat-suppressed T1w): precontrast mask, followed by standard DCE-MRI for two postcontrast acquisitions. | ||
5.4.1 Ultrafast Techniques for Diagnostic Use
Protocols, referred to as “ultrafast (UF)” or “accelerated” imaging, have been investigated and developed intermittently over the years and are now once again being used in clinical practice. These protocols are aimed toward image sampling of early kinetics within the first minute postcontrast injection at a fast rate (3–8 seconds per time point) for a bilateral scan, as shown in Chapter 3. Current diagnostic DCE-MRI examinations at UC include a high temporal resolution, lower spatial resolution (UF) acquisition during the first minute following contrast injection, followed by a standard, higher spatial resolution acquisition, achieving a total acquisition time of 7 minutes. Lesion conspicuity in UF images is often greatest within the first 30 seconds after contrast media injection, especially when marked BPE is found on later images. UF methods allow measurement of the rate of lesion enhancement with respect to time of initial arterial enhancement in the breast rather than time of injection, thus reducing dependence on global variables such as cardiac output. UF imaging in the first minute postcontrast injection can be incorporated into a standard-length diagnostic protocol, and delayed-phase kinetics can thus also be measured. 17 This approach to UF imaging uses standard Cartesian k-space sampling, which differs from “view-sharing” methods, that are often used in other clinical DCE-MRI high- resolution protocols. Keyhole approaches and other “view-sharing” methods such as “TRICKS” and “TWIST” typically involve scanning the center of k-space at relatively high temporal resolution, and the outer portions of k-space at much lower temporal resolution. 18 , 19 , 20 Each image in the dynamic series is then produced from data obtained from different parts of k-space, scanned at different times, resulting in high-quality images, but quantitative analysis of the acquired data with these sequences is difficult. Problems arise when data are analyzed to determine which features are enhancing at what strength and at what rate, particularly in the case of small features (e.g., lesions) with sharp and irregular edges. Information obtained from the initial 10 seconds after uptake initiation is combined with information from other time periods, and the diagnostic utility is thus diluted. For example, if a narrow blood vessel, the rim of a cancer, or speculations on a suspicious lesion appear to enhance rapidly, it is difficult to determine the true rate of enhancement. Compressed sensing methods have similar problems and produce artifacts. 21 , 22 Further examples of UF DCE-MRI incorporated into a standard diagnostic acquisition are shown (Fig. 5‑6, Fig. 5‑7, Fig. 5‑8, Fig. 5‑9, Fig. 5‑10).


UF DCE-MRI allows new approaches to quantitative data analysis, including measurements of the initial rate of lesion enhancement. Time of arrival of the contrast bolus can be accurately measured relative to the initial enhancement in the aorta. This potentially powerful approach can correct for variations in contrast media injection speed and cardiac output, allowing for more standardized measurements. UF imaging may also have other advantages; high temporal resolution protocols allow propagation of the contrast media bolus into a lesion allowing visualization of feeding arteries and draining veins and providing simplified and more accurate measurements of the arterial input function and Ktrans. Preliminary research suggests that there are significant differences between benign and malignant lesions in parameters that describe contrast media uptake kinetics in the first minute postinjection.
Related posts:
Stay updated, free articles. Join our Telegram channel

Full access? Get Clinical Tree


