Chapter Outline
Computed tomography angiography (CTA) revolutionized vascular imaging when vessels smaller than 1 mm in diameter were imaged with single-slice spiral CT. However, because of the small volume of coverage and limitations in the speed of image processing, CTA did not become widely used until the introduction of multidetector CT (MDCT) in 1998. With the advent of MDCT, temporal and spatial resolution of the scanners significantly improved. Gantry rotation times of 0.33 to 0.5 second, with slice thicknesses of 0.5 to 0.75 mm, are now available on most MDCT scanners.
CTA uses several parallel detectors along the z-axis with multiple channels of data (currently up to 320), allowing significant improvement in z-axis resolution. This allows isotropic resolution for most vascular applications with images obtained during a single, short breath-hold. The result has been elimination of the trade-off between spatial resolution (z-axis) and scanning range, a significant limitation of single-detector spiral CT. Hence, a significant benefit has been a paradigm shift from single-slice to volumetric data acquisition. This, in turn, has made imaging of different vascular phases with a single contrast bolus a reality.
Other than its limited invasiveness, advantages of CTA include lower cost and a potential reduction in the total volume of contrast material administered. With the fastest scanners currently available (16, 64, 256 slice), abdominal CTA can be performed with as little as 50 mL of contrast material using a saline flush. This requires meticulous attention to the timing of contrast bolus (see later). In the evaluation of life-threatening vascular disease, such as traumatic aortic injury or pulmonary embolus, CTA has clear advantage because of short acquisition times.
An important advantage of CTA over catheter angiography is its ability to examine the vessel wall, as well as its lumen. The adjacent organs can also be evaluated (e.g., staging of pancreatic adenocarcinoma). Another advantage of CTA is its ability to evaluate a vessel in projections that cannot be obtained with conventional techniques.
The increased use of CT has led to significant increases in radiation exposure and concerns about its effects. CT currently accounts for approximately 75% of the total radiation dose delivered by medical imaging. A number of techniques have been developed to help reduce radiation exposure from abdominal CTA. These technologic innovations address the issue in several ways, including collimation of x-ray beams to reduce exposure from over beaming, newer reconstruction algorithms, automatic tube current modulation, and use of lower tube potential settings. Automatic tube current modulation automatically adjusts the current during scanning to decrease the amount of radiation in anatomic regions that do not require higher current (e.g., lung bases or above the iliac crest) while maintaining image quality. In the appropriate setting, abdominal CTA may be performed with a reduced kilovoltage (kV) setting to decrease radiation to the patient and improve signal-to-noise ratio. For example, recent studies have demonstrated that lowering the kVp setting from 140 to 80 kVp significantly reduces patient dose and improves the contrast-to-noise ratio in the aorta while maintaining an acceptable level of image noise. Scanning with lower tube voltage may facilitate reduction of intravenous contrast dose because of an improved contrast-to-noise ratio.
Technical Considerations
Until the introduction of 16- and 64-slice CT scanners, improvement in spatial resolution came at the cost of temporal resolution. Now, with faster gantry rotation time (0.27 to 0.5 second) and an increase in the number of detector rows, isotropic voxel acquisition independent of the length of coverage is possible. The newer CT scanners use very complex spiral cone beam reconstruction algorithms instead of the filtered back projection mathematical reconstruction algorithm that was used in older scanners. These mathematical reconstruction algorithms are a byproduct of significant advances in computer technology. A combination of all these advances has made isotropic scanning of the abdominal aorta and its branches in a single breath-hold a clinical reality.
The latest generation of image reconstruction brings many other benefits in addition to improved spatial and temporal resolution. Although filtered back projection is a widespread and fast reconstruction algorithm used to create CT images, this technique produces relatively noisy images when the tube current or voltage is lowered. Iterative reconstruction (IR), the newest improvement in reconstruction algorithms in CT, can remove the noise from low-dose images using mathematical models. IR has shown the potential to improve image quality, allowing substantial reduction in patient dose compared with the filtered back projection techniques ( Fig. 9-1 ). More recent studies have demonstrated that IR facilitates a reduction in administered contrast dose while maintaining image quality when using a low-dose technique.

With shortened acquisition times of the multislice scanners, optimizing and maximizing vascular enhancement has become more challenging. CT angiography requires excellent contrast enhancement of the targeted vessels. A good-quality CT angiogram requires an arterial density value greater than 200 Hounsfield units (HU). This should be achieved rapidly, and the peak should coincide with the acquisition interval. Therefore it is crucial to time the contrast bolus correctly. However, rapid administration of contrast material shortens the plateau phase of contrast enhancement, thus creating a further challenge for correct timing of the study. For most abdominal CTA applications, an injection rate of 4 to 5 mL/s yields optimal vascular enhancement.
For achieving rapid intravenous (IV) administration of contrast material, excellent IV access (18- or 20-gauge needle) and a dual-head power injector are required. A saline bolus via a dual-head injector following contrast administration prolongs and improves arterial enhancement; it also decreases the amount of contrast required by using the residual contrast in the tubing, patient’s arm veins, and superior vena cava.
There are several factors that affect time to peak from the start of a contrast bolus. These include the iodine content of contrast material, injection rate, and patient’s cardiac status. A faster injection rate, for example, can achieve a higher density in the targeted vessel and results in a higher quality CTA. It also separates the arterial from the portal venous phase and thus results in excellent image quality without cross-contamination by different phases. Contrast material with a higher iodine concentration improves vascular enhancement if all other parameters are held constant. Because several factors affect time to peak enhancement in the aorta, a fixed timing delay for image acquisition is not advised.
All modern CT scanners provide software for calculating the optimal time to start scanning after the administration of a test bolus, a so-called test bolus injection ( Fig. 9-2A ) or allow automatic image acquisition once a preset HU threshold in the target vessel has been reached, known as bolus triggering ( Fig. 9-2B ). An important consideration with the 16- and 64-slice scanners is the possibility of outrunning the contrast bolus in patients with low cardiac output or in cases that require long z-axis coverage (e.g., combination of extremity and abdominal CTA). To overcome this problem, one can slow down the scanner by increasing the gantry rotation time and slowing the table speed.


As noted, the new multislice scanners, in combination with dual-head injectors, allow for a marked decrease in the amount of contrast used for routine CTA. However, the total volume of contrast administered for a routine abdominal CT (usually 150 mL of contrast material at a concentration of 300 mg/mL) should not change if solid organs, such as the liver, are evaluated in conjunction with CTA. Lowering the total volume of contrast may potentially reduce the sensitivity of lesion detection.
Many authors had previously reported the use of gadolinium chelates for CTA in patients who have diminished renal function. Although gadolinium is radiodense and may be used as a contrast agent with an x-ray, many gadolinium-based products have higher osmolality than iodine-based contrast media and are therefore potentially more nephrotoxic. More importantly, there have been several reports of nephrogenic systemic fibrosis leading to serious physical disability in patients with end-stage renal disease who had been receiving gadolinium-containing contrast agents.
Image Processing
Thinner slice acquisition with CTA has resulted in a significant increase in the number of images acquired. Hence, data overload has been a direct side effect of isotropic and near-isotropic scanning. CTA of the abdominal aorta and its branches on the newest scanners generates over 1000 images. As the volume of data significantly increases, the processing power of many of the current image processing workstations is pushed to its limits. The strain on the fiberoptic networks and image processing workstations has become a significant challenge for many institutions that have installed the fastest CT scanners. Workflow and image transfer issues are significant byproducts of CTA that are beyond the scope of this discussion but are important to consider when upgrading to the latest CT technology.
Postprocessing of the source data not only improves visualization of the vascular structures and their relationship to the adjacent organs, but also decreases the number of slices needed for review of the dataset. Images can be processed on the scanner or a free-standing image processing workstation. Thicker slices may be produced for review of the axial images on the picture archiving and communications system (PACS). Volume rendering, maximum intensity projection (MIP) rendering, or multiplanar reconstructions are routinely used to display large datasets. Volume-rendering techniques use attenuation thresholds to create a volumetric display of data and allow visualization of different tissue types simply by changing threshold settings. MIP rendering does not provide spatial depth but improves visualization of smaller vessels. Most institutions, including ours, routinely use a combination of the MIP and volume-rendered display of data for CTA because these two are complementary. Although volume rendering is useful for the display of soft tissues and three-dimensional relationships, MIP provides a more detailed view of the vessels within the slab of data and is less operator-dependent.
Anatomy
The major branches of the abdominal aorta are readily visible on helical CT and CTA. However, to evaluate vascular disease, CTA with thin sections and sufficient contrast enhancement is required. The typical branching of the celiac artery to the common hepatic, left gastric, and splenic arteries can routinely be appreciated on CTA. The smaller branches arising from the common hepatic artery may also be evaluated by CTA if thin slices are acquired and contrast enhancement is optimized by bolus timing or tracking techniques. The superior mesenteric artery and its branching are also easily evaluated by CTA. A significant portion of patients studied with CTA demonstrate variations in the branching of the abdominal aorta.
The renal arteries arise at approximately the L1-2 level, caudal to the origin of the superior mesenteric artery and cephalad to the origin of the inferior mesenteric artery. In approximately 28% of patients, there are multiple renal arteries.
The venous structures in the abdomen can also be evaluated by CTA. However, timing of scanning will be different, depending on the venous structure imaged. Renal veins will rapidly enhance as they return blood to the inferior vena cava. This, in combination with unopacified blood from the lower extremities, can create a pseudothrombus in the inferior vena cava. For optimal imaging of the portal vein, a delay of 65 seconds after the start of contrast administration is required. Therefore, to perform CTA and CT portography. one has to scan the abdomen successively with the newest multichannel scanners because these scanners, in combination with the rapid administration of contrast material, allow complete separation of the arterial and venous phases of hepatic enhancement. This separation of phases is more difficult with single- and four-slice MDCT because of lower temporal and spatial resolution. With the latest 16- and 64-channel scanners, early and late arterial enhancement of the liver can be imaged separately.
The portal vein arises from the confluence of the superior mesenteric and splenic veins and branches into right and left branches at the hepatic hilum. The right portal vein divides into anterior and posterior branches. The left portal vein defines the boundaries of the segments II, III, IVa, and IVb. When portal hypertension is present, numerous venous collaterals may be visible on MIP and volume-rendered images. The inferior mesenteric vein can be followed parallel to the course of superior mesenteric vein in the lower abdomen, coursing anterior to the left renal vein and draining into the splenic vein.
Anatomic variations of the major branches of the abdominal aorta, inferior vena cava, portal vein, and renal veins are common and are visible on CTA. For example, an accessory hepatic vein may be seen between segments V and VI. Single retroaortic or duplicated left renal veins are seen in 2.5% and 9% of the population, respectively. CTA allows accurate mapping of these variants. Assessment for these variations is essential when evaluating for hepatic segmentectomy, using the Whipple procedure, hepatic or renal donor assessment, or bowel resection. This is discussed in detail later in this chapter.
Clinical Applications
Common abdominal applications of CTA include evaluation of the abdominal aorta, preoperative and postoperative assessment for renal and liver transplantation, preoperative planning for hepatic segmentectomy and pancreatic surgery, mesenteric ischemia, and gastrointestinal (GI) hemorrhage. Other applications include cholecystectomy and splenectomy planning, as well as assessment for renal arterial disease in the evaluation of hypertension. The protocols for each application should be individually tailored to optimize imaging of the targeted vascular structures. For example, planning a Whipple procedure should include arterial and portal venous phase images.
Abdominal Aorta
MDCT has revolutionized imaging of the abdominal aorta because of its excellent spatial resolution and advantages over direct catheter angiography (DCA) (described earlier). Because of these advantages, CTA is usually the preferred imaging modality for evaluation of the abdominal aorta in acute and nonemergent settings.
Aortic Dissection
CTA allows accurate depiction of intimal separation from the adventitia and its extension into branch vessels. The site of intimal tear and its extension determine prognosis. Most institutions use the Stanford classification to assess prognosis as type A dissections (involving the ascending aorta), which require surgical management, and type B dissections (confined to the descending aorta), which are often managed conservatively.
Full assessment of aortic dissection by CTA requires unenhanced CT followed by contrast-enhanced CT. Unenhanced CT is useful because the detection of a dense intramural hematoma may be mistaken for chronic thrombus on enhanced images ( Fig. 9-3 ). On enhanced images, extension of the intimal flap to the aortic side branches and perfusion of organs affected by dissection should be assessed. Although quite variable, the true lumen is usually anterior to the false lumen in the upper abdominal aorta. At the level of the renal arteries, the false lumen usually supplies the left renal artery. The false lumen can also be distinguished from the true lumen by its larger diameter, which also shows lower attenuation if images are acquired during peak arterial enhancement. If there are iatrogenic or spontaneous fenestrations of the intima, the false lumen may show enhancement similar to that of the true lumen ( Fig. 9-4 ). Complications of aortic dissection include hemorrhage, hypoperfusion of the involved organs, and aneurysm formation.


Aortic Aneurysm
An abdominal aortic aneurysm (AAA) is a fusiform or focal saccular dilation, usually of the infrarenal portion of the aorta, more than 4 cm in external anterior-posterior diameter. About 90% of AAA are infrarenal, with most limited to the abdominal aorta, but extension to the common iliac arteries does occur. Accessory renal arteries may arise from an infrarenal aneurysm, thus affecting management. About 10% of aneurysms are juxtarenal, involving the main renal arteries, or suprarenal, involving the celiac or superior mesenteric arteries. Suprarenal and infrarenal aortic aneurysms together form a dumbbell configuration.
Aortic aneurysms are frequent in the older population and can be a cause of sudden death if they rupture. The prevalence of AAA is estimated at 1.5% of those older than 50 years and 5% to 8% of men older than 65 years. Because rupture of an aortic aneurysm can be catastrophic, aggressive screening and treatment have been advocated. An untreated AAA larger than 5 cm in diameter has a 20% likelihood of rupture in 5 years.
Ultrasound has been advocated as the imaging modality of choice for AAA screening. However, it has several shortcomings, including variability in transverse dimensions of the aneurysm, limitations in aneurysm neck assessment, and limited visualization of luminal thrombus. Because of the inherent limitations of ultrasound, CTA is preferred for confirming diagnosis, characterizing the aneurysm, and preoperative planning.
Currently, there are two accepted methods of treatment for AAA, open surgical repair and an endovascular approach. Open surgical repair is associated with significant risk, including a 6% to 10% mortality rate that is commonly caused by myocardial infarction. Endovascular aneurysm repair (EVAR) is a technique that was first described by Parodi and colleagues in 1991. This method excludes the aneurysm by traversing it with a stent graft, thus reducing pressure on the aortic wall. The results of this less invasive treatment have been excellent, with fewer complications and more rapid recovery.
Preoperative assessment of the aorta is preferably performed with multislice CTA because accurate measurement of the diameter of the aneurysm, its length, and its relationship to major vessels (e.g., renal arteries) is essential. For EVAR planning, the diameter and angle of the aneurysm neck, as well as its relationship to the renal arteries, is evaluated. Also, the amount of luminal clot may affect treatment. Three-dimensional evaluation of the aneurysm is particularly helpful for treatment planning ( Fig. 9-5 ). CTA provides useful information regarding femoral access sites and aortic accessibility. Orthogonal measurements of the aneurysm using a center line provide accurate measurements for preoperative planning. CTA has been shown to be extremely accurate for measuring vessel lengths, diameters, and angles and for assessing occlusive disease and calcification.

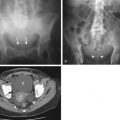
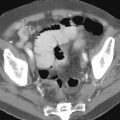
Patients treated with EVAR undergo frequent imaging by CTA to monitor for endoleaks, stent migration, fracture, and stability of aneurysm size ( Fig. 9-6 ). An increase in the diameter of an aneurysm is associated with endoleak. Evaluation of an endoleak historically required imaging with unenhanced CT and imaging during the arterial and venous phases of contrast enhancement ( Fig. 9-7 ). Unenhanced images are used to detect artifacts from calcification or embolization material that may mimic endoleak on enhanced images. Venous phase images have been shown to enhance detection rate of endoleaks. In a type I endoleak, there is a leak in the proximal or distal end of the graft. Type II endoleaks are caused by retrograde flow from aortic side branches, commonly the inferior mesenteric or lumbar arteries. Type III endoleaks are related to separation of the graft components and require immediate treatment. Type IV endoleaks have been associated with leakage through the graft pores and are usually transient. Reintervention is recommended for any type I or III leak ; type II endoleaks are characterized by lower flow and thus tend to be monitored regularly with intervention only if there is a significant increase in aneurysm size.


More recent studies on EVAR follow-up with CTA have focused on methods for radiation dose reduction. Although monitoring has typically involved triphasic protocols, some have suggested that the arterial phase can be eliminated, using only unenhanced and venous phases. This technique has been shown to depict and classify endoleaks accurately, with a significant dose reduction. Dual-energy CT is another more recently described alternative for endoleak detection that may lead to lower radiation exposure. Dual-source CT scanners contain two x-ray tubes with two corresponding detectors arranged on the gantry at a 90-degree angular offset. When used in the dual-energy mode, the two x-ray tubes operate at different peak voltages, enabling reconstruction of virtual unenhanced images from a single venous phase acquisition.
Pancreas
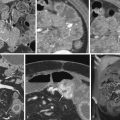
Staging of pancreatic cancer with multiphasic CT is now the standard of care in many institutions. It requires arterial, parenchymal, and portal venous phase images to evaluate the solid organs and mesentery ( Fig. 9-8 ). Addition of a noncontrast phase allows detection of parenchymal and vascular calcifications. Neutral oral contrast agents help distend the bowel and improve visualization of the bowel wall. Positive oral contrast agents (e.g., iodine-based agents) obscure vascular detail and should be avoided in all abdominal CTA procedures.

Although curved multiplanar reformations of the pancreas improve visualization of the parenchyma and pancreatic duct, MIP and volume-rendered images are needed for vascular analysis ( Fig. 9-9 ). The newest generation of scanners allows rapid multiplanar and MIPs on the scanner, thus obviating the need for routine data transfer to an independent image processing workstation.

Staging of the pancreatic carcinoma is discussed in detail in Chapter 98 . Because of the frequent variations of vascular anatomy that can affect the surgical approach, close evaluation of the anatomic variants, in addition to tumor encasement of the adjacent vasculature, is essential. For example, the presence of a replaced right hepatic artery originating from the superior mesenteric artery can significantly alter the planning for a Whipple procedure because this vessel traverses posteriorly to the pancreatic head ( Fig. 9-10 ). Similarly, preoperative knowledge of a replaced left hepatic artery facilitates ligation during a left hepatectomy because this major branch does not need to be identified in the porta hepatis.

Related posts:
 Abdomen: Normal Anatomy and Examination Techniques
 Computed Tomography Enterography
 Malignant Tumors of the Small Bowel
 Perfusion Computed Tomography and Magnetic Resonance Imaging in the Abdomen and Pelvis
 Ulcerative and Granulomatous Colitis: Idiopathic Inflammatory Bowel Disease
 Anatomy and Imaging of the Peritoneum and Retroperitoneum
Stay updated, free articles. Join our Telegram channel

Full access? Get Clinical Tree


