Chapter Outline
Perfusion Magnetic Resonance Imaging
Perfusion imaging is an exciting new radiologic investigation that allows functional evaluation of tissue vascularity by measuring the changes in the tissue characteristics after administration of intravenous contrast medium (IVCM). Rapid technologic advancements in both computed tomography (CT) and magnetic resonance imaging (MRI) coupled with innovations in postprocessing capabilities have widened the scope of perfusion imaging in a wide range of research and clinical applications.
Early in its development, perfusion imaging demonstrated significant applications in the evaluation of stroke patients because of its ability to accurately depict the structural and functional status of cerebral vasculature. With improved understanding of the tissue vascular physiology, perfusion imaging has been used extensively in various other body applications. In an oncologic setting, perfusion imaging plays a key role not only in the diagnosis and staging of malignant neoplasms but also in prognostic evaluation and monitoring of treatment response in various cancers. In addition, the ability of perfusion imaging to evaluate tumor biology and function has a promising role in providing early surrogate biomarkers for treatment response, thereby facilitating customized patient therapeutic options. In this chapter, we review the basic principles of perfusion CT and MRI and discuss their clinical applications in the management of diseases of the abdomen and pelvis.
Basic Principles
Perfusion imaging, either CT or MRI, essentially involves sequential acquisition of images through a particular tissue in question after the administration of IVCM. After intravenous administration, the contrast medium travels through the vascular system, leaks from the tissue vasculature, accumulates in the tissue, and then diffuses back into the vascular system before being ultimately eliminated through the urinary system. By measurement of the changes in tissue density or signal intensity during the movement of contrast material with sequential images, perfusion CT or MRI is able to estimate various semiquantitative measurements of perfusion, which allows evaluation of the tissue vascularity. Objective measurement of tissue enhancement by placement of region of interest (ROI) over the tissue allows generation of graphs of tissue density or signal intensity versus time, which enables measurement of semiquantitative values.
Perfusion Computed Tomography
Perfusion CT provides estimation of tissue vascularity by measurement of the progressive changes in tissue density after injection of iodinated IVCM. This functional CT technique is usually performed for evaluation of tissue perfusion in day-to-day clinical practice because of its widespread availability and presence of better experience. The speed of image acquisition and round-the-clock accessibility are particularly valuable in a neurologic setting for the evaluation of stroke patients, in whom it allows institution of immediate therapeutic interventions. The simple linear relationship between iodine concentration and tissue density changes and the easy availability of commercial software for postprocessing render quantification of vascularity easier with CT. In addition, the routine use of multidetector CT (MDCT) for tumor diagnosis and response assessment makes perfusion CT a preferred choice in an oncologic setting because it allows easier integration into treatment protocols.
Technical Principles
The basic principle of CT perfusion is the depiction of temporal changes in tissue attenuation after intravenous administration of iodine-based contrast medium ( Fig. 70-1 ). Tissue enhancement, which refers to increase in tissue attenuation after administration of IVCM, is proportional to the iodine concentration of tissues. Dynamic CT acquisition after IVCM administration thereby allows assessment of tissue enhancement, which represents an indirect measure of tissue vascularity and vascular physiology. Tissue enhancement after IVCM administration can be divided into two phases based on distribution characteristics of the contrast medium in the intravascular and extravascular compartments. The initial phase of enhancement or the first pass (usually lasting 30-60 seconds after influx of the contrast medium) is mainly due to distribution of contrast medium within the intravascular space. In the second phase, tissue enhancement is secondary to distribution of contrast medium between both intravascular and extravascular compartments due to movement of contrast medium from the intravascular to the extravascular compartment across the capillaries. Accordingly, tissue enhancement in the first phase is determined primarily by tissue blood flow and blood volume, whereas capillary permeability to the IVCM contributes to enhancement in the later phase. Semiquantitative assessment of tissue perfusion based on dynamic CT acquisition can be accomplished by analytical methods, and the two most commonly used analytical methods are deconvolution and compartmental analysis.

Both the deconvolution and compartmental modeling methods are broadly equivalent, with few differences in their theoretical assumptions and susceptibility to noise and motion. Compartmental analysis (single- and double-compartment methods) is based on the assumption that the bolus of contrast material is retained within the organ of interest at the time of measurement, and this can at times result in underestimation of perfusion values in organs with rapid vascular transit. Compartmental analysis uses three sets of images for perfusion estimation, including the baseline image and images before and after the maximal rate of contrast enhancement, and is therefore not usually degraded by patient motion. However, the presence of higher image noise adversely affects perfusion value calculation for the compartmental model, and therefore a higher tube current with lower image frequency is preferred for the dynamic CT technique.
Deconvolution analysis is based on the use of arterial and tissue time-concentration curves to calculate tissue perfusion and relative blood volumes. Although this modeling technique works well for most organs, it might not be suitable for assessing perfusion in organs such as the spleen and kidney, which have complex microcirculations, for which compartmental analysis is preferred. Deconvolution methods are suitable for measuring lower perfusion values (<20 mL/min/100 mL); this method tolerates greater image noise because the complete time series of images is included for calculation. As a result, deconvolution analysis is particularly beneficial for monitoring treatment response because of its ability to accurately measure lower perfusion values typically seen after successful treatment. The inclusion of the complete series of images, however, renders this method susceptible to image misregistration from patient motion and therefore erroneous calculation. As the deconvolution method is less sensitive to noise, it allows use of a lower tube current and permits scanning with higher temporal resolution for dynamic cine CT acquisition. The various analytical methods, the acquisition protocols, and the software packages differ between scanner technologies and the commercial vendors ( Table 70-1 ). Nevertheless, irrespective of the technology used, perfusion CT allows estimation of various qualitative and quantitative measures of tissue perfusion.
| Mathematical Model | Deconvolution Method | Two-Compartment Model | Slope Method |
|---|---|---|---|
| Vendors | GE Healthcare | Siemens | Philips, Toshiba, Siemens |
| Basic principle | Uses arterial and tissue time-concentration curves to estimate tissue perfusion | Based on Patlak analysis and assumes one-way transfer of contrast medium from IVS and EVS proportional to blood clearance constant | Perfusion is estimated as a maximum slope of tissue concentration curve normalized to maximum arterial enhancement |
| Parameters measured | BF, BV, MTT, PS | BV and permeability | BF, MTT, time to peak enhancement |
| Advantages | The perfusion parameters can be calculated by a single CT study | Simple analysis Efficient in calculation of rate constant value | Short scan duration Assumption of no venous outflow and no recirculation; less sensitive to movement |
| Limitations | Partial volume averaging correction required | Based on assumption that back-flux of contrast medium from EVS to IVS is negligible in the initial 1-2 minutes | Sensitive to image noise |
Protocol
The perfusion CT protocol needs to be tailored to the clinical objective in question, body part being scanned, mathematical modeling technique employed, CT scan configuration, and radiation dose considerations. A typical dynamic CT protocol consists of a preliminary noncontrast scan followed by a dynamic acquisition performed after administration of IVCM. The noncontrast CT scan serves as a localizer for selecting the appropriate tissue area to be included in the dynamic CT acquisition. A 2- to 4-cm area of tumor tissue is routinely selected for dynamic scanning on the basis of the scanner configuration (16-slice or 64-slice CT scanner). With the introduction of 128-slice to 320-slice MDCT scanners, larger areas of tumor tissue (8-16 cm) can be interrogated for assessment of tissue perfusion. Several techniques have been introduced to allow perfusion imaging of a volume of tissue or entire organ, including axial shuttle mode (repeated axial scans at two adjacent table positions in a to-and-fro manner to double detector coverage) and helical shuttle mode (continuous bidirectional table movement with variable pitch).
The dynamic CT acquisition consists of a first-pass phase, a delayed phase, or both, depending on the pertinent physiologic parameters that need to be analyzed and the tissue in question. The first-pass phase or the initial cine phase consists of CT images acquired for a total of 40 to 60 seconds after the injection of IVCM. For obtaining permeability measurements, a second delayed phase ranging from 2 to 10 minutes follows the first phase. In the first-pass phase, the MDCT images are acquired every 1 to 3 seconds; in the second phase, the images are acquired every 5 to 15 seconds. A key consideration for optimal evaluation of tissue perfusion is the IVCM bolus used for dynamic CT acquisition ( Table 70-2 ). An additional consideration in dynamic CT evaluation of the upper abdomen is the need for appropriate breath-holding instructions to patients to limit the potential deleterious effects of motion on estimated perfusion values. Some authors recommend use of motility-inhibiting agents, such as glucagon, to limit peristaltic movements of bowel during image acquisition.
| Kilovoltage * | 100-120 |
| Milliampere-seconds * (mAs) | 50-150 |
| Iodine concentration † (mg I/mL) | 370-400 |
| Contrast bolus (mL) | 40-70 |
| Injection rate ‡ (mL/s) | 4-10 |
| Scan delay (s) | 5-10 |
* Lower kilovoltage peak and milliampere-seconds are recommended to reduce the radiation exposure.
† A higher iodine concentration of 370 mg I/mL is preferred because of the linear relationship between iodine concentration and tissue enhancement.
‡ Higher injection rates are preferable to maximize tissue enhancement and to improve signal-to-noise ratio.
Postprocessing
The dynamic CT data obtained after a perfusion CT study are processed on dedicated workstations using specific vendor-based perfusion software. The postprocessing of the CT perfusion data generates colored parametric perfusion maps. Quantitative tissue perfusion measurements are then obtained from these perfusion maps by ROI placement over the tissue in question. The various quantitative perfusion parameters estimated depict various aspects of tissue or tumor vascular physiology ( Table 70-3 ). With the increasing use of CT perfusion in various body applications, several non–vendor-based software models are available that allow estimation of tissue perfusion irrespective of the method of scanning.
| Perfusion Parameter | Definition | Marker (in Oncology) | Units |
|---|---|---|---|
| Blood flow or perfusion (BF) | Flow rate through tissue vasculature in the region of interest | Tumor vascularity Tumor grade | mL per 100 g/min |
| Blood volume (BV) | Volume of blood flowing within the tissue vasculature in the region of interest | Tumor vascularity | mL per 100 g |
| Mean transit time (MTT) | Average time taken to travel from artery to vein | Perfusion pressure | Seconds |
| Permeability–surface area product (PS) | Total flux from plasma to interstitial space | Immature leaky vessels | mL per 100 g/min |
| Time to peak (TTP) | Time from arrival of the contrast medium in major arterial vessels to the peak enhancement | Perfusion pressure | Seconds |
| Peak enhancement intensity (PEI) | Maximum increase in tissue density after injection of contrast medium | Tissue blood volume | HU |
Clinical Applications
Perfusion CT has been established as a valuable technique for estimation of tissue vascularity. The validity and reproducibility of this functional CT technique have been proved in several animal and human studies and tested against other techniques, such as xenon washout methods. Early studies have demonstrated the value of this technique in quantifying tissue perfusion in solid visceral organs such as liver, pancreas, spleen, and kidney. * Ever since, perfusion CT has found a wide range of applications in oncology, such as determining tumor biology including lesion characterization, risk stratification and staging, monitoring response to various treatment regimens (chemoradiation and antiangiogenic drugs), and predicting treatment outcome. In addition to the overwhelming amount of research performed in oncology, this technique has also been explored in the assessment of tissue perfusion in various nononcologic applications, such as in patients with cirrhosis and renal artery stenosis.
* References .
Tumor Biology
One of the key elements of tumor physiology that influences the aggressiveness of tumors and their response to treatment is the status of tumor microvasculature (neoangiogenesis). * Tumor angiogenesis refers to the development of new blood vessels in the tumor, resulting in vascularization. * Histopathologic markers, such as tumor microvessel density count, are established markers of tumor angiogenesis. Despite the “gold standard” attributes of microvessel density, it is invasive to obtain tissue, often in regions that are difficult to approach, and fraught with sampling error. Moreover, it lacks the functional information about angiogenesis and is often impractical for monitoring of response at several time points. Because the perfusion profile of a lesion on dynamic contrast-enhanced CT (CECT) is a reflection of its underlying vascular signature, CT perfusion can be exploited to predict the status of tissue vascularity and therefore predict tumor biology. * Several studies have demonstrated the role of perfusion CT in evaluating tumor biology, including lesion characterization and assessment of tumor grade. †
* References .
† References .
Several studies have shown significant differences in tissue perfusion values between normal tissue and benign and malignant tumors in the liver, pancreas, and colon. ‡ In general, malignant tumors demonstrate higher perfusion values (increased tumor perfusion and capillary permeability). In bowel, colorectal cancers demonstrate higher tumor perfusion compared with normal colonic wall. Higher tumor perfusion can also be used to differentiate between colonic wall thickening in diverticulitis and colorectal cancer. In the liver, perfusion CT allows an earlier detection of hepatic metastases because hepatic arterial perfusion in these patients is increased. The lesions are seen as an area with increased blood flow in comparison to the rest of the liver parenchyma. The baseline tumor perfusion in hepatic metastases can also be used to predict treatment outcome as metastatic lesions with higher perfusion have improved prognosis compared with those with lower perfusion. In patients with hepatocellular carcinoma (HCC), differentiation from background liver is possible because of the higher perfusion seen in HCC (higher blood flow, blood volume, and permeability–surface area product).‡ References .
Perfusion CT also aids in evaluating tumor aggressiveness and helps differentiate between well-differentiated and moderately to poorly differentiated tumors. In the pancreas, dynamic CECT allows characterization of hypervascular pancreatic tumors, such as insulinoma, that show higher perfusion. The perfusion measurements of pancreatic neuroendocrine tumors also correlate with histoprognostic factors. In the prostate, malignant foci have shown considerably increased perfusion values, and this potentially would allow identification of tumor foci, thus enabling targeted radiotherapy with minimal radiation to the surrounding tissues.Risk Stratification and Staging
Tumor vascularity is a marker of tumor aggressiveness, and higher tumor vascularity is often indicative of aggressive biology and often associated with a poor outcome compared with less vascular tumors. By depicting the vascular signature of tumors, CT perfusion has been shown to be valuable in risk stratification and tumor staging. Patients with metastatic renal cell carcinoma with higher baseline tumor perfusion have been shown to have a poor prognosis. In patients with rectal cancer, dynamic CECT has been shown to be more accurate and specific than conventional CT in characterizing local invasion. In HCC, baseline perfusion parameters have been shown to correlate with clinical outcome.
Even in nononcologic settings, perfusion CT has been shown to be helpful in risk stratification. In patients with cirrhosis, perfusion changes depicted on CT correlate well with the severity of chronic liver disease. In patients with acute pancreatitis, perfusion CT has been found to be sensitive for detection of pancreatic ischemia, which demonstrates reduced perfusion values compared with normal pancreas. The identification of ischemic areas can help predict the later development of pancreatic necrosis, which has therapeutic implications because its early detection and identification will allow induction of intensive care for these patients at the earliest to prevent infective complications and to improve the prognosis. In patients with mesenteric ischemia, dynamic CECT has the potential role of identifying bowel at risk of ischemic injury.
Monitoring Treatment Response
Novel antiangiogenic drugs target tumor neoangiogenesis, which is mediated by circulating factors, such as vascular endothelial growth factor, fibroblast growth factor, and platelet-derived endothelial cell growth factor. * After successful response to therapy, there is a reduction in tumor perfusion, vascularity, and vascular permeability that precedes changes in tumor size. † Conventionally, therapeutic response to various treatment regimens has been monitored by serial assessment of tumor burden on CT or MRI according to criteria such as the Response Evaluation Criteria in Solid Tumors (RECIST) or World Health Organization criteria. However, these traditional methods of response assessment are not effective in demonstrating early changes after treatment with targeted therapies because the functional and perfusional changes precede morphologic changes. An ideal imaging marker for these therapies needs to be noninvasive, reproducible, readily available, and repeatable and should dynamically reflect the microcirculatory function in a living individual. Perfusion CT has particularly seen rising utility in monitoring treatment response in various cancers to a number of therapeutic regimens, including chemoradiation and novel antiangiogenic drugs. In addition to monitoring treatment response, dynamic CECT could be used to predict response and prognosis.
* References .
† References .
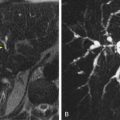
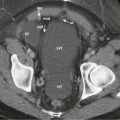
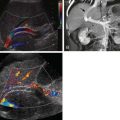
After a combined chemotherapy regimen of oxaliplatin and bevacizumab in HCC, CT perfusion demonstrated reduction in tumor vascularity that correlated with clinical response ( Fig. 70-2 ). In rectal cancer, after combined chemoradiation including antiangiogenic therapy, a consistent decrease in tumor perfusion (fall in blood flow and increase in mean transit time) was shown on CT ( Fig. 70-3 ). There is also evidence that CT perfusion has shown reduction in tumor perfusion after antiangiogenic therapy in renal cell carcinoma and neuroendocrine tumors.

Perfusion Computed Tomography
Perfusion CT provides estimation of tissue vascularity by measurement of the progressive changes in tissue density after injection of iodinated IVCM. This functional CT technique is usually performed for evaluation of tissue perfusion in day-to-day clinical practice because of its widespread availability and presence of better experience. The speed of image acquisition and round-the-clock accessibility are particularly valuable in a neurologic setting for the evaluation of stroke patients, in whom it allows institution of immediate therapeutic interventions. The simple linear relationship between iodine concentration and tissue density changes and the easy availability of commercial software for postprocessing render quantification of vascularity easier with CT. In addition, the routine use of multidetector CT (MDCT) for tumor diagnosis and response assessment makes perfusion CT a preferred choice in an oncologic setting because it allows easier integration into treatment protocols.
Technical Principles
The basic principle of CT perfusion is the depiction of temporal changes in tissue attenuation after intravenous administration of iodine-based contrast medium ( Fig. 70-1 ). Tissue enhancement, which refers to increase in tissue attenuation after administration of IVCM, is proportional to the iodine concentration of tissues. Dynamic CT acquisition after IVCM administration thereby allows assessment of tissue enhancement, which represents an indirect measure of tissue vascularity and vascular physiology. Tissue enhancement after IVCM administration can be divided into two phases based on distribution characteristics of the contrast medium in the intravascular and extravascular compartments. The initial phase of enhancement or the first pass (usually lasting 30-60 seconds after influx of the contrast medium) is mainly due to distribution of contrast medium within the intravascular space. In the second phase, tissue enhancement is secondary to distribution of contrast medium between both intravascular and extravascular compartments due to movement of contrast medium from the intravascular to the extravascular compartment across the capillaries. Accordingly, tissue enhancement in the first phase is determined primarily by tissue blood flow and blood volume, whereas capillary permeability to the IVCM contributes to enhancement in the later phase. Semiquantitative assessment of tissue perfusion based on dynamic CT acquisition can be accomplished by analytical methods, and the two most commonly used analytical methods are deconvolution and compartmental analysis.