Figure 19.1 Delayed necrosis on DWI in a two-month-old infant. This child presented with encephalopathy and respiratory failure requiring intubation. An outside CT was performed due to the encephalopathy and showed bilateral subdural collections with recent blood products. An MRI was ordered for further evaluation. The first MRI was performed the day after presentation. The first MRI included (A) axial T2 turbo spin echo (TSE), (D) axial ADC map, and (G) axial DWI and was read as bilateral subdural collections with no parenchymal abnormality. An eye exam was normal with no retinal hemorrhages. A SS including a head CT was performed one day after the MRI admission and no fractures were identified. However, the head CT detected low attenuation in the brain parenchyma and a repeat MRI was performed the next day (two days after the initial MRI). It included (B) axial T2 TSE, (E) axial ADC map, and (H) axial DWI and clearly showed white matter hyperintensity on T2 weighting with bilateral posterior greater than anterior decreased diffusivity which manifests as decreased signal (black arrows) in the ADC map (E) and increased signal (arrowheads) in the DWI (H). Suspicion of abuse was reported to authorities by the CPT. These areas of decreased diffusion indicated delayed presentation of cerebral injury, likely delayed necrosis. Follow-up imaging at 18 months shows microcephaly, diffuse volume loss causing ventriculomegaly and right greater than left areas of gliosis on (C) axial T2WI, (F) axial fluid-attenuated inversion recovery (FLAIR), and (I) coronal T2 images. Note subtle areas of cortical gliosis (arrows in I). The child at two years of age had acquired microcephaly and developmental delay.
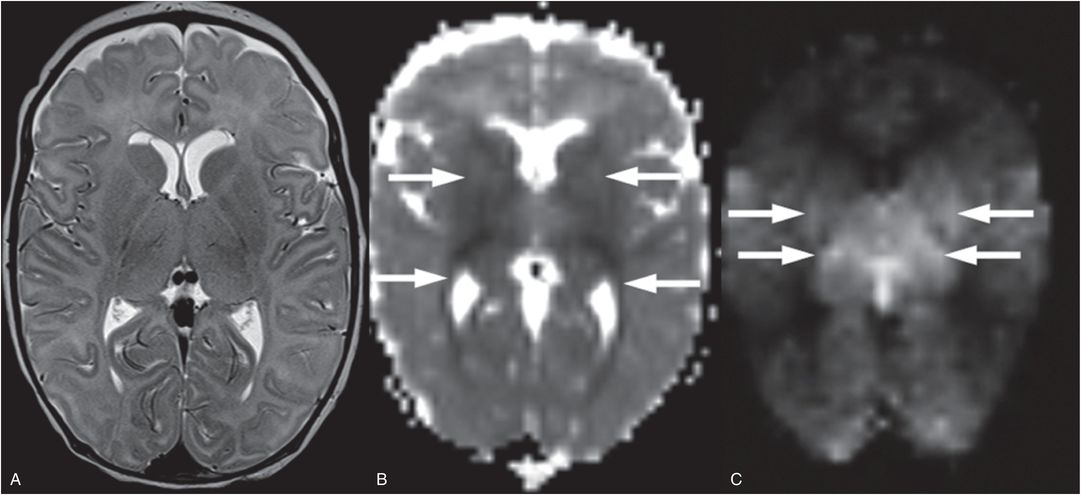
Figure 19.2 Pattern of injury asssociated with cardiac arrest. This six-week-old term infant suffered a witnessed cardiac arrest and there was no suspicion of traumatic injury. The infant had a history of hypotonia but no specific diagnosis, suffering a cardiorespiratory arrest associated with a viral infection. A, Two days after cardiac arrest, T2WI shows subtle increased T2 signal in the basal ganglia and thalami with loss of distinction of their boundaries. Subependymal cysts are also incidentally noted adjacent to the frontal horns and may be related to an underlying disorder. B, Decreased diffusion is noted as the dark signal in the deep-gray nuclei, posterior limb internal capsule, and optic radiations (arrows). C, On ASL hyperperfusion is noted as high signal in the thalami and lateral putamen (arrows). Deep-gray matter edema, decreased diffusion, and hyperperfusion are the classic subacute findings associated with cardiac arrest. This infant did not survive.
As with acute necrosis, MRI is the modality of choice for detecting brain injury. The characterization of delayed injury patterns must be weighed against the need to detect recent blood products before they transition to methemoglobin at approximately three days (see Chapters 18, 20). Follow-up MRI provides further assessment of the evolution of the brain injury (Figs. 19.1, 19.3; also see Figs. 19.16).
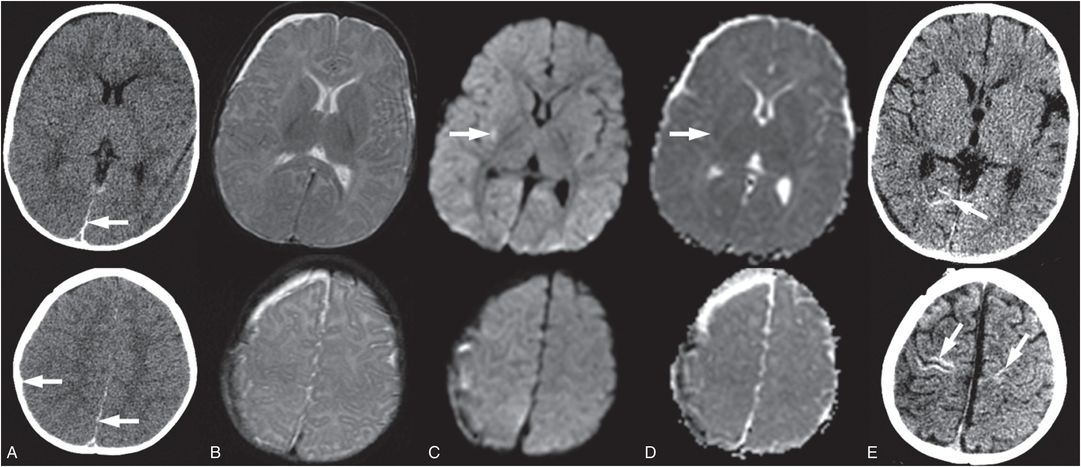
Figure 19.3 Abusive brain injury confirmed with follow-up study. This six-month-old infant presented nonresponsive and apneic to the ER. (See same infant in Fig. 19.18.) A, Axial CT at presentation shows a posterior interhemispheric and small right posterior SDHs (arrows) that were better seen on subdural windows (not shown), sulcal effacement, and subtle decrease in gray–white contrast. A relatively bright cerebellum compared to the cerebrum was noted (see Fig. 19.18) B, Axial T2WI; C, DWI; and D, ADC in the same infant 12 hours later confirms the subdural collections, with the right hemispheric subdural collection increased in size. DWI and ADC show only a tiny focus of bright signal on the DWI concerning for decreased diffusivity in the right posterior lateral putamen (arrows). Repeat MRIs were obtained at three and four days after admission with no definitive diffusion abnormality. E, However, follow-up CT 18 days after admission clearly demonstrates diffuse volume loss and areas of increased attenuation (arrows) consistent with cerebral hypoxic ischemic injury. The lack of diffusion abnormality but clear injury on follow-up suggests delayed cell death that was likely predominantly apoptotic instead of necrotic due to lack of a diffusion abnormality in the acute or subacute phase. The potential for negative acute and subacute MRI emphasizes the need for follow-up imaging to fully assess extent and degree of cerebral injury. Authorities were notified and the CPT was involved due to concern for abuse. The suspect was arrested, charged, and admitting to shaking the infant. In this case brain injury is hypothesized to be due to severe apnea secondary to shaking.
Apoptosis
Apoptosis occurs when the insult is even milder as blood flow and oxygen return early enough that energy metabolism does not fail but PCD mechanisms are initiated (5, 9, 10). As apoptosis is not associated with cellular swelling and membrane breakdown, its imaging signature is subtle. Initial CT and MRI with diffusion imaging are normal, but ASL shows preservation of perfusion and, in some cases, rebound hyperperfusion. As apoptosis is a “neighbor friendly” type of cell death, the end result is primarily volume loss without frank gliosis. The maximal delay between insult and apoptosis is poorly documented in the immature brain but it is likely that milder insults have longer delays; based on imaging findings, volume loss can continue for weeks after an event.
Some authors make a distinction between normal developmental apoptosis and injury-induced apoptosis, calling the latter pathologic apoptosis (5). This is to emphasize that in the pathologic setting, pure apoptosis rarely occurs and if even apoptosis dominates there is typically evidence of activation of many different cell death pathways. This has given rise to the term “necroptosis” to recognize that apoptosis and necrosis often occur together. The imaging consequence of this mixture of cell death processes is that regions of brain injuries are likely to be nonuniform in appearance, at least initially, due to varying types and stages of tissue injury. Therefore regions of decreased mean diffusivity may also have regions of evolving apoptosis resulting in a spectrum of regions of mild volume loss to cystic encephalomalcia.
Apoptosis plays a critical role in a number of different types of brain insults including both hypoxic ischemic injury (HII) and trauma. It should be noted that even with a primary focal traumatic brain injury (TBI), global secondary apoptosis can occur (25).
As a result of the protracted course of apoptosis and the competing process of brain growth, it is hard to determine an optimal time for follow-up imaging to assess the full extent of the injury. In practice, 3–6 months are commonly used, primarily as these time points fit well with clinical follow-up schedules.
Autophagy
Autophagy (or autophagocytosis) is a catabolic mechanism of cell degradation though actions of lysosomes and can be either protective or destructive (7). This type of cell death is thought to occur with even the milder injury that is required for apoptosis (26). Cerebral ischemia, hypoxia, and/or reperfusion as well as trauma can up-regulate Beclin1 and LC3, activating autophagy. This can initially rescue the cell by preventing necrosis through catabolic energy production, or preventing apoptosis by removing damaged mitochondria. In the case of prolonged overactivation, autophagy results in cell death by complete self-digestion. This type of cell death can be initiated in the absence of intact apoptotic machinery; it preserves the cytoskeleton with the resultant nonviable cell removed by phagocytosis without inflammation. Thus imaging features are likely to be similar to apoptosis. As with apoptosis, a cell may not complete this process and switch to a necrotic form of cell death.
Liquifaction
In addition to the above three mechanisms of cell death, there is another observation that has been made in immature brains; the ability of the infant brain to rapidly liquefy by unknown mechanisms. Studies in the rabbit spinal cord show that injured tissue liquefies and dissolves extremely fast after transection in the neonate compared to mature rabbit. Smooth walled cavities and limited gliosis are evident by eight days (27). This liquefaction process in the immature brain is poorly understood and documented, but it is likely that such processes also play a role in the evolution of infant brain injury. The imaging hallmarks of impending liquefaction are unknown. Based on our clinical experience with contusional clefts (see discussion below), it appears that liquefaction can occur without preceding decreased diffusion (see Fig. 19.16). Thus, to the untrained observer, these lesions may appear chronic when in fact they are acute evolving injuries.
Summary
Note that all three types of PCD are delayed and require energy and therefore cerebral perfusion must return. As these processes are primed and ready to play a role in normal infant brain development, it is possible that with brain injury, these processes become amplified in the immature brain. In AHT, excitotoxicity is thought to play a major role in these delayed cell death mechanisms (28, 29). In animal models of transient HII, secondary energy failure and initiation of cell death processes occurs 6–48 hours after an initial insult (30–32). The range of delay that can occur in the immature human brain is unknown but the delay and pattern of injury is likely related to the severity, type, and duration of the injury. Imaging findings may begin as very subtle or difficult to detect initially during stages of transient energy recovery and become more evident over time as delayed necrosis occurs. Occasionally, acute and subacute imaging can be negative even when neurologic symptoms are present. In such cases, follow-up imaging may provide evidence of brain injury by the presence of volume loss indicating a dominant apoptotic process (Fig. 19.3). Due to this evolution of cell death, repeat imaging may be necessary to prove the occurrence of a prior insult and to detect the pattern of brain injury that may provide insight into the type of insult. All too often, follow-up imaging is not obtained even though necessary to fully document the pattern and extent of injury.
In summary, brain insults in infants result in a complex mix of cell death processes from autophagosis, to apoptosis to delayed necrosis (33) that evolve over time due to the delayed nature of these primed programmed cell death mechanisms. Unique to the immature brain is the dominant role of pathologic apoptosis and the possibility of liquefaction. Complicating the picture are metabolic compromise or disruption of celluar integrity. The implication for imaging is that acute evolving injury can be present in the absence of decreased diffusivity and there is no one optimal time to image the brain to fully understand the extent of acute injury. With delayed pathologic apoptosis continuing for an unknown period of time, the optimal time point to document brain volume loss before ongoing brain growth masks this volume loss is unclear. We advocate at least an admission and discharge neuroimaging study as well as a 3–6 month follow-up imaging in cases with neurologic involvement to begin to understand this process (see Chapter 20). The admission MRI should be performed within two days to best date blood products. Additional imaging should be considered if the first MRI is normal but neurologic status remains compromised, if there is worsening of the neurologic status, or if the initial MRI had indeterminate findings.
Cerebral edema
Five different types of cerebral edema have been described, cytotoxic, vasogenic, transependymal/interstitial, hyperemic, and osmotic. However, both hyperemic and osmotic forms of edema refer to etiologies with the edema originating from the vasculature and can, therefore, be considered as one of the many causes of vasogenic edema. In addition to these classic types of edema, myelin vacuolization or myelin splitting at the intraperiod line resulting in intramyelinic edema can occur and is associated with compromised energy metabolism and ischemia (34–36).
Cytotoxic
Cytotoxic edema is cellular swelling that can be transient if due to energy compromise but is irreversible when due to energy failure associated with necrosis. The shift of fluid from the extracellular to intracellular space in combination with a number of other altered cellular physiologic processes results in decreased mean diffusivity. The timing and duration of decreased diffusion depends on the timing and duration of metabolic compromise or necrosis associated with the mechanism of injury (see above under the Acute necrosis and Delayed necrosis sections and below under the Secondary injury section). This type of edema is associated with decreased mean diffusivity and normal to elevated fractional anisotropy (FA) (Fig. 19.4A–C). As fluid accumulates, increased T2 signal and decreased FA occur and persist as tissue structure breaks down.
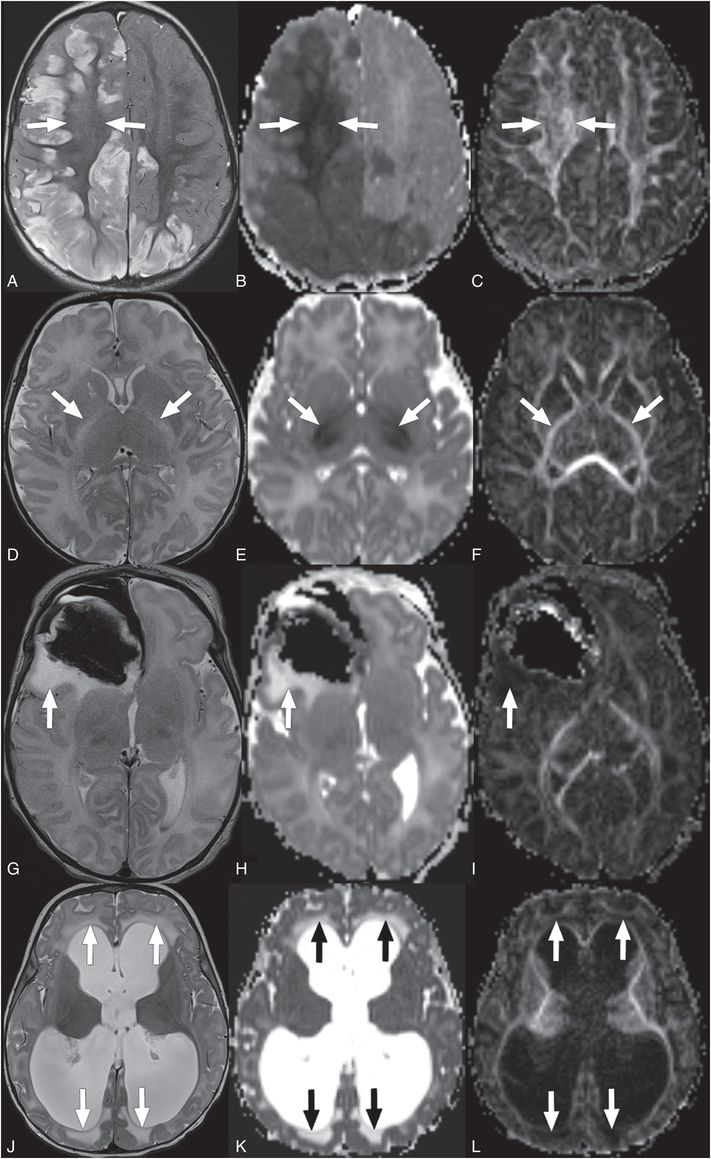
Figure 19.4 Types of cerebral edema. (A–C) Cytotoxic edema (A?C) has increased signal on T2WI (A, arrows), and in early phases with decreased signal on ADC maps (B, arrows), and normal to elevated signal on FA maps (C, arrows). This is a 12-month-old infant presenting with retinal hemorrhages, multiple healing fractures, cerebral SDH (not shown here), and bilateral asymmetric cerebral ischemic necrosis/cytotoxic edema shown in these images. Findings were concerning for AHT.Intramyelinic edema (D?F) has increased signal on T2WI (D, arrows), isointense to decreased signal on ADC maps (E, arrows), and normal to elevated signal on FA maps (F, arrows). This is a 13-day-old infant with maple syrup urine disease presenting acutely with intramyelinic edema. Vasogenic edema (G?I) has increased signal on T2WI (G, arrow), increased signal on ADC maps (H, arrow), and low signal on FA maps (I, arrow). This is an eight-day-old with vasogenic edema around a right frontal hematoma and associated subpial hematoma.Interstitial edema (J?L) has increased signal on T2WI (J, arrows), increased signal on ADC maps (K, arrows), and low signal on FA maps (L, arrows). This is a four-month-old infant that presented with obstructive hydrocephalus and transependymal flow/interstitial edema.
Intramyelinic
Intramyelinic edema (myelin vacuolization) has been proposed as a special type of cytotoxic edema that occurs when fluid accumulates within the myelin or intramyelinic clefts (36). In the developing brain, this type of edema can only occur where myelinated axons are found. Timing of myelin vacuolization is related to the mechanisms involved, but this type of decreased diffusivity can persist for prolonged periods of time without clear volume loss or gliosis on follow-up and is, therefore, distinct from necrosis (37–39). This type of edema is associated with decreased mean diffusivity, relative preservation of FA, and normal to increased T2 signal (Fig. 19.4D–F).
Vasogenic
Vasogenic edema is fluid that originates in the vascular system but leaks into the interstitial space due to disruption of the BBB or due to increased pressure or osmotic gradients. In some cases multiple etiologies may contribute to the vasogenic edema. This additional fluid causes mass effect because of the space occupying effect of the increased fluid and is associated with increased mean diffusivity, decreased FA, and increased T2 signal (Fig. 19.4J–L). The amount of time required for vasogenic edema to form depends on the etiology.
Interstitial
Interstitial edema occurs in the periventricular regions because of increased cerebrospinal fluid (CSF) pressures resulting in CSF passing through breaks in the ependyma into the extracellular space. Like vasogenic edema, interstitial edema is associated with increased mean diffusivity, decreased FA, and increased T2 signal (Fig. 19.4G–I). This type of edema can form rapidly when there is a rapid rise in the pressure gradient between the ventricular CSF and the tissue.
Cortical laminar necrosis
Pathologically cortical laminar necrosis corresponds to selective injury, primarily the loss of neurons in the more vulnerable cortical layers 3, 4, and 5. Cortical energy impairment if severe enough will be detected acutely as cortical regions of decreased diffusion that typically develop edema (increased T2 signal) over the first hours to days of insult. As the process evolves, bright T1 signal in the cortex will appear (Fig. 19.5). In adult arterial ischemic stroke, cortical T1 hyperintensities appear approximately two weeks after the ischemic event (40). On T2-weighted imaging (T2WI), these cortical regions appear iso to decreased in signal. T1 cortical hyperintensities become more prominent a few months after the event and typically disappear in a few years. The bright T1 signal on MRI is thought to be due to lipid breakdown products, denatured proteins, or iron deposition (40–42). In the subacute to chronic phase, associated cortical calcification may be evident as increased attenuation on CT (see Fig. 19.3). These calcifications may also decrease or resolve over time. Occasionally early cortical hemorrhage occurs and the blood products result in foci of cortical hyperattenuation and corresponding T1 hyperintensity. The etiology of cortical laminar necrosis is thought to be energy depletion leading to selective neuronal loss, as opposed to pan-necrosis. For example, cortical laminar necrosis can be a sequela of hypoxia and ischemia, stroke, cardiac arrest, hypoglycemia, or status epilepticus. Thus, in unknown cases where imaging features of cortical laminar necrosis are identified, a prior insult that impaired cerebral metabolism is likely.
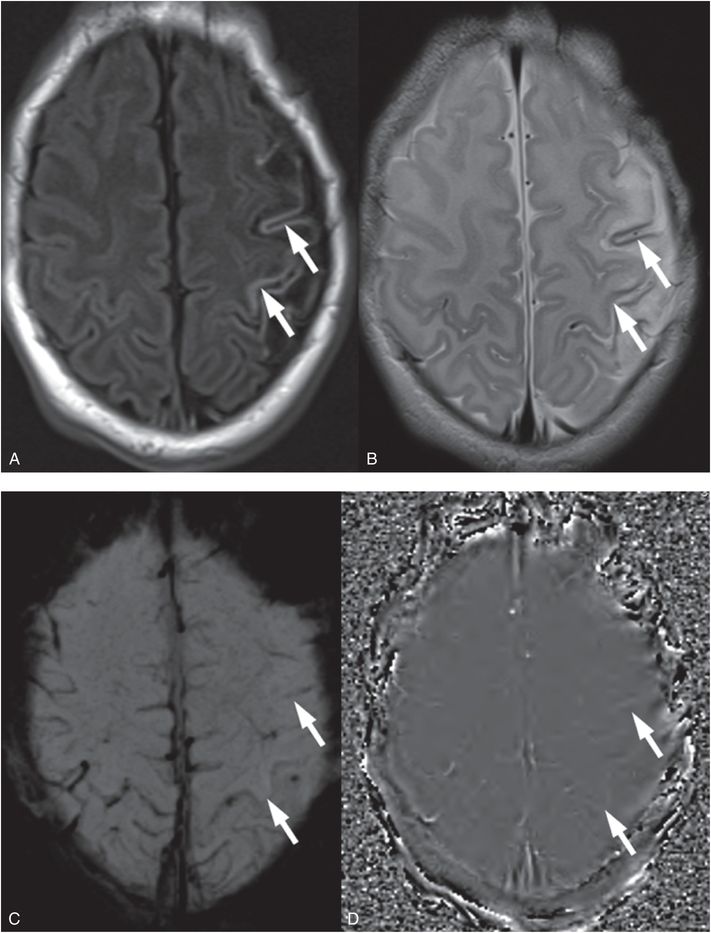
Figure 19.5 Cortical laminar injury in an evolving perinatal left hemisphere arterial ischemic stroke. A, T1 FLAIR shows cortical hyperintensity of cortical laminar necrosis in the left hemisphere at 10 days of life in a neonate with a perinatal stroke (arrows). B, Axial T2 TSE is hypointense in the same cortical area (arrows). C, Axial SWI does not show evidence of susceptibility as would be expected with evolving hemorrhage (arrows). D, The SWI phase map confirms the absence of significant phase differences (arrows) that can be associated with hemorrhage (which appear as bright signal) or mineralization (which appear as dark signal). This child presented with focal seizures two days after delivery and was diagnosed with an arterial ischemic stroke. Cortical laminar injury is due to cerebral injuries that compromise cerebral metabolism and do not result in complete tissue necrosis. Here the insult was an arterial ischemic stroke.
Direct mechanical parenchymal injury
In this section we discuss brain injuries that occur as a direct result of the mechanical forces associated with trauma. Direct TBIs that will be discussed include cerebral contusions, diffuse axonal injuries, parenchymal lacerations, and hematomas.
Contusions
Contusions are one of the most common types of direct brain injury in accidental trauma. Contusions are often associated with focal neurologic deficits and, unlike diffuse axonal injury (DAI), loss of consciousness is uncommon. Contusions occur as a result of direct contact or rotational forces. With direct contact, an object strikes the stationary head, or the head impacts a surface, causing local in-bending of the skull, with or without a fracture. Compressive forces beneath the site of impact produce a local parenchymal injury (coup contusion) (Fig. 19.6). In contrast, on the opposite site of the impact, shear and distracting forces between the skull/dura and brain may cause a remote parenchymal injury (contrecoup contusion). With both direct contact and rotation, shearing forces can also occur between the skull/dura and brain as the brain moves relative to the skull causing parenchymal injury (43). With rotational forces, frontal and temporal regions are most commonly injured; the vertex, corpus callosum, and inferior cerebellum are less commonly involved (Figs. 19.6, 19.7). The associated hemorrhagic contusions are more prominent at the apices of the gyri (Figs. 19.6, 19.8).
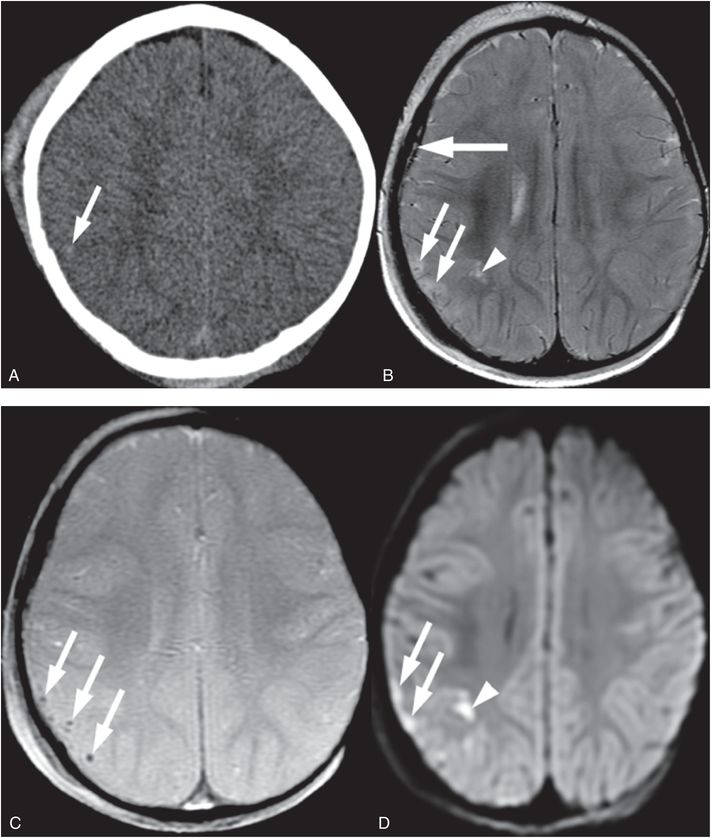
Figure 19.6 Right parietal fracture and contusion in a 14-month-old infant. A, Axial CT shows right frontal parietal soft tissue swelling and a suspected focus of hemorrhage (arrow) deep to a skull fracture that was better seen on bone windows (not shown). B, Axial T2 TSE better illustrates the edema in the cortex at the crests of the gyri (arrows) and in the cortex at the base of one deep sulcus (arrowhead). A small SDH is also noted (thick arrow). C, Axial GE T2WI obtained the next day better detects petechial hemorrhage (arrows) associated with the cortical contusions. D, Axial DWI shows increased signal due to cellular injury in the superficial (arrows) and deeper (arrowhead) components of the contusion. SS revealed multiple subacute posterior medial right rib fractures. No retinal hemorrhages were present. The history provided was a fall while in the care of the babysitter. This discordant history in addition to the subacute rib fractures raised concern for abuse and the authorities were notified.
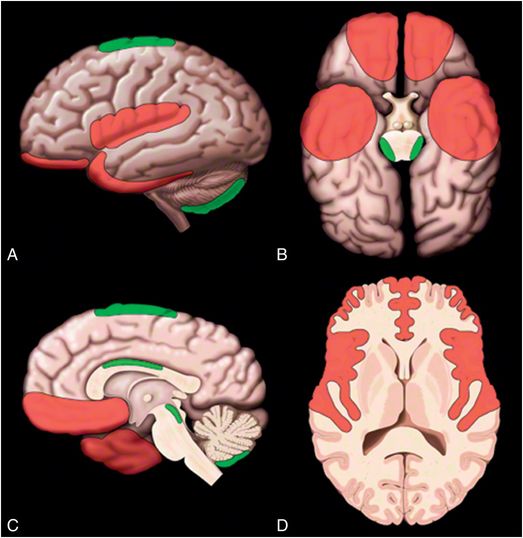
Figure 19.7 Common sites of contusion. A, Lateral surface; B, Inferior surface; C, Medial surface; and D, Axial cross-section images showing common locations for contusions in red and less common locations for contusions in green. Graphic used with permission from Amirsys, Inc., Osborn’s Brain: Imaging. Pathology and Anatomy, 2012.
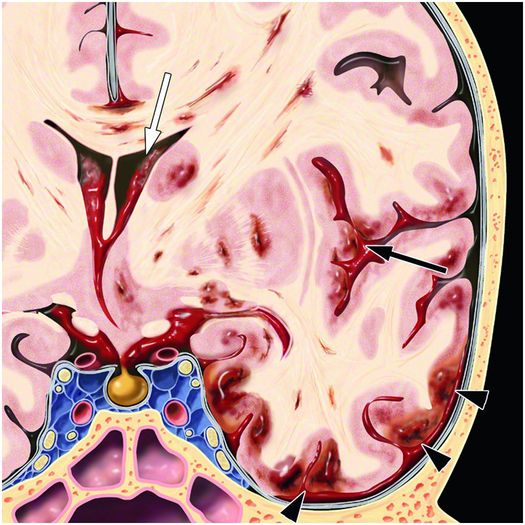
Figure 19.8 Coronal graphic illustrating distribution of hemorrhage due to rotational forces. Cortical hemorrhagic contusions are more prominent at the gyral crests (arrowheads). Shear forces cause foci of hemorrhage also in the white matter and deep-gray nuclei. Mass effect is due to the associated edema causing midline shift. IVH (white arrow) and SAH (black arrow) can also occur. Graphic used with permission from Amirsys, Inc., Osborn’s Brain: Imaging. Pathology and Anatomy, 2012.
Although small foci of cortical contusion are often apparent pathologically in AHT, these lesions are usually quite small and therefore may be missed or difficult to detect on CT (Fig. 19.6). Larger contusions can be detected on CT as mixed high and low attenuation (Fig. 19.9). Associated subarchnoid hemorrhage (SAH) or subpial hemorrhage may be seen as an associated feature. Hemorrhagic contusions will develop surrounding low-density edema in the first few days; however, time courses of evolutions are not well documented in the immature brain and are extrapolated from adult studies (44, 45). Small contusions and the associated blood products are easier to detect on MRI (Fig. 19.6). In particular, susceptibility-weighted imaging (SWI) and gradient echo (GE) sequences are particularly sensitive to the magnetic susceptibility properties of hemoglobin breakdown products and improve detection of subtle hemorrhage; Diffusion-weighted imaging (DWI) improves detection of nonhemorrhagic contusional injury (19, 46, 47).
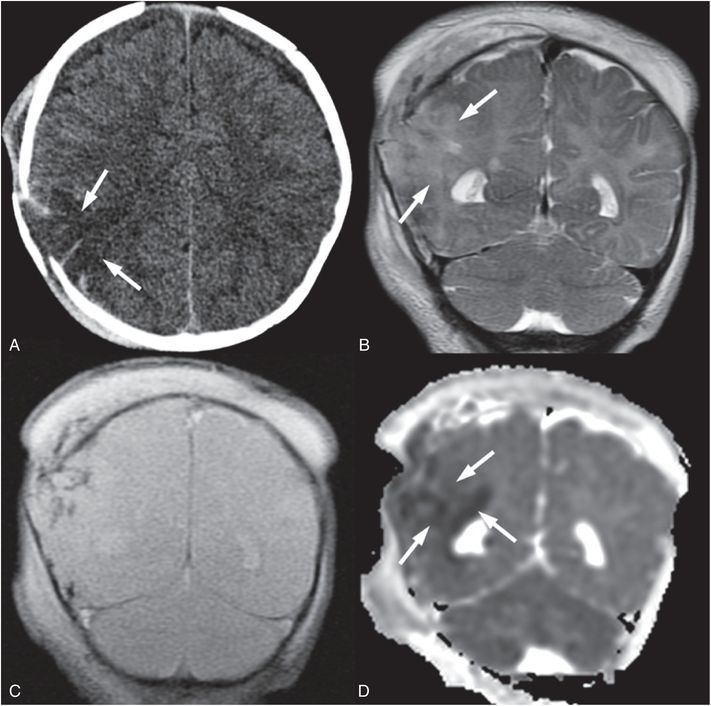
Figure 19.9 Cerebral contusion in a 3½-month-old infant. A, Axial CT shows area of low attenuation (arrows) mixed with high attenuation deep to a displaced right parietal fracture that was complex and branching on additional images (not shown). An overlying subgaleal hematoma is also evident. B, Coronal T2 TSE better delineates regions of cortical edema (arrows). C, Coronal GE T2 better identifies regions of hemorrhage as low signal. D, Coronal ADC map shows that much of the cerebral contusion is associated with decreased diffusivity (arrows). Additional images (not shown) raised concern of chronic frontal subdural collections. The caretaker reported that the injury occurred when the infant hit his head on the floor after a fall from approximately 3 ft. This discrepant history raised concern for abuse and authorities were notified. Apart from the known skull fracture, the SS was negative.
Contusions are more commonly noted in older children and adults suffering severe accidental head injury. Contusions are rarely seen in infants less than five months old, possibly due to the compliance and smoothness of the infant skull (48). Occasionally, older children can present with contusion due to abuse. As with accidental trauma, brain regions more commonly affected include the temporal and frontal lobes, especially along their anterolateral and inferior surfaces where they approximate the skull, lateral, and inferior surfaces of the peri-sylvian gyri, and the parasagittal cerebral cortex adjacent to the falx (Fig. 19.7). Less common sites include the gyral convexities, dorsal body of corpus callosum, dorso-lateral midbrain, and inferior cerebellum (Fig. 19.7) (49). Contusions are nearly always multiple and often bilateral.
Contusions typically evolve into focal encephalomalacia with cavitation, gliosis, and atrophic enlargement of the adjacent SAS.
Diffuse axonal (shear-strain) injuries
Diffuse axonal injuries (or traumatic axonal stretch injuries), like contusions, are one of the most common types of primary brain injury in accidental trauma. DAI is caused by rotational/angular forces or differential acceleration and deceleration. These mechanical forces result in traumatic axonal stretching leading to impaired axoplasmic transport, depolarization, ion fluxes, spreading neural depression, and local release of excitatory amino acids. DAI, unlike contusions, is typically associated with loss of consciousness at the time of injury (50). Because of the subtle nature of these injuries, symptoms can be out of proportion to imaging findings.
In 1989 Adams et al. proposed a grading system based on histologic findings that correlated with outcomes (51). Grade I is described as involvement of the cerebral hemispheres at the gray–white matter junctions, most often in the parasagittal frontal lobes and periventricular temporal lobe. Grade II also involves the corpus callosum. Grade III adds involvement of the brainstem. Thus, DAI involves deeper locations with increasing severity of the forces involved (Figs. 19.10, 19.11). Little data on infant accidental DAI exists with most studies beginning at two years of age or older (18, 52). DAI is also poorly documented in infants with inflicted trauma, but diffuse injuries have been reported as well as lesions in the corpus callosum, white matter, and brainstem (48, 53, 54). However, caution is needed in interpreting infant histology as HII, a common concomitant of abusive brain injury, can cause similar findings (54). Neonatal piglet models of rotational head injury found apnea, significant blood flow reductions, and worse axonal injuries associated with sagittal rotations. Less severe axonal injury was noted with axial rotations and minimal injury with coronal rotations (55). Histology on the same piglets showed SAH, ischemia and brainstem injury with sagittal and horizontal rotations but not with coronal rotations. Significant axonal injuries were associated with sagittal and horizontal rotations and were found predominantly in frontal and parietotemporal lobes.
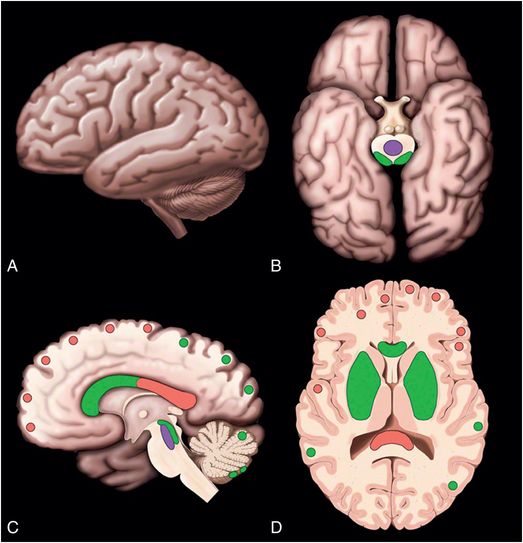
Figure 19.10 Location of DAIs. (A–D) Lateral, inferior, medial, and axial cross-section showing common locations of diffuse axonal injuries (DAI) in red. Less common locations of DAIs but locations associated with stronger forces are shown in green. Least common locations are shown in purple. Graphic used with permission from Amirsys, Inc., Osborn’s Brain: Imaging. Pathology and Anatomy, 2012.
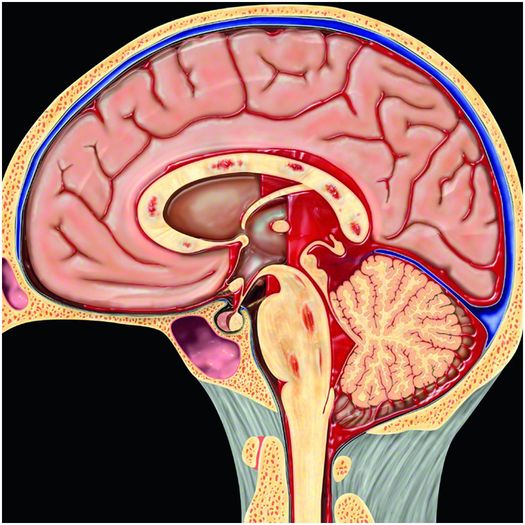
Figure 19.11 Hemorrhage due to DAI. Multifocal punctate hemorrhages in the corpus callosum and brainstem are typical imaging findings of DAI. Associated intraventricular and subarachnoid hemorrhage as shown here may also be present. Graphic used with permission from Amirsys, Inc., Osborn’s Brain: Imaging. Pathology and Anatomy, 2012.
When noted on CT, the characteristic appearance of DAI is multiple petechial high-attenuation foci or multiple low-density foci with diffuse edema within the deep white matter and, less commonly, central structures. The presence of intraventricular hemorrhage (IVH) or SAH within the basal cisterns about the brainstem are common associated findings. Both hemorrhagic and nonhemorrhagic DAI are more easily detected on MRI (56). Hemorrhagic DAI is identified as hypointensities on T2*-GE images or SWI. If imaged at least a few days after the hemorrhage, lesions can be seen as hyperintensities on T1-weighted imaging (WI). Nonhemorrhagic DAI is identified as hyperintensities on T2WI and as lesions of either increased or decreased diffusion on diffusion imaging in regions noted in Figures 19.10 and 19.11. For example, see the lesions in Figure 19.12. Large regions of decreased diffusion thought to be DAI may appear days after the initial event with tissue outcome varying from gliosis to apparently complete recovery by clinical and neuroimaging criteria (57). Hemorrhage and edema resolve as the injured axons degenerate and are phagocytized over several days to weeks with focal or diffuse atrophy with or without gliosis the end result. Diffusion tensor imaging (DTI) parameters such as mean diffusivity and FA, in addition to tractography, may be abnormal in accidental DAI both acutely and in the chronic state even when visual interpretation is normal (58–60). 1H-MRS may detect decreases in N-acetylaspartate (NAA) and increases in choline (Ch) relative to creatine (Cr) in TBI in the absence of imaging abnormalities (58). Resting state functional MRI (fMRI) is also beginning to detect differences in mild TBI (61). However, although DTI parameters, tractography, 1H-MRS, and resting state fMRT have the potential to detect occult abnormalities in AHT, no studies in AHT have been reported to date.
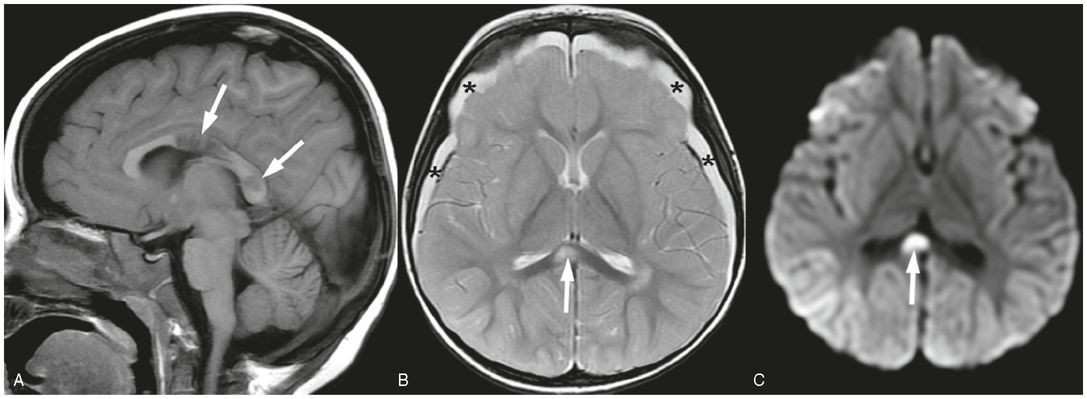
Figure 19.12 Shear injuries in a 21-month-old girl. MRI performed four days after admission. A, Sagittal T1 FLAIR image shows decreased signal in regions of corpus callosum axonal injury (arrows). B, Axial SE T2 shows bilateral subdural collections (*) and increased T2 signal in region of corpus callosum consistent with axonal injury (arrow). Subtle increased T2 signal in the right parietal cortex is concerning for ischemic injury. C, Axial trace DWI shows increased signal in the corpus callosum shear injury due to decreased diffusivity associated with the axonal injury. Subtle increased signal in right parietal cortex adds to the concern for ischemic injury. GE imaging demonstrated hemorrhage associated with the axonal injury in the body of the corpus callosum (not shown). This child also had a skull fracture (not shown). This infant was found unresponsive by the mother after being left with her boyfriend. In addition to the cerebral injuries and skull fracture, extensive retinal hemorrhages were found as well as multiple bruises. A SS, apart from the skull fracture, was normal. The lack of any trauma consistent with the extent of the injury raised concern for abuse. Authorities were notified and CPT was involved.
Parenchymal brain lacerations (contusional tears, contusional clefts)
The adult type contusions and white matter shear injuries described above are not observed in unmyelinated young infants. Instead a distinct form of white matter injury has been described in infants aged five months or younger after blunt head trauma. In 1955, Lindenberg presented the first descriptions of white matter tears (62). Then, in 1969, Lindenberg et al. and Freytag published one of the first descriptions of these white matter tears based on pathologic studies of 16 infants who had died as a result of traumatic injuries, 3 of which were abused (63). These authors coined the term “contusional tears,” describing grossly visible tears in the subcortical cerebral white matter, primarily within the orbital and superior frontal gyri, as well as within the temporal lobes. Subdural collections were a common association. Microscopically the margins of these white matter tears were typically smooth, hemorrhage was minimal, and necrosis was minimal or absent. In 1981, Ordia and colleagues described these findings on CT in a two-month-old child with irritability and seizures, using the term “contusional cleft” to describe the lesion (64). In 1984, Hausdorf and Helmke reported the sonography findings in these lesions (65). Although a few other examples of these white matter tears have been published (66), this type of injury is under-recognized as such injuries are unique to the poorly myelinated brain and have been observed in these pathologic studies only in infants aged five months or younger. Recently, MRI evidence of these tears have been reported in infants up to 11 months of age (67). At this early stage the high water content of the white matter gives it the consistency of gelatin and unlike the mature skull, the infant skull with nonfused sutures is very pliant. These lesions are thought to be white matter tears resulting from shear strains secondary to blunt impact and perhaps rotational forces such as shaking. To describe them, we prefer the term ?parenchymal brain lacerations? as in the most recent report (67). This permits a distinction from the more typical DAI, and also from contusion patterns seen in the myelinated brain, where focal regions of cortex as well as white matter are involved, often with necrosis and hemorrhage. These parenchymal lacerations, unique to the unmyelinated brain, are likely under-reported.
The imaging features of white matter parenchymal brain lacerations are characteristic. These lacerations are usually observed in the frontal, temporal or occipital lobes. Typically the lacerations are small, bilateral, and confined to the subcortical white matter (63). Because the lesions dissect along white matter planes, they are typically larger in their sagittal and vertical dimensions than in their transverse dimension. Head US can detect these lesions when they are accessible to the transducer window (Fig. 19.13). Because the lesions tend to contain fluid of low echogenicity, the lacerations are easily distinguished from the surrounding cerebral parenchyma. Furthermore, there is typically an echogenic margin around the lesion that may correspond to petechial hemorrhage reported pathologically (63, 66). On high-quality axial CT differentiating these lesions from a prominent sulcus is generally straightforward; however, coronal and sagittal reformations are helpful. Evidence of hemorrhage is often inconspicuous or absent, although blood products may produce a fluid level within the dependent portion of the lesion. Associated subdural collections are common (Fig. 19.14). On MRI the lacerations typically contain fluid similar in signal to CSF. Again blood-fluid levels may be seen, especially with SWI, and often multiple additional small foci of hemorrhage and subarchnoid hemorrhage are noted (see Fig. 19.10). Decreased diffusion is not always evident around the margins of the lacerations, consistent with the pathologic findings of minimal surrounding tissue reaction. T1 hyperintensities reflecting methemoglobin may be visible within the lesion beginning approximately 2–3 days after the hemorrhage (Fig. 19.15). Although the lesions are typically located in the subcortical white matter, the lacerations may extend through the cortex to the surface of the brain. Occasionally, these subcortical lesions may extend more deeply through the white matter to the subependymal region (64). With severe injury, lacerations may be multifocal and involve both subcortical and deep white matter (66). Diffuse white matter vasogenic edema can be seen in association with these lacerations, and may increase over the first week. Caution must be used when dating these injuries, as the temporal evolution of these lacerations is poorly understood due to lack of documentation. We have observed prolonged evolution with lacerations increasing in size despite the absence of decreased diffusion. Instead, white matter vasogenic edema developed between MRI studies performed at 3 and 14 days (Fig. 19.16). Thus, evolving lesions may not be associated with decreased diffusion; lacerations without associated decreased diffusion should not be mistaken for chronic cystic encephalomalacia from prior venous or arterial infarction. Surrounding white matter edema and recent hemorrhage in the correct clinical setting can help distinguish parenchymal lacerations from cystic encephalomalacia. Also repeat imaging to illustrate evolution over time is helpful to confirm the lacerations are acute if in doubt (Fig. 19.16). In the end, lacerations persist but collapse over time.
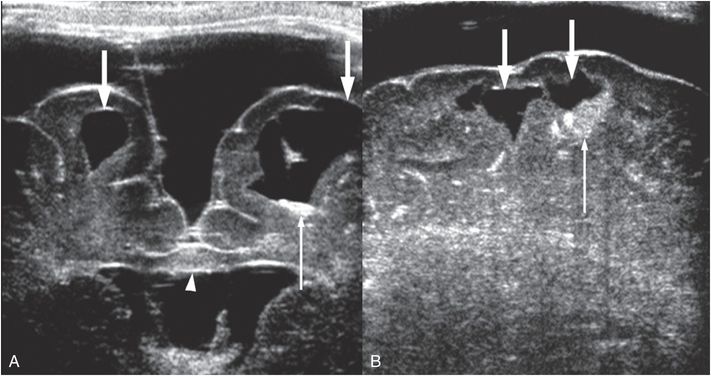
Figure 19.13 Parenchymal brain lacerations on Head US. (See same infant in Figs. 19.14, 19.15, 19.16, 20.3, 21.72.) A, Coronal HUS in a 44-day-old infant showing bilateral parenchymal brain lacerations (thick arrows) with the cleft on left extending through the cortex to the pia. Increased echogenicity within the left cleft is due to blood products (thin arrow). Mass effect and increased echogenicity in the corpus callosum (arrowhead) is hemorrhage and edema from shear injury. Bilateral subdural collections similar to CSF are also present, left greater than right. B, Sagittal Head US of the right frontal lobe obtained during the same session also shows parenchymal brain lacerations (thick arrows) with blood products (thin arrow).
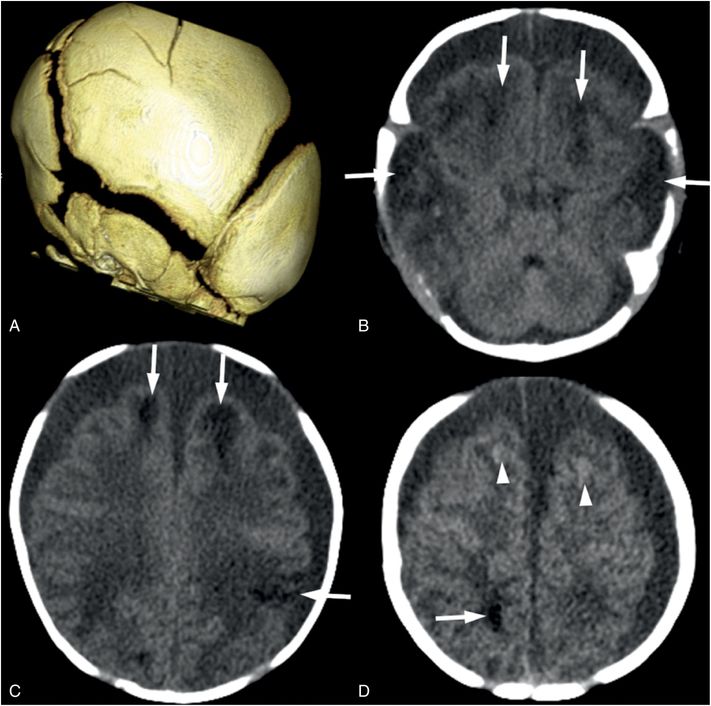
Figure 19.14 Parenchymal brain lacerations on CT. (See same infant in Figs. 19.13, 19.15, 19.16, 20.3, 21.72.) A, The 3D surface reconstruction from the head CT shows widened sutures due to increased intracranial pressure and multiple linear fractures in the parietal bone. B, Axial CT image shows bifrontal and bitemporal parenchymal brain lacerations (arrows) with no frank hemorrhage noted. C, D, Axial CT at higher levels in the same subject showing additional lacerations (arrows) with subtle hemorrhage (arrowheads). Bilateral subdural collections similar in attenuation to CSF are noted on all axial images.
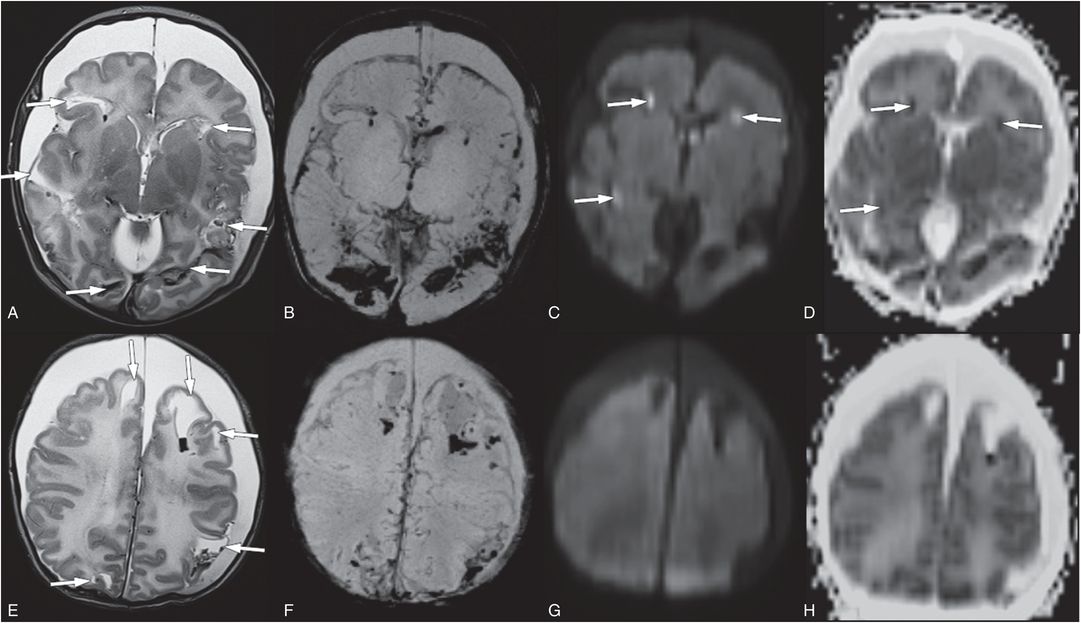
Figure 19.15 Parenchymal brain lacerations on MRI. (See same infant in Figs. 19.13, 19.14, 19.16, 20.3, 21.72.) A, E, Axial T2 TSE shows multiple parenchymal brain lacerations (arrows) with blood projects in many tears. B, F, SWI maximum intensity projection (MIP) images better illustrate parenchymal blood products and SAH. C, G, Only a subset of the parenchymal brain lacerations have associated bright diffusion signal (arrows). These areas have decreased diffusion on ADC maps D and H. The bilateral subdural collections have minimal blood products and are largely CSF-like in signal intensity. Note the diffuse white matter edema seen on E and H as increased signal.
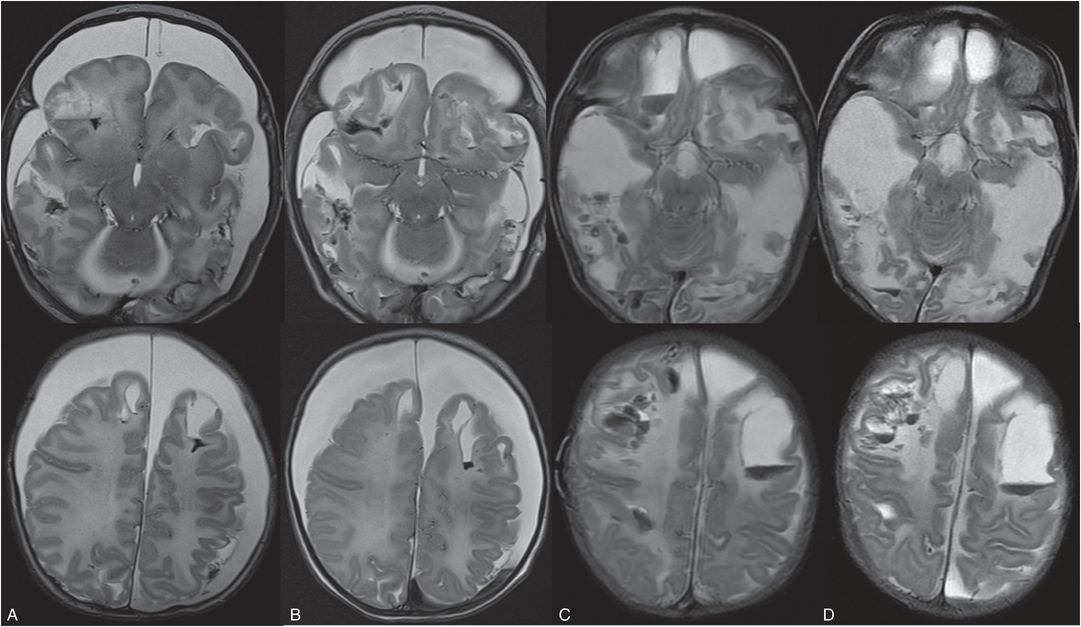
Figure 19.16 Evolution of parenchymal brain lacerations on MRI. (See same infant in Figs. 19.13, 19.14, 19.15, 20.3, 21.72.) Axial T2 TSE on the day of admission (A), 3 days (B), 14 days (C), and 20 days (D) after admission showing progressive liquifaction of the brain and new hemorrhages while in the hospital. These areas of liquefaction were not associated with prior bright DWI and/or decreased ADC signal. This 5 week old former 35-week preterm infant initially presented prior to this admission with vomiting. Pyloric stenosis was ruled out and the infant sent home. The infant was brought back to the ER two days later with continued vomiting and concern for dehydration. Shortly after admission seizures developed. The lack of any relevant history of trauma raised concern for abuse. SS revealed multiple healing rib fractures, proximal femoral fractures, a left acromial fracture, an inferior right scapular fracture and a left distal tibial fracture. There were no retinal hemorrhages. The authorities were notified and the CPT was involved.
Hematoma
As noted above, parenchymal hemorrhages are often associated with both contusions and DAI and may be seen in association with parenchymal lacerations. However, large cerebral hematomas are an unusual finding in AHT and if thalamic, parasagittal, or in the inferior temporal occipital region raise concern for venous sinus thrombosis with or without coagulopathy.
As with extra-axial hemorrhage, the evolution of parenchymal hemorrhage is complex and influenced by a number of factors such as tissue pH and local oxygen concentration (68). Coagulopathies can also influence evolution. In addition, timing of hemorrhages largely comes from adult studies. Infant studies are lacking but the small amount of neonatal data available suggests similar timing (69). In addition, field strength and sequence type can influence timing. For example, a bright T1 signal will appear earlier at lower field strengths due to the shorter T1, and a low T2 signal will be evident earlier on GE or susceptibility sequences compared to T2 turbo spin echo (TSE). Therefore, exact dating is impossible and similar broad dating as provided in Table 18.2 is recommended. Note that MRI provides a narrower window of age than CT if deoxyhemoglobin is identified. Therefore, it is important to consider MRI on admission if CT documents the presence of hemorrhage. The absence of methemoglobin on admission helps narrow the time of onset to within approximately three days. Once blood reaches the methemoglobin phase, timing becomes much broader. Thus, it is important to perform MRI early to provide the most precise dating of hemorrhage.
Retinal hemorrhages, although typically identified on ophthalmologic exam, may occasionally be evident on high-quality, high-resolution CT or MR images (Fig. 19.17). However, there are not reports to date on the detection of hemorrhage within the optic nerves, which has been documented on autopsy.
Figure 19.17 Retinal hemorrhages on MRI. This 17-month-old girl reportedly fell 2–3 ft from a couch in presence of babysitter. In the ER she was noted to be unresponsive with a tongue laceration. Axial T2 TSE shows retinal hemorrhages (arrows). (See same patient in Figs. 17.14, 19.25, 19.26, 20.4, 21.26.)
Additional extra-axial blood products often seen in AHT, as well as a more detailed description of hemorrhage evolution, are described in Chapter 18.
Secondary parenchymal injuries
Many types of secondary brain injury can occur due to abuse. Here we discuss a number of brain injury patterns and provide possible etiologies with a discussion when etiologies are controversial.
Anoxia/suffocation
Suffocation occurs where there is lack of oxygen to the brain in the presence of maintained cerebral perfusion. Suffocation can occur due to environmental lack of oxygen, blockage of the mouth and nose, blockage of the trachea or bilateral bronchi, severe impairment of oxygen exchange in the alveoli, external forces that prevent inspiration, or lack of central drive as in severe apnea (70). In abuse, suffocation can occur due to blockage of the mouth and nose, mechanical compression of the chest, or severe apnea (71, 72). The imaging finding thought to be associated with anoxia is called the “reversal sign” or the “bright cerebellum sign”, where the supratentorial parenchyma is diffusely low in attenuation, with or without preservation of the gray–white junction, compared to the cerebellum (Fig. 19.18) (73, 74). However, the specificity of this reversal sign for pure anoxia is unclear and in many reported cases there was likely associated ischemia. Caution must be used when assessing the attenuation of the cerebrum relative to the cerebellum, as normally the cerebellum is brighter than the cerebrum (Fig. 19.19). Poor gray–white contrast, effacement of sulci, and/or additional intracranial findings in an unconscious infant should raise concern for a “bright cerebellum” sign.
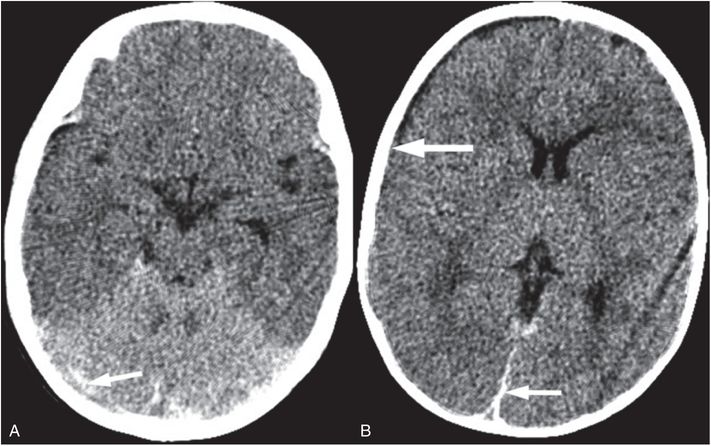
Figure 19.18 Bright cerebellum sign. (See same infant in Fig. 19.3.) Axial CT in an unresponsive six-month-old shows the cerebellum to be bright relative to the cerebrum. The cerebrum is diffusely low in attenuation with decreased gray–white distinction. Also noted are small SDHs in the posterior interhemispheric region and along the tentorium (arrows). In addition, subtle extension of the SDH over the right hemisphere (thick arrow) is seen. The bright cerebellum sign raises concern for apnea or suffocation. In this case the caretaker admitted to shaking and brain injury is hypothesized to be due to severe apnea secondary to shaking.
Figure 19.19 Normal relatively bright cerebellum in a three-month-old infant. Axial CT in a 3-month-old infant with witnessed 3-ft fall, no neurologic signs or symptoms, and a normal CT. Note the good gray–white distinction on this normal head CT as compared to Fig. 19.18.
Other studies have documented bilateral symmetric white matter injury in anoxic injury in adults, which may extend to involve cortex (75). Bilateral symmetric white matter injury with areas of cortical involvement with relative sparing of the deep-gray nuclei have been reported in infants and young children (6). In these cases the white matter injury appears as diffuse decreased diffusivity throughout the white matter that can be delayed for approximately two days after presenting with respiratory arrest (Fig. 19.20). These findings are similar to adult reports of delayed post-hypoxic leukoencephalopathy that have been observed between 2 and 40 days after an anoxic episode (76).
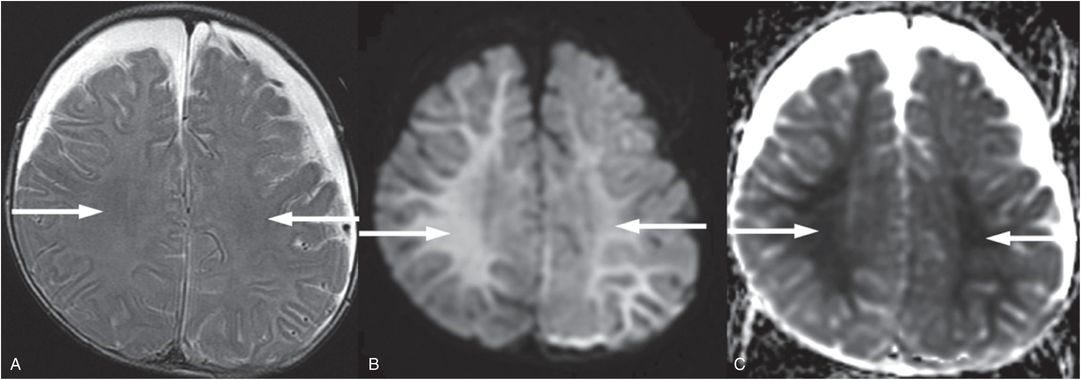
Figure 19.20 Anoxic brain injury in a seven-month-old infant. Axial T2 TSE (A), axial DWI (B), and axial ADC map (C), illustrate subtle increased T2 signal in A, marked increased signal in B, and marked decreased signal in C throughout the white matter (arrows) four days after severe respiratory distress. In addition bilateral subdural collections are present with recent blood products posteriorly seen on additional images not shown here. The lack of a relevant history raised concern for abuse. The SS was normal. Preretinal, intraretinal, and subretinal hemorrhages were identified and increased concern for abuse. The authorities were notified and the CPT was involved.
Strangulation
Strangulation occurs when external pressure decreases carotid artery perfusion to the brain, thus depriving the brain of oxygen and blood flow. Occlusion of the carotid arteries can lead to significant cerebral injury or death because the vertebral arteries alone cannot provide sufficient blood flow to immediately compensate for lack of carotid supply (77). In addition, if there is sufficient jugular vein compression, cerebral swelling and hemorrhage can occur, and tracheal compression may compromise oxygen supply. Reports of imaging patterns are scarce and primarily limited to the adolescent or adult population in the context of near-hanging, where bilateral basal ganglia and caudate involvement similar to cardiac arrest have been reported with a case presenting six days after the event (Fig. 19.21) (78, 79). In 1987, a CT study of three infants with abuse and strangulation injuries reported large territorial infarcts and small subdural hematomas (SDHs) (80). No other studies addressing the imaging findings and evolution of strangulation injuries in the immature brain were found.
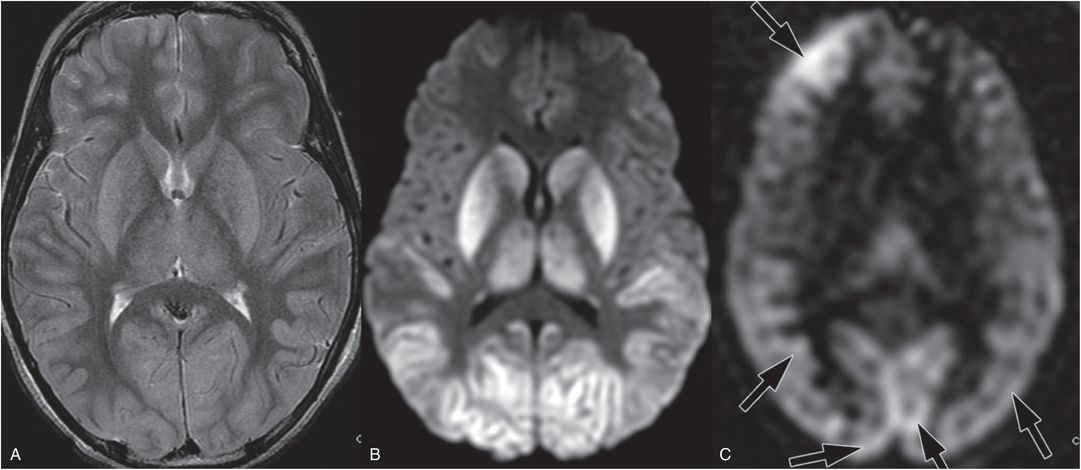
Figure 19.21 Acute MRI after near-hanging in a 12-year-old boy. This child was found by his brother in his closet with his belt around his neck. When emergency services arrived the child had severe cardiorespiratory compromise. The MRI was performed three days after admission. A, Axial T2 TSE shows deep-gray nuclei and posterior temporal and occipital cortical edema and swelling. B, Axial DWI showing associated increased signal that corresponded to decreased mean diffusivity on the ADC map (not shown). C, Axial ASL showing posterior and right frontal hyperperfusion (arrows). Imaging findings in this case are similar to cardiac arrest, probably due to severe cardiorespiratory compromise.
Related posts:

Stay updated, free articles. Join our Telegram channel

Full access? Get Clinical Tree


