Etiology
Pulmonary embolism (PE) refers to blood clot(s) within the pulmonary arterial system, usually caused by migration of deep vein thrombosis (DVT) from the lower extremities. Rarely, emboli are from other sources, such as the iliac veins, renal veins, inferior vena cava, right heart chambers, or upper extremity veins. More recently, there are speculations of PE developing de novo. Risk factors for PE are the same as those for DVT, including immobilization, trauma, surgery, active malignancy, prior history of venous thromboembolism (VTE), pregnancy, use of oral contraceptives, indwelling catheters, and hereditary hypercoagulable states, such as deficiency of protein C or S.
Prevalence and Epidemiology
The reported incidence for PE ranges from 29 to 78 per 100,000 person-years. The incidence rates increase with age. An increase in the incidence rate from 2001 to 2009 has been observed, thought to reflect, at least in part, increased use of multidetector computed tomography (MDCT) and improved image resolution. In a recent study, 54% of all PE in oncologic patients and 19% of all PE in non-oncologic patients are diagnosed incidentally on CT performed for purposes other than to look for PE, such as for cancer restaging or evaluation of pleural effusions or pneumonia. The recurrence rate of PE is 15 to 29 per 100,000 person-years.
PE is the third most common cause of cardiovascular death after myocardial ischemia and stroke, with an untreated mortality of 30%. The mortality rate is lower with treatment, although it is estimated that in one-quarter of patients experiencing PE, the initial clinical presentation is sudden death. Predictors of poor survival after PE include syncope and systemic hypotension.
Clinical Presentation
The clinical manifestations of acute PE depend on several factors that individually or in combination influence the effect of vascular occlusion on the lung parenchyma: the presence or absence of associated cardiopulmonary disease; the size, number, and location of emboli; the presence of multiple embolic episodes and the time interval between them; and the rate of thrombus organization and lysis, whether spontaneously or with therapy. The most common symptoms are dyspnea, tachypnea, and pleuritic chest pain. A sudden onset of these symptoms in the absence of underlying respiratory disease is highly suggestive of acute PE. On the contrary, the clinical diagnosis of acute PE is difficult in patients with chronic respiratory diseases, and this situation is exemplified by patients with chronic obstructive pulmonary disease (COPD), in whom acute PE may mimic COPD exacerbation.
The clinical probability assessment, an important component of strategies for optimal diagnosis of acute PE based on noninvasive tests, is therefore much more helpful in patients devoid of underlying cardiopulmonary disease than in patients with COPD. Various clinical probability assessment scores have been validated—the Wells score, the Geneva score (recently revised), and the Pisa score. The use of a combination of clinical probability scores and serum D-dimer test, which has a very high negative predictive value for VTE, has been shown to be effective in reducing the use and improving the positive yield of computed tomography pulmonary angiography (CTPA) and is recommended by the American College of Physicians’ Best Practice Advice in the evaluation of patients with suspected acute PE. Both the American College of Radiology Appropriateness Criteria and American Thoracic Society and American College of Chest Physicians Choosing Wisely campaign stated that CTPA should not be performed in patients with a low clinical probability and negative result of a highly sensitive D-dimer assay.
Pathology
The potential consequences of acute PE are hemorrhage or, less commonly, infarction within the lung parenchyma; acute pulmonary hypertension; and right ventricular dysfunction. The last is sometimes responsible for left ventricular failure because of impairment of left ventricular preload and decreased coronary arterial perfusion.
In most cases PEs are degraded through the effects of fibrinolysis. Less commonly, they may break down into small fragments that embolize to the peripheral arterial branches. Delayed recanalization can also be seen with creation of multiple small vascular channels within the endoluminal clot.
The effect of thromboemboli in individual patients is influenced by the degree of obstruction of the pulmonary circulation, the presence and extent of underlying lung abnormalities, and the status of the patient’s fibrinolytic system.
Manifestations of the Disease
Radiography
The chest radiograph has an important role in excluding other diagnoses that can mimic the clinical picture of acute PE, such as a pneumothorax or pneumonia. The chest radiograph, however, is both insensitive and nonspecific in the diagnosis of acute PE.
The radiographic manifestations of acute PE include a spectrum of abnormalities ranging from a normal chest radiograph to a series of focal changes reflecting the pleural or parenchymal consequences of acute pulmonary vascular obstruction.
Radiographic Features Observed in the Absence of Infarction or Hemorrhage
Peripheral oligemia caused by obstruction of the pulmonary artery or vasoconstriction of distal hypoxic lung result in peripheral hyperlucency, referred to as the Westermark sign ( Fig. 50.1 ).

Dilatation of a major pulmonary artery (Fleischner sign; see Fig. 50.1 ) is identified more easily in the right hilum and can be seen in conjunction with a truncated appearance of the enlarged vessel, reflecting the arterial amputation. These findings are seen only in patients with massive acute PE.
Radiographic Features Suggestive of Infarction or Hemorrhage
Pulmonary consolidation in acute PE is usually due to parenchymal hemorrhage and edema. On occasion, it may be the result of pulmonary infarction. Infarction is suggested by the finding of a homogeneous wedge-shaped consolidation in the periphery of the lung, with a rounded, convex apex toward the hilum, referred to as the Hampton hump ( Fig. 50.2 ). Cavitation can occur but is rare. The pattern of resolution of infarction has been described as the “melting ice cube” sign, where the opacity retains its typical shape as it resolves. This feature helps differentiate this entity from pneumonia.

Additional Findings
Pleural effusion can be seen, either as an isolated abnormality or, more commonly, in patients who have infarction or hemorrhage. Acute PE may also be responsible for radiographic features suggestive of right-sided cardiac dysfunction, such as dilatation of the azygos vein and superior vena cava, reflecting systemic venous hypertension. Radiographic findings of pulmonary arterial hypertension are rarely observed.
Computed Tomography
With the advent of MDCT technologies resulting in short image acquisition time and improved image quality, CT pulmonary angiography (CTPA), with high sensitivity and specificity, has become the imaging modality of choice in the evaluation of suspected PE.
Computed Tomography Findings
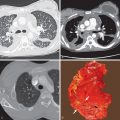
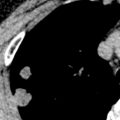
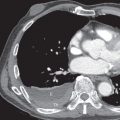
The CT criteria for acute PE are partial or complete filling defects within a contrast-opacified pulmonary artery ( Fig. 50.3 ). A partial filling defect is defined as an intravascular central or marginal area of low attenuation surrounded by a variable amount of contrast material ( Fig. 50.4 ; see also Fig. 50.3 ). A variant has been described as the “railway track” sign when the endoluminal clot is surrounded by a rim of contrast material on both sides. A complete filling defect is defined by an intraluminal area of low attenuation that occupies the entire cross-section of the vessel ( Fig. 50.5 ; see also Fig. 50.3 ). The involved pulmonary artery branch may dilate in the setting of acute PE, particularly if the embolus is occlusive. On noncontrast CT hyperattenuation within the central pulmonary arteries should raise suspicion for PE. This is referred to as the hyperdense lumen sign, which has poor sensitivity but high specificity ( Fig. 50.6 ).


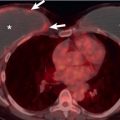
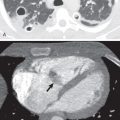
Indirect findings of PE include peripheral areas of consolidation or ground-glass opacities resulting from pulmonary hemorrhage or infarction and pleural effusions ( Fig. 50.7 ). The reverse halo sign, where an area of ground-glass opacity is surrounded by a rim of consolidation, has been described for pulmonary infarction. The reverse halo sign, when observed in the subpleural lung, should prompt consideration or search for PE. Areas of decreased attenuation and vascularity in affected portions of lungs may occur but are uncommon in acute PE ( Fig. 50.8 ).


In the absence of endovascular defects to suggest acute PE, analysis of lung, pleural, and mediastinal compartments can often help identify an alternative explanation for the patient’s symptoms.
Assessment of Pulmonary Embolism Severity.
The prognosis and optimal therapy for patients with PE are strongly influenced by the presence or absence of hemodynamic events. Recent management guidelines classify patients as those with massive PE, submassive PE, and nonmassive PE. Massive PE, defined by signs of hemodynamic instability, such as shock and/or a systolic blood pressure less than 90 mm Hg, is an indication for thrombolysis. Submassive PE refers to acute PE without systemic hypotension but with right ventricular dysfunction on CT or echocardiogram and/or signs of myocardial necrosis. These patients have a guarded prognosis and are usually not suitable for outpatient treatment, which is increasingly used in patients with nonmassive PE. As most PE is now diagnosed on CTPA, attention has been directed to the use of morphologic criteria on CT scans to investigate the severity of acute PE, relying on the recognition of signs indicating right-sided heart failure, quantification of the obstruction of the pulmonary arterial bed, and evaluation of lung perfusion. The right ventricle to left ventricle–diameter ratio of greater than or equal to 1, measured on axial images ( Fig. 50.9 ), has been shown to have the best predictive value of poor clinical outcome and death. Ventricular diameters are measured as the maximum distance from the interventricular septum to the endocardial border perpendicular to the long axis of the ventricular chamber. Each axial ventricular diameter is measured on the axial image, where it is largest. Other CT findings of right heart strain, such as bowing of the interventricular septum and reflux of intravenous contrast into the inferior vena cava or hepatic veins, are less reliable ( Fig. 50.10 ).


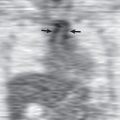
Scoring systems such as the Quanadli index have been developed to quantify clot burden but are not in common clinical use as they are cumbersome. The most proximal level of pulmonary artery involvement should, however, be reported as this finding does have treatment implications. For patients with subsegmental PE ( Fig. 50.11 ) and no proximal DVT in the legs, who have a low risk for recurrent VTE, clinical surveillance is recommended over anticoagulation. In selected patients with acute central PE, catheter-assisted or surgical embolus removal is an option.

Dual-energy CT, with datasets acquired at different tube voltage levels, allows creation of perfusion maps similar to scintigraphy. Wedge-shaped pulmonary parenchymal perfusion defects distal to PE can be visualized ( Fig. 50.12 ). These perfusion maps improve the detection of peripheral PE, and the extent of perfusion defects has been correlated with adverse clinical outcome.