Advanced MR imaging techniques, such as spectroscopy, perfusion, diffusion, and functional imaging, have improved the diagnosis of brain tumors in children and also play an important role in defining surgical as well as therapeutic responses in these patients. In addition to the anatomic or structural information gained with conventional MR imaging sequences, advanced MR imaging techniques also provide physiologic information about tumor morphology, metabolism, and hemodynamics. This article reviews the physiology, techniques, and clinical applications of diffusion-weighted and diffusion tensor imaging, MR spectroscopy, perfusion MR imaging, susceptibility-weighted imaging, and functional MR imaging in the setting of neuro-oncology.
Key points
- •
A combination of conventional and advanced MR imaging sequences is recommended to make the correct diagnosis in pediatric patients suspected to have a brain tumor.
- •
In the work-up of brain tumors at least diffusion-weighted imaging/diffusion tensor imaging, MR spectroscopy (MRS), and a perfusion MR technique should be included in the imaging protocol.
- •
MRS data may play an important role in assessing therapeutic response and therefore should be interpreted by experienced neuroradiologists.
- •
Arterial spin labeling is a promising noninvasive perfusion sequence that may become an important biomarker for tumor diagnosis and tumor grading.
- •
Future advances in molecular biology will alter neuroradiologic concepts and thinking and add information to that obtained from conventional and advanced MR imaging techniques, which will benefit pediatric patients with brain tumors.
Introduction
Imaging of brain tumors has significantly improved with the use of advanced magnetic resonance (MR) techniques, such as MR spectroscopy (MRS), perfusion-weighted imaging, diffusion-weighted imaging (DWI), diffusion tensor imaging (DTI), susceptibility-weighted imaging (SWI), and functional MR (fMR) imaging. Conventional MR imaging techniques provide anatomic/structural information about the brain. Unlike conventional imaging, advanced MR techniques also provide physiologic and functional information concerning metabolism; hemodynamics; and, with diffusion-weighted technique, information on brain tumor cellularity. Recently, the introduction of DNA methylation profiling for molecular classification has been proposed, which outperforms the current histopathologic classification and thus might serve as a basis for the next World Health Organization classification scheme for central nervous system (CNS) tumors. In the future, this may have a great impact on the correlation between advanced imaging assessment and the newly proposed molecular classification. This overview is based on the literature between the currently used histopathologic classifications of pediatric brain tumors and their characteristics on advanced MR imaging techniques. In the near future it will be mandatory to scan with advanced imaging protocols in all pediatric brain tumors, classified by their molecular phenotype to reevaluate their diagnostic value.
The most useful clinical applications of these advanced MR techniques in pediatric brain tumors, stratified by the current classification, are discussed here.
- 1.
DWI approaches (DWI, DTI, diffusion kurtosis imaging [DKI])
- 2.
MRS (single-voxel [SV] imaging, and chemical shift imaging [CSI])
- 3.
Perfusion-weighted techniques (dynamic susceptibility contrast [DSC] technique; dynamic contrast-enhanced [DCE]; and arterial spin labeling [ASL], a noncontrast technique)
- 4.
Other advanced MR imaging sequences, useful for diagnosis and presurgical planning in children suspected to have a brain tumor (SWI and fMR imaging)
Diffusion-Weighted Imaging Technique (Diffusion-Weighted Imaging, Diffusion Tensor Imaging, Diffusion Kurtosis Imaging)
DWI is commonly used by (pediatric) neuroradiologists in everyday clinical practice. Although it is no longer a novel imaging technique, it provides information that is not obtainable using conventional MR sequences and is therefore discussed in this article.
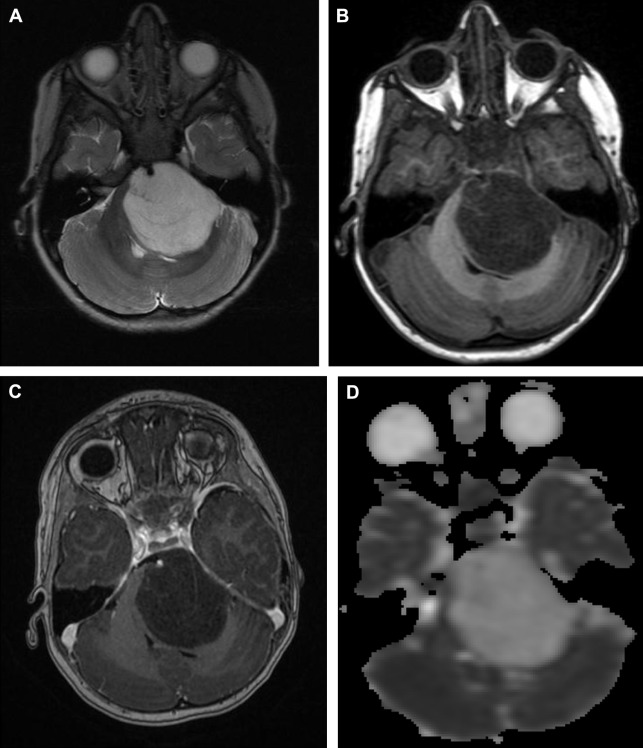
The additional information is obtained by measuring the mobility of water molecules, assuming a process of random, unrestricted, but potentially hindered diffusion. The diffusion probability distribution function, the chance of a particular proton diffusing from one location to another in a given time, is thus considered a gaussian distribution, with the standard deviation relating to the apparent diffusion coefficient (ADC). The ADC value depends on the complexity of the cytoarchitecture, determined by, for example, cell membranes, intracellular organelles, and the rapid exchange of protons between different compartments ( Fig. 1 ). The cytoarchitecture of the tumor can inhibit random brownian motion and thus causes water diffusion to deviate from strict gaussian behavior. This restricted diffusion appears hyperintense on the diffusion trace map and dark on the ADC map ( Fig. 2 ). In clinical practice and research, ADC maps and ADC values have been used to assess tumor cellularity and tumor grade ( Fig. 3 ). Recently, Poretti and colleagues showed that tumor grade as estimated by ADC values could be better assessed only from the solid, contrast-enhancing part of the tumor rather than the entire tumor. Further, ADC values can also be used to assay treatment response and detect tumor recurrence and even to differentiate tumor recurrence from pseudoprogression.
Although mainly used in the treatment scheme of high-grade gliomas in adults, antiangiogenic drugs may also be a treatment option in pediatric patients with brain tumors. DWI based on ADC analyses is less affected by vascular permeability changes caused by antiangiogenic treatment than contrast-enhanced T1-weighted imaging and is therefore a good imaging marker of treatment outcomes. However, clinicians should beware of areas of restricted diffusion that may appear after antiangiogenic treatment, which were stable on follow-up MR imaging studies, and therefore are more consistent with necrosis than tumor recurrence/progression.
There are studies focusing on treatment-induced changes in ADC values by comparing pretreatment and early posttreatment measures. Some reports even advocate the use of functional diffusion map methods by voxel-wise subtraction of the pretreatment and posttreatment ADC maps for accurate assessment of changes in ADC values at all tumor locations. Also ADC value changes over time, suggesting that serial MR (DWI) imaging may be useful to investigate possible changes in volume of low-ADC regions within the tumor.
Although the results from DWI and quantitative ADC look promising and DWI imaging is easy and quick to perform, clinicians should keep in mind that variations in equipment (even from the same brand) and acquisition parameters can result in significant differences in calculated ADC values. Even using ratios by comparing with normal-appearing brain tissue as a reference may produce inconsistent results. This possibility is especially important in follow-up scanning, making it sometimes more difficult to differentiate between tumor growth and necrosis. Second, brain tumors may become more heterogeneous after treatment, which may influence ADC values and result in inaccurate diagnosis of tumor progression. Some investigators suggest histogram-based methods but this is a time-consuming approach.
Diffusion tensor imaging
The diffusion-weighted technique not only uses the magnitude of the diffusion but can also provide the direction of diffusion and is therefore sensitive to directional movements of water molecules using DTI. DTI has been used extensively for the identification of functional white matter tracts in vivo. In neuro-oncology, DTI has the potential to establish spatial relationships between normal-appearing white matter and tumor borders and provide clinically valuable information on possible progression of tumor into the surrounding white matter tracts and visualization of displacement or loss of white matter tracts as a result of tumor behavior and postoperative status.
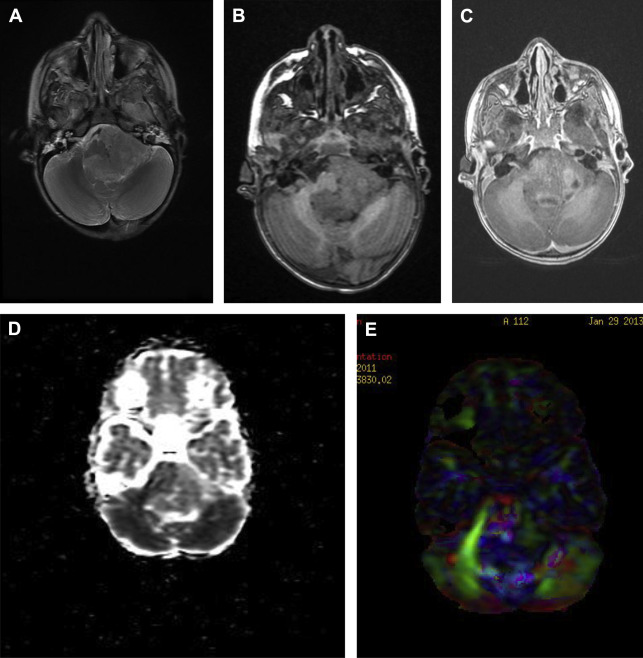
In gray matter, it is usually sufficient to characterize diffusion properties with a single ADC, because measured water diffusivity is largely independent of the orientation of the tissue. However, in anisotropic areas, such as white matter, where diffusivity is known to depend on the orientation of the tissue, a single ADC is not able to describe the orientation-dependent water mobility in the tissue. Brain tumors not only invade gray matter but also white matter and may severely displace white matter tracts ( Fig. 4 ). To avoid accidental resection or transection of important white matter tracts, accurate localization of these tracts may be obtained using DTI.
If the decision is surgery, DTI can address issues such as the best surgical approach to avoid damage to major white matter tracts, minimizing adverse neurologic outcomes.
Diffusion kurtosis imaging
Recently, van Cauter and colleagues showed that DKI is better at distinguishing between low-grade and high-grade gliomas in adults than DTI or the most simple approach, DWI. The investigators stated that, using DKI, additional information on microstructure and microdynamics in gliomas could be obtained by exploring nongaussian diffusion properties. This ability is helpful in differentiating between low-grade and high-grade gliomas. DKI uses a similar pulse sequence to those used in DWI and DTI. However, the important difference is the use of higher and at least 2 nonzero b-values. The advantage of DKI is that, besides kurtosis parameters (axial, radial, and mean kurtosis), it also generates all conventional DTI parameters (fractional anisotropy, radial diffusivity, axial diffusivity, and mean diffusivity) and therefore allows comparison with published DTI data on brain tumor grading. Another advantage of using higher b-values is that the diffusion signal decay is no longer monoexponential, and may result in greater imaging contrast between different tissue types, and may improve brain tumor characterization. A disadvantage is the longer scanning time. To date there is only evidence that DKI can help to differentiate between groups of patients with low-grade and high-grade gliomas but not on an individual level. Larger prospective studies need to be performed, not only in adults but also in children with brain tumors, to validate the power of DKI as a new noninvasive biomarker in grading gliomas or other types of brain tumors.
Magnetic Resonance Spectroscopy (Magnetic Resonance Spectroscopy, Single-Voxel Imaging, and Chemical Shift Imaging)
MRS provides radiologists with the opportunity to gain information on biochemical and cellular metabolite analyses of brain tissue. Proton MRS is the most commonly used MRS technique. There are multiple metabolite peak assessments possible, depending on the echo time (TE) used. Five predominant metabolite peaks can be identified:
- 1.
Choline (Cho)-containing compounds, which reflect membrane turnover and cellularity.
- 2.
Creatine (Cr), which represents energy synthesis and serves as an internal control for determining metabolite ratios given its relative stability, except in instances of energy failure (tumor necrosis).
- 3.
N -acetyl aspartate (NAA), which is found mostly in neurons but may also be found in glial cells and serves mostly as a marker of neuronal cells.
- 4.
Lactate, which results from anaerobic metabolism and is seen not only in necrotic tumors but also in low-grade tumors, like pilocytic astrocytomas. A lactate peak can be seen in hypoxic or infarcted tissue and also in brains of children with metabolic diseases.
- 5.
Lipids can appear when there are increased cellular and myelin breakdown products or nonviable necrotic tissue. Lipids may also be shown in cystic lesions such as pilocytic astrocytomas.
Many other metabolites can be detected, especially with short TE (35 milliseconds) and when using higher field strengths (3 T or higher). In the literature, multiple articles focus on MRS and its use in children with a suspected brain tumor. On a 1.5-T MR system, the most commonly used proton MRS technique in children suspected to have a brain tumor is short TE (<35 milliseconds). This short TE allows additional metabolite peaks such as myoinositol (mI, a glial cell marker), glycine, glutamine/glutamate (Glx), taurine (Tau), alanine (Ala), and citrate (Cit) to be identified. These metabolites can be useful in suggesting histology and its biological behavior or malignancy grade of a brain tumor. The observable MR metabolites provide powerful information, but many notable metabolites are not detectable in brain MR spectra; for example, DNA, RNA, most proteins, enzymes, and phospholipids are missing. Some key neurotransmitters, such as acetylcholine, dopamine, and serotonin, are also absent with either their concentrations being too low, or the molecules being invisible to MRS.
Proton MRS can be used for diagnosing and differentiating brain tumor types, as well as predicting tumor grade and pretherapy/biopsy planning. Also, posttherapy assessment, including differentiating radiation necrosis from tumor recurrence, is possible because normal brain metabolite levels after treatment favor edema and postsurgical changes. Tzika and colleagues showed that the metabolic profile of a brain tumor obtained with MRS gives additional information that is not provided by other tumor imaging parameters, such as enhancement, diffusion, and relative cerebral blood volume. The MR spectroscopic hallmark of brain tumors relative to normal brain tissue is increased choline and decreased NAA levels.
In general, the grading of the tumor increases when NAA and creatine levels are decreased, and choline, lactate, and lipid levels are increased.
Very malignant tumors have high metabolic activity and deplete their energy storages, resulting in reduced creatine levels. Very high cellular tumors with rapid growth have high choline levels. Lipids are found in necrotic portions of tumors, and lactate appears when tumors outgrow their blood supply and start using anaerobic glycolysis.
However, pilocytic astrocytoma, a grade I low-grade tumor, usually shows very low levels of NAA and Cr, and high choline, lipid, and lactate levels in the spectra, mimicking aggressive lesions.
For an accurate assessment of the tumor biology, the spectroscopic voxel should preferably be placed over the enhancing part of the tumor, avoiding areas of necrosis, hemorrhage, calcification, cysts, or cerebrospinal fluid.
As mentioned earlier, MRS can also play an important role in assessing therapeutic response. For example, early detection of treatment failure is important because an ineffective treatment can be modified before a significant progression of disease.
MRS data can be obtained in SV or multivoxel mode.
Single-voxel technique
In SV mode, the most commonly used methods for volume selection/excitation are stimulated echo acquisition mode (STEAM) and point-resolved spectroscopy sequence (PRESS). In general, shorter TEs are better achieved with STEAM; however, it is more sensitive to motion. In theory, for the same total TE, the signal of PRESS is twice as great as that of STEAM; PRESS is also less sensitive to motion. To date, PRESS seems to be the most commonly used method of volume selection in clinical neuro-oncology practice. The major advantage of SV 1H-MRS is its short acquisition time (approximately 3 minutes compared with about 7–9 minutes for multivoxel).
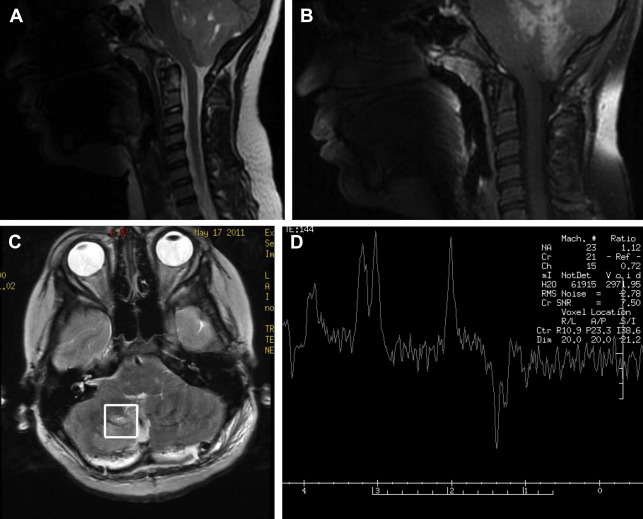
With a short TE of 35 milliseconds or less, metabolites with both short and long T2 relaxation times can be detected. With a long TE of 288 milliseconds, only metabolites with a long T2 are seen, producing a spectrum containing primarily NAA, creatine, and choline. One other helpful TE is 144 milliseconds because it inverts lactate below baseline at 1.3 ppm and therefore makes it easily distinguishable from lipids and macromolecules, which resonate at the same concentration ( Fig. 5 ).
As a general rule, SV, short-TE MRS is used to make the initial diagnosis, because the signal/noise ratio is high and all metabolites, which can be used for further characterizing the brain tumor, are represented. Its major flaw is that it lacks spatial resolution and cannot be used to better define the extent of a brain tumor, especially in brain tumors known to spread easily, like high-grade gliomas. Some brain tumors on imaging and histology are heterogeneous, and, therefore, SV spectroscopy cannot be used to map regional metabolic variations. Therefore, SV spectroscopy alone cannot reliably define the highest-grade components of the tumor. It may also involve significant averaging with low-grade parts of a tumor or even with adjacent normal brain tissue.
Multivoxel technique
Multivoxel MRS, a chemical shift technique (CSI) using either a short or long TE, can be used to further characterize different regions of a tumor and to assess the brain parenchyma around or adjacent to the tumor. This method is best for detection of infiltrating malignant cells beyond the enhancing margins of tumors. Particularly in the case of cerebral high-grade gliomas, increased choline levels are frequently detected in edematous regions of the brain outside the enhancing mass ( Fig. 6 ). CSI can also be used to assess the response to therapy and to search for tumor recurrence. It is possible to scan in a two-dimensional (2D) or three-dimensional (3D) mode. The 3D CSI method is especially sensitive for detecting small areas of recurrence. A major drawback is its long scanning time (in children it may result in a higher portion of MR scanning under general anesthesia) and its low signal/noise ratio caused by its smaller voxel size, resulting in less reliable MR spectra. Also, acquisitions from larger volumes increase the risk for inhomogeneity of the magnet field and inadequate water suppression. 2D CSI MRS has also been used to help biopsy planning by showing areas of highest choline levels.
Quantitative rather than qualitative, MRS has been recently suggested for the assessment of the metabolic profiles of pediatric brain tumors. Although absolute concentrations and concentration ratios of the prominent metabolites of the 1H-MR spectrum (NAA, Cr, tCho [total Choline], mI) provide important diagnostic information, less prominent spectral features, such as increased Tau in medulloblastomas or reduced guanidinoacetate in astrocytomas, also proved to be relevant for the discrimination of different tumors ( Fig. 7 ). This quantitative MRS may help improve preoperative diagnosis of specific tumors. However, in daily practice, MRS should be used with standardized acquisition and processing methods, and easy-to-follow rules for quality control. Also, the interpretation is complex and requires expert knowledge to have an impact on clinical decision making ( Fig. 8 ). Fully automated processing and quantitation can be helpful but in inexperienced hands it is cumbersome.
In summary, our suggested protocol in pediatric patients suspected to have a brain tumor is:
- 1.
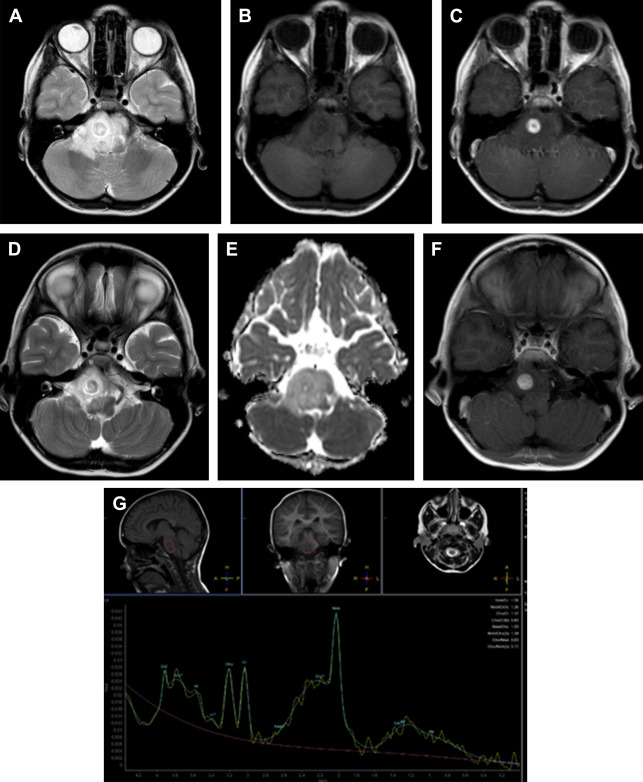
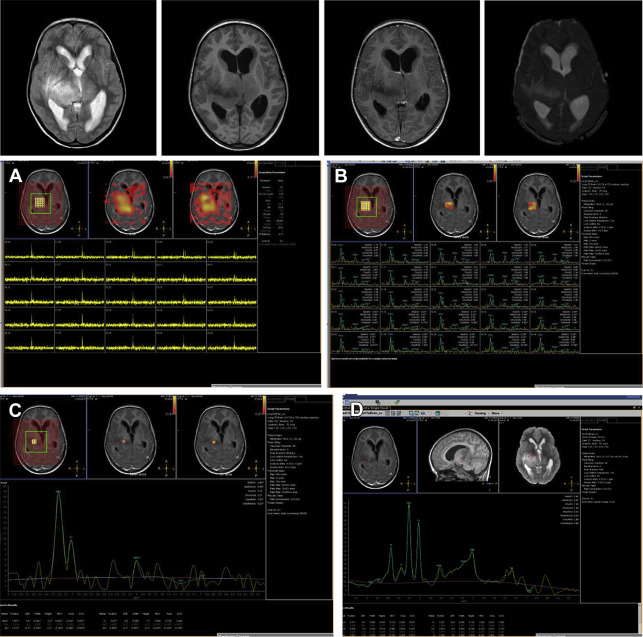
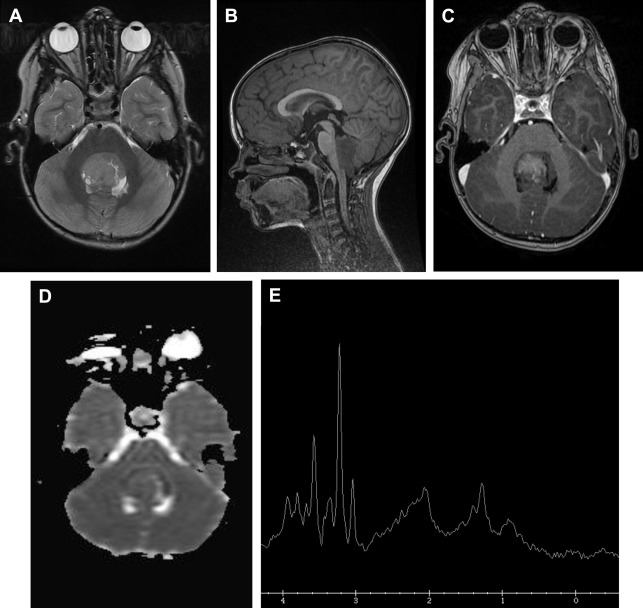
Initial diagnosis, SV MRS with short TE (35 milliseconds) in suspected brain tumor area and 2D CSI for defining the preferable area for biopsy. On both MRS sequences, the area with contrast enhancement should be included and areas with cerebrospinal fluid, hemorrhage, and calcifications should be avoided ( Fig. 9 ).
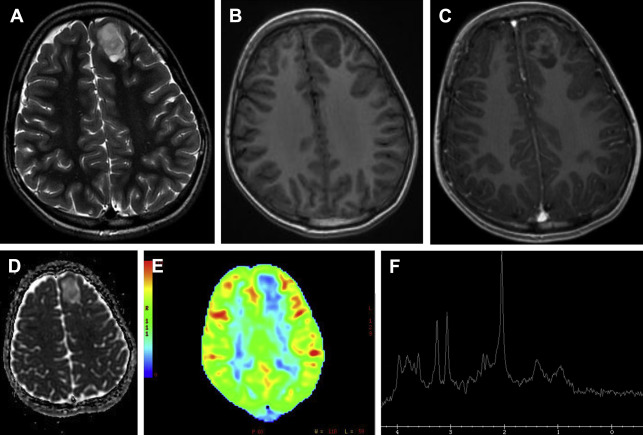
Fig. 9
A 12-year-old girl presents with focal seizures. The T2 ( A ), T1 ( B ), and T1 with contrast ( C ), as well as the ADC value ( D ), suggest a low-grade tumor. ASL shows the lesion has low perfusion ( E ). MRS ( F ) shows increased myoinositol peak compatible with a glial tumor. Low choline level also suggests a low-grade tumor. On histology it was a low-grade oligodendroglioma.
- 2.
Postoperative 24-hour to 72-hour MR scan. Depending on the amount of residual tumor seen on the conventional images and what the surgeon suspects to have left behind, SV, 2D CSI, or 3D CSI with short TE can be done. Because of landmark changes and other postoperative alterations, like bleeding, hemostasis material, and infarction of surrounding brain parenchyma, interpretation of the MRS spectra can be challenging. SV is less sensitive for postoperative changes and therefore, for routine postoperative scanning, the best choice. However, if the suspected residual tumor area is small, then 2D or 3D CSI may be better options.
- 3.
Follow-up MRS can be included in the scanning protocol if treatment response seems to be inadequate. Some clinicians advocate using 3D CSI in every follow-up scan to detect small tumor recurrence. In brainstem gliomas, SV is the best method because of interpretation problems with CSI spectra caused by magnetic field inhomogeneity at the skull base.
All metabolites that are detectable with MRS and that could help in differentiating among pediatric brain tumors are summarized in Tables 1 and 2 . Therapeutic response assessment, radiation necrosis, and differential diagnosis for focal brain tumor are discussed briefly. Extensive description of possible brain tumor types in the posterior fossa and supratentorial are addressed in other articles.
| mI | Tau | Cho | Cr | Cit | Glx/Glu | NAA | Lac | Lip | Ala | Cho/Cr | Cho/NAA | mI/Cr | Tumor |
|---|---|---|---|---|---|---|---|---|---|---|---|---|---|
| ↑ | ↑ | ↑ | ↓ | ↑ | ↑ | ↑ | ↑ | MB | |||||
| ↑ | ↑ | ↑ | ↑ | Ependymoma | |||||||||
| ↑↑ | ↑ | ↓ | CPP | ||||||||||
| ↓ | CPC | ||||||||||||
| ↑ | Meningioma | ||||||||||||
| ↓ | ↑ | ↑ | ↑ | Glioblastoma | |||||||||
| ↑ | ↓ | ↑ | ATRT | ||||||||||
| ↑ | ↓ | ↓ | ↑ | ↑ | ↑ | ↑ | Pilocytic astrocytoma | ||||||
| ↓ | ↑ | ↑ | ↑ | BSG | |||||||||
| ↑ | ↑ | ↓ | ↑ | ↓ | ↑ | ↑ | ↑ | Diffuse astrocytoma | |||||
| ↑ | ↓ | Pilomyxoid |
| mI | Tau | Cho | Cr | Cit | Glx/Glu | NAA | Lac | Lip | Ala | Cho/Cr | Cho/NAA | mI/Cr | Tumor |
|---|---|---|---|---|---|---|---|---|---|---|---|---|---|
| ↑ | ↓ | ↑ | ↑ | PNET | |||||||||
| ↑ | ↓ | ATRT | |||||||||||
| ↑ | Low grade oligodendroglioma | ||||||||||||
| ↑ | ↑ | ↑ | ↑ | Oligo high grade | |||||||||
| ↑ | ↑ | DNET | |||||||||||
| ↑ | DIG/DACI | ||||||||||||
| ↑ | ↓ | Ganglioglioma/gangliocytoma | |||||||||||
| ↑ | ↓ | ↓ | CPP | ||||||||||
| ↓ | ↑ | ↓ | ↑ | CPC | |||||||||
| ↑ | ↑ | SEGA | |||||||||||
| ↑ | ↑ | ↑ | ↑ | Meningioma | |||||||||
| ↑ | ↑ | ↑ | Germinoma | ||||||||||
| ↑ | ↑ | ↓ | ↑ | Pineoblastoma |
Therapeutic response assessment
As stated earlier, 2D or 3D CSI is the best technique to assess a small recurrence within the surgical bed, especially when MRS can detect an increase in the Cho peak. Second, clinicians must take into account whether radiation therapy has been given, because this may result in low NAA peaks in the surrounding gray and white matter, compared with normal NAA levels in healthy controls. In the case of medulloblastomas, a higher total choline and taurine level may suggest metastatic disease, which may have a different therapeutic response (see Fig. 7 ). In brainstem glioma, if the citrate peak is reduced compared with the pretreatment situation, this may indicate malignant transformation, or result from chronic steroid administration, radiotherapy, and/or chemotherapy. Also, increased total choline and lipid levels can suggest malignant transformation. In grade II astrocytomas, a citrate peak may indicate a more aggressive behavior and higher chance for recurrence and metastases, and therapeutic response assessment should be tailored for patients with this kind of tumor.
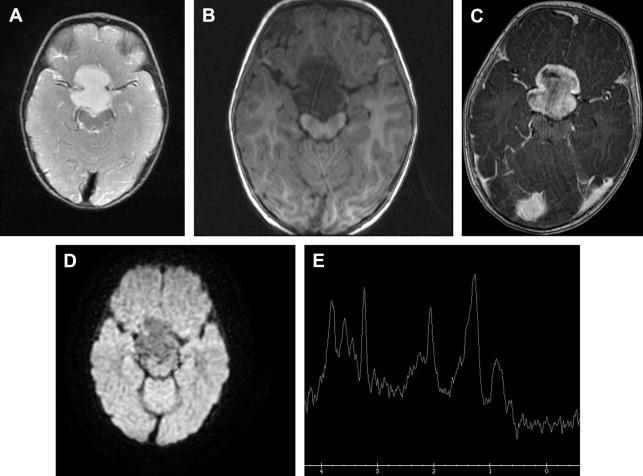
Radiation necrosis
Radiation necrosis could be a diagnostic challenge for neuroradiologists. Most of the time conventional imaging is inconclusive and advanced MR imaging techniques are necessary ( Figs. 10 and 11 ). Typically, radiation necrosis develops months to several years after radiation therapy.
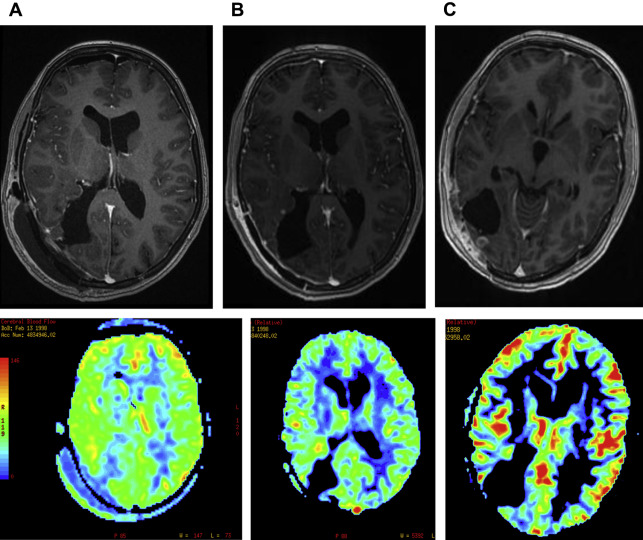
Besides perfusion-weighted imaging, MRS can be helpful to differentiate between tumor progression and radiation necrosis. On MRS, a high lipid/lactate peak, low NAA peak, and a low choline peak compared with the spectra of normal-appearing brain parenchyma and with the spectra of the pretreatment brain tumor are suggestive of radiation necrosis.
High choline peaks may be shown after radiation therapy because of tumor cell death. In these cases, information obtained from other advanced MR imaging techniques, such as perfusion-weighted MR imaging, as well as follow-up with MRS, may be helpful in characterizing the lesion.
Pseudoprogression
In the pediatric population, pseudoprogression is less an issue than in the adult population, because of a lower occurrence of high-grade brain tumors ( Fig. 12 ) treated with postoperative adjuvant radiation therapy and temozolomide chemotherapy. Pseudoprogression often appears several weeks to months after radiation therapy. The causative factor is a transient interruption of myelin synthesis secondary to damage to oligodendrocytes as a result of radiation injury.
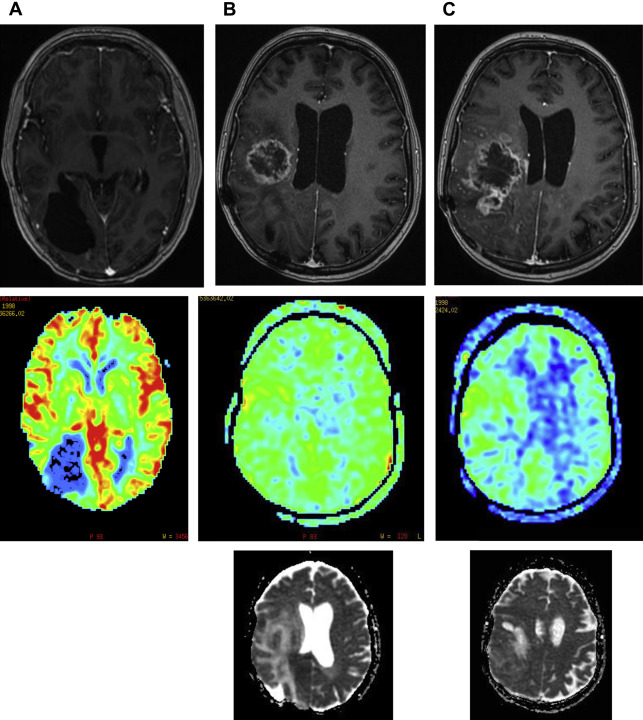
Accurate distinction between tumor recurrence and treatment effects can also be difficult in children. DWI and PET scans (with 11C-methionine) may provide the answer in many cases, but sometimes MRS can give additional information. Because of new treatment strategies, radiologists can no longer rely on changes in enhancement within the old tumor region. Enlargement of an enhancing lesion may represent pseudoprogression.
Although perfusion and permeability may help distinguish pseudoprogression from true tumor progression, follow-up MR imaging with contrast is the only established technique to confidently distinguish these lesions.
Pseudoresponse
To date, MRS has not provided any additional value in the diagnosis of pseudoresponse. Pseudoresponse has been noticed since the introduction of antiangiogenic therapies targeting vascular endothelial factor (VEGF), such as bevacizumab, a recombinant humanized monoclonal antibody to VEGF-A, or the VEGF receptor, such as cediranib, a pan-VEGF receptor tyrosine kinase inhibitor normalization of leaky tumor blood vessels. These agents can cause reduction in enhancement within 1 to 2 days after administration, with a radiographic response observed in 25% to 60% of patients. However, this impressive radiographic response does not translate into increased overall survival. It is thought that the rapid radiographic response represents a direct action on blood vessel permeability rather than a true antitumor effect; a phenomenon termed pseudoresponse. A further confounder in radiographic assessment of therapy response is the tendency for antiangiogenic agents to promote progression of nonenhancing disease by selecting for an invasive tumor phenotype capable of co-opting existing blood vessels and no longer relying on angiogenesis.
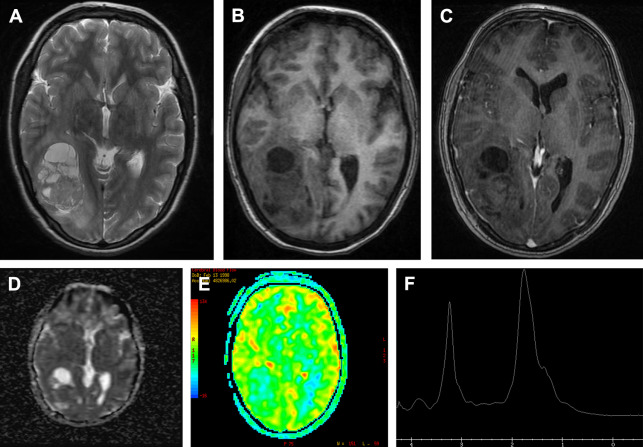
Differential diagnosis
It may be difficult or even impossible to distinguish between a necrotic tumor and an abscess, even with contrast-enhanced MR imaging. Most of the time DWI can give the answer and in some cases MRS can be of additional help ( Figs. 13 and 14 ). If in the cystic/necrotic part of the mass acetate, succinate, and amino acid (valine, alanine, leucine) peaks are visible, a pyogenic abscess is the most likely diagnosis.