This article presents a summary of advanced MR imaging techniques and their use in the evaluation of patients with brain tumors. It reviews diffusion-weighted imaging, diffusion-tensor imaging, T2* susceptibility–sensitive imaging, MR spectroscopy, MR perfusion, and functional MR imaging, and discusses their current roles in the evaluation of patients with brain tumors.
Key points
- •
Areas of postoperative reduced diffusion representing cytotoxic edema may be expected to enhance on subsequent follow-up imaging as a subacute infarct would and should not be mistaken for recurrent/residual tumor.
- •
Diffusion-tensor imaging currently is mainly applicable for tractography, in which the corticospinal tracts, optic radiations, and potentially other tracts of interest are displayed in commercially available surgical navigational packages.
- •
Foci of susceptibility that develop following radiation therapy represent microhemorrhages or induced small vascular malformations; a delayed toxicity of radiation therapy.
- •
Higher relative cerebral blood volume can be useful to suggest residual/recurrent tumor as opposed to treatment effect.
- •
A perfusion curve that does not return close to baseline is suggestive of leaky capillaries, such as those found in metastasis, or an extra-axial tumor as opposed to a glioma.
Introduction
Advanced MR imaging techniques have become an integral part of the evaluation of patients with brain tumors. Although structural imaging provides the primary foundation of an MR examination, advanced MR imaging techniques can potentially provide valuable insight into the physiology, histology, genetics, hemodynamics, and chemistry of a patient’s tumor and brain. These techniques are being applied to diagnose and grade tumors preoperatively, to plan and navigate surgery intraoperatively, to monitor and assess treatment response, and to understand the effects of treatment on the patients’ brains. Advanced imaging techniques include techniques that are routine and fairly quick, such as diffusion-weighted imaging (DWI), frequently used problem-solving techniques such as dynamic susceptibility contrast-enhanced (DSC) perfusion imaging and MR spectroscopy (MRS), and currently less frequently used techniques such as functional MR (fMR) imaging ( Table 1 ).
| Technique | Basics | When Used |
|---|---|---|
| DWI | Echo-planar imaging technique B = 1000, at least 3 orthogonal directions | Routine in all MR brain protocols |
| DTI | Echo-planar imaging technique B = 2000, numerous (ie, 55) directions. Long acquisition | Preoperative navigation MR for tractography |
| DSC perfusion | Echo-planar imaging; negative contrast technique; radiologist selects level, processes, and draws regions of interest to measure rCBV | Initial evaluation of brain tumors and follow-up for progression |
| DCE perfusion | T1-based positive contrast technique, main measure of interest is permeability (endothelial transfer coefficient K trans ) | In general, only in some research protocols |
| ASL | Noncontrast perfusion technique based on inflow spin tagging. Processed CBF map | Stroke, vascular malformations, tumors (increasing experience) |
| MRS | 20 × 20 × 20 mm for single voxel, smaller for multivoxel techniques In general, with echo time = 288 ms; 144 ms if trying to flip lactate. Short echo time in certain situations (eg, myo-inositol) | Problem solving when evaluating unknown lesions or in follow-up |
| Susceptibility-sensitive imaging | T2* gradient echo–based sequences (eg, SWI) Magnitude and phase information available | Routine in most MR brain protocols |
| fMR imaging | BOLD echo-planar imaging technique with a standardized administered paradigm for functional localization | Select cases for preoperative functional localization |
| RS-fMR imaging | BOLD echo-planar imaging technique while at rest for approximately 8 min. Heavy postprocessing to identify resting-state networks | Research use |
This article reviews the following techniques: DWI, diffusion-tensor imaging (DTI), susceptibility-weighted imaging (SWI), MRS, perfusion imaging, and fMR imaging (see Table 1 ). It emphasizes the clinical applications of these techniques as they apply to brain tumor imaging. An in-depth discussion of the underlying physics of these techniques is beyond the scope of this article and is only reviewed where relevant.
Normal anatomy and imaging technique
Diffusion-weighted Imaging and Related Techniques (Tagging: Diffusion-weighted Imaging, Diffusion-tensor Imaging)
DWI has become a routine sequence in brain imaging but nonetheless offers valuable insight into the diffusion of water molecules in tissues beyond traditional structural MR imaging. This quick sequence uses applied gradients usually with an echo-planar imaging technique to measure the brownian motion of water molecules. An apparent diffusion coefficient (ADC) is derived for each voxel and is displayed as a calculated ADC map. DWI has become indispensable in the evaluation of stroke but also offers significant value in the evaluation of brain tumors and is routinely used in daily practice in this role ( Figs. 1 C, D and 2 C ).
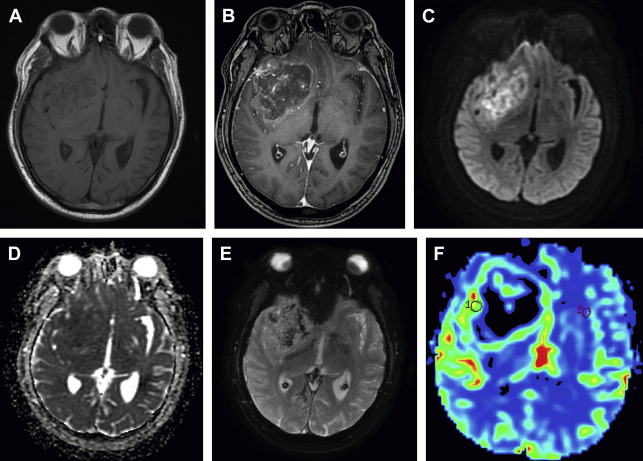
DTI and related techniques can be considered more complex versions of standard DWI. DTI involves the interrogation of the motion of water with numerous gradient directions, which allows the measurement of directional diffusion. This technique provides additional abilities compared with standard isotropic DWI. Anisotropic diffusion measured by DTI is characterized by eigenvectors (direction) and eigenvalues (magnitude), which can be used to derive numerous parameters. DTI and other similar advanced (predominately research) techniques such as diffusion-spectrum imaging, diffusion-kurtosis imaging, and tract-density imaging provide additional insight beyond DWI into the microstructure and integrity of the white matter. Fractional anisotropy (FA), mean diffusivity, track density, neuronal density, and multiple other measures derived from these techniques all offer additional means to study brain tumors and the effects of treatment, which may be further realized in the future. DTI is currently most relevant clinically as tractography, whereby white matter fiber tracts are derived from the DTI data based on fiber tracking of anisotropy from anatomic seed points. These white matter tracts are then displayed three-dimensionally for navigational purposes. At our institution, tractography of the corticospinal tracts and optic radiations is routinely displayed superimposed on high-resolution three-dimensional (3D) T2-weighted and postgadolinium spoiled gradient echo recalled images for intraoperative navigational purposes with additional tracts of interest, such as the arcuate fasciculus, produced in certain cases ( Fig. 1 H, I, 3 D ).
T2* Susceptibility-sensitive Sequences (Tagging: Susceptibility-weighted Imaging, T2*, Susceptibility, Microhemorrhage)
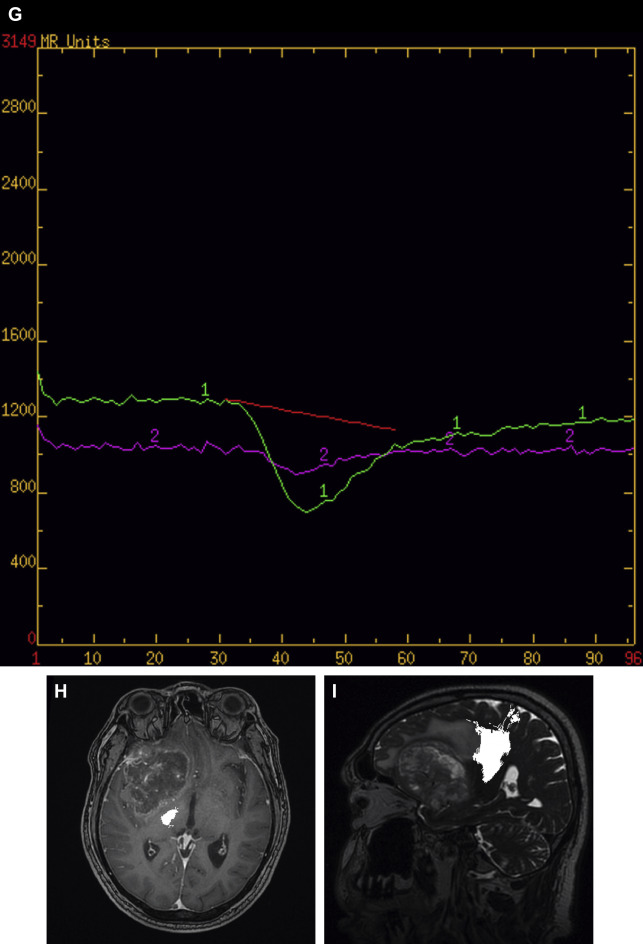
High-resolution 3D T2* gradient echo sequences such as SWI offer high sensitivity to small regions of magnetic susceptibility, which includes susceptibility from iron, making susceptibility-sensitive sequences excellent for the depiction of hemorrhage and microhemorrhage ( Figs. 1 E, 3 B and 4 D ). The magnitude images depict hemorrhage, blood vessels, and calcification/mineralization as dark lack of signal from susceptibility (see Figs. 1 E; 3 B, 4 D). However, phase images can potentially be useful to distinguish iron and deoxygenated blood products (paramagnetic and dark on a right-handed system) from calcium (diamagnetic and bright on a right-handed system). Minimum intensity projection images can also be reviewed to more clearly differentiate normal venous structures from parenchymal foci of susceptibility.
Magnetic Resonance Spectroscopy (Tagging: Magnetic Resonance Spectroscopy)
MRS provides insight into the chemical profile of interrogated brain tissue. Proton ( 1 H) MRS is the most clinically relevant technique. The most recognizable peaks on long-echo 1 H-MRS, which are of interest in the evaluation of brain tumors, include N -acetylaspartate (NAA) at approximately 2.0 parts per million (ppm), creatine (Cr) at approximately 3.0 ppm, and choline (Cho) at approximately 3.2 ppm. NAA is considered a neuronal marker, Cr a marker for cellular metabolism, and Cho a marker for cell membrane turnover. Additional metabolites of interest include lipid and lactate peaks at approximately 1.3 ppm and myo-inositol at approximately 3.5 ppm. Lipids and lactate are considered markers of necrosis and hypoxia, respectively, and myo-inositol is considered to be related to astrocytic integrity and regulation of brain osmosis. Clinically, MRS is performed with a single-voxel technique to a targeted region of interest or with a multivoxel or 3D technique in order to cover a broader area and evaluate regional differences ( Figs. 3 E, F and 5 C, D ). In general, long-echo MRS is performed for the evaluation of brain tumors (288 milliseconds or 144 milliseconds if trying to invert a lactate peak). A short-echo technique can be used if trying to show myo-inositol. A related emerging method currently confined to research use is hyperpolarized 13 C MR. Hyperpolarized 13 C agents have a greatly increased signal, which provides the opportunity to follow a substance such as pyruvate through its biochemical pathways as it is converted to alanine, lactate, and bicarbonate.
Perfusion Imaging (Tagging: Perfusion, Dynamic Susceptibility Contrast Enhanced, Dynamic Contrast Enhanced, Arterial Spin Labeling)
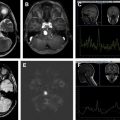
The 2 main established contrast-based methods of MR perfusion imaging in brain tumors are T2*-weighted DSC perfusion and T1-weighted dynamic contrast-enhanced (DCE) perfusion. DSC ( Figs. 1 F, G and 2 D, E, F) is a negative-contrast first-pass bolus tracking blood volume technique and DCE is a positive-contrast steady-state permeability technique. Both can be used to derive multiple perfusion parameters, such as cerebral blood volume (CBV) and endothelial transfer coefficient (K trans ). Relative CBV (rCBV), which is the calculated CBV relative to the contralateral side, is the most widely used parameter derived from DSC and is considered a marker of angiogenesis. The main metric derived from DCE perfusion MR imaging is K trans , considered a measure of microvascular permeability. Arterial spin labeling (ASL) is a more recently clinically available noncontrast perfusion technique that quantitatively measures cerebral blood flow (CBF) with applicability to a broad range of disease states ( Figs. 4 E, F, 6 C, D, 7 E, F ). We have recently converted our brain tumor protocols to use ASL as the preferred perfusion method because ASL is quick, images the whole brain, and has little postprocessing. In ASL, an inversion pulse is used to tag or label inflowing blood proximal to the area of imaging and these labeled spins are imaged along with control images. Pairwise subtraction of labeled and control images yields CBF maps with normal increased CBF in gray matter compared with white matter (see Figs. 4 E, F, 6 C, D, 7 E, F).
Functional MR Imaging (Tagging: Blood Oxygen Level Dependent, Functional MR Imaging, Resting-state Functional MR Imaging)
fMR imaging uses relative changes in the blood oxygen level–dependent (BOLD) signal to infer brain activity because activity correlates with blood flow and blood flow with BOLD signal. During task-based fMR imaging the BOLD sequence is performed during the performance of a task administered as a standardized paradigm ( Fig. 8 ). Non–task-based imaging, in which the sequence is performed at rest, is known as resting-state fMR imaging (RS-fMR imaging). RS-fMR imaging uses spontaneous low-frequency fluctuations (<0.1 Hz) in the BOLD signal to pick out areas of correlation and anticorrelation, which form the basis for defining resting-state networks, the most widely studied of which is the default mode network. RS-fMR imaging has some distinct advantages compared with task-based fMR imaging, including not having to administer a paradigm, the ability to study patients who may not be able to fully cooperate with a paradigm (eg, children, patients with altered mental status), and the ability to detect many networks retrospectively. Vascular tumors can potentially affect the BOLD signal; however, both task-based and RS-fMR imaging have been effectively applied in patients with brain tumors (see Table 1 ).
Imaging findings/pathology
Diffusion-weighted Imaging and Related Techniques (Tagging: Diffusion-weighted Imaging, Diffusion-tensor Imaging)
DWI offers valuable insight into the diffusion of water molecules in tissues and is of value in the evaluation of patients with brain tumors. ADC values derived from DWI are generally decreased in highly cellular tumors such as central nervous system (CNS) lymphoma, medulloblastoma, and high-grade glioma (see Fig. 1 C, D) and in highly viscous materials such as within cerebral abscesses. In primary CNS lymphoma, patients with lower tumor ADC values have also been reported to have poorer survival than patients with higher tumor ADC values. In patients with glioma, lower ADC values have been associated with higher-grade gliomas and lower ADC values have been associated with a poorer prognosis independent of tumor grade. ADC values may also provide insight into T2/fluid-attenuated inversion recovery (FLAIR) signal abnormality surrounding an enhancing lesion. Although this has not been found consistently in all studies, ADC values have been reported to be higher in vasogenic peritumoral edema T2/FLAIR abnormality surrounding enhancing metastases than in the more cellular infiltrative peritumoral edema T2/FLAIR abnormality seen in glioblastoma.
On immediate postoperative imaging, it is common to see small areas of reduced ADC surrounding the surgical bed, indicating areas of devitalized tumor tissue or devitalized ischemic brain tissue related to surgery. These areas may be expected to evolve as a cerebral infarction would and develop contrast enhancement and normalization of ADC on subsequent imaging; contrast enhancement that develops in the appropriate time course and corresponds with these areas should not be mistaken for tumor progression.
DWI is also helpful in the follow-up imaging of patients with brain tumors, particularly in the settings of antiangiogenic treatment and in distinguishing treatment effect from true tumor progression. The antiangiogenic effects of bevacizumab may markedly decrease the contrast enhancement of a tumor; however, DWI may be useful to show persistent or progressive nonenhancing tumor despite the lack of contrast enhancement. However, interpretation of new areas of reduced diffusion in patients on bevacizumab is complex and currently incompletely understood; reduced diffusion can develop in tumor and in ischemic areas of normal brain and can persist over time, possibly related to ischemic necrosis. Interpretation of these diffusion abnormalities in patients on bevacizumab requires follow-up over time and consideration of additional advanced imaging sequences such as perfusion and spectroscopy. With regard to the question of treatment effect versus true tumor progression, lower ADC values have been reported in true tumor progression than in the setting of pseudoprogression, likely because of the cellular nature of true progressive tumor and the edema associated with the inflammatory response in treatment-related pseudoprogression.
As mentioned, DTI is currently most relevant clinically as tractography for surgical planning and navigational purposes (see Figs. 1 H, I and 3 D). FA derived from DTI has been used as a marker of white matter integrity in multiple conditions and although primarily of research interest it may offer insight into the effects of radiation damage to the brains of patients with brain tumors. FA has been shown to decrease in normal-appearing white matter following radiation therapy, showing white matter injury and likely decreased structural connectivity. FA may also offer some insight into the T2/FLAIR signal abnormality surrounding enhancing lesions; FA has been reported to be increased in the infiltrative peritumoral edema surrounding high-grade gliomas compared with the vasogenic edema surrounding metastases, presumably because of the more ordered nature of the more cellular edema associated with gliomas.
T2* Susceptibility–sensitive Sequences (Tagging: Susceptibility-weighted Imaging, SWAN, T2*, Susceptibility, Microhemorrhage)
In general T2*-based susceptibility-sensitive sequences such as SWI are useful to depict hemorrhage and calcification associated with tumors and postoperative blood products, including long-term hemosiderin staining (see Figs. 1 E, 3 B and 4 D). These sequences are also useful to depict small microhemorrhages or small vascular malformations that develop over time in patients who have received radiation therapy. These small foci of susceptibility likely indicate a delayed toxicity of radiation on the microvasculature of the brain and are well depicted by T2*-based susceptibility sensitive sequences.
Magnetic Resonance Spectroscopy (Tagging: Magnetic Resonance Spectroscopy)
The MRS profile of gliomas is generally considered to be increased Cho and decreased NAA, creating a characteristic downsloping appearance compared with the normal upsloping appearance (see Figs. 3 E, F and 5 C, D). Cho is not a specific marker of tumor but reflects increased cell membrane turnover, and NAA represents a neuronal marker, decreased in the setting of tumor as well as many other conditions. Absolute heights of these peaks are generally not used and the metabolic peaks can be analyzed as ratios, including Cho/NAA and Cho/Cr. MRS can potentially be useful to differentiate high-grade gliomas from low-grade gliomas because high-grade gliomas have been found to have higher Cho/NAA and Cho/Cr ratios than lower-grade gliomas. Lower-grade gliomas have been associated with an increased myo-inositol/Cr ratio (myo-inositol is best identified with a short echo time of 35 milliseconds).
MRS can also be useful in the evaluation of the T2/FLAIR signal abnormality surrounding an enhancing lesion; increased Cho/NAA and Cho/Cr ratios have been reported in the peritumoral infiltrative cellular edema of high-grade gliomas compared with the peritumoral vasogenic edema surrounding metastases. MRS may also be useful in the ongoing posttreatment evaluation of patients with brain tumors. Although this may be challenging to apply in daily practice, in the situation of possible treatment effect or radiation necrosis, higher Cho/NAA or Cho/Cr ratios have been reported in true progressive tumor compared with treatment effect or radiation necrosis (see Fig. 3 E, F). Some overlap may be seen in the 1 H-MRS of tumors and radiation change. An increase in Cho-containing compounds after radiation therapy as a result of cell damage and astrogliosis may be seen in radiation necrosis misclassified as tumors.
Perfusion Imaging (Tagging: Perfusion, Dynamic Susceptibility Contrast Enhanced, Dynamic Contrast Enhanced, Arterial Spin Labeling)
DSC perfusion is the most studied and widely applied perfusion technique in the evaluation of patients with brain tumors, with rCBV being the main parameter of interest (see Figs. 1 F, G and 2 D–F). rCBV may help distinguish glioma grade, because high-grade gliomas generally have higher rCBV than low-grade gliomas; however, this should be used with caution because oligodendrogliomas can also have high rCBVs. rCBV may also be useful in distinguishing tumefactive demyelinating lesions from high-grade gliomas because tumefactive demyelinating lesions generally have lower rCBV. Metastasis can have high rCBV, but they tend to have leaky capillaries with leakage of contrast, resulting in a signal intensity curve that does not return close to baseline (see Fig. 2 D–F). A similar pattern resulting from highly leaky capillaries can be seen with meningiomas and choroid plexus tumors. rCBV has also been reported to be more increased within the infiltrative cellular peritumoral T2/FLAIR abnormality surrounding the enhancing portions of high-grade gliomas compared with the vasogenic peritumoral T2/FLAIR abnormality surrounding metastases. DSC may also be helpful in the ongoing evaluation of patients with known brain tumors and the question of tumor versus treatment effect or radiation necrosis. Tumor has been shown to have higher rCBV than radiation necrosis and, although there may be more overlap, higher rCBV than in treatment effect/pseudoprogression.
K trans , the main metric derived from DCE, may potentially be used to distinguish glioma grade, with higher K trans presumably caused by the greater capillary permeability seen in higher-grade gliomas than in low-grade gliomas. DCE has not been as extensively studied as DSC in the evaluation of treatment response and the question of treatment effect versus true progression but has been reported to be able to distinguish recurrent or progressive tumor from pseudoprogression using the maximum slope of initial enhancement.
ASL perfusion imaging has not been extensively studied in the setting of brain tumor but has been found to show increased CBF in vascular tumors such as meningiomas and many metastases and high-grade gliomas (see Figs. 4 E, F, 6 C, D, 7 E, F). Although the experience is limited, ASL has been used to predict glioma grade, with higher-grade tumors showing higher perfusion. The authors have found ASL to be a very helpful and easily applied technique with distinct feasibility advantages compared with other perfusion techniques. Limited early experience suggests that increased CBF is likely to be predictive of residual/recurrent tumor as opposed to treatment effect (see Figs. 4 E, F, 6 C, D).
Functional MR Imaging (Tagging- Blood Oxygen Level–Dependent, Functional MR Imaging, Resting-state Functional MR Imaging)
Task-based fMR imaging can be used for preoperative localization of eloquent cortex with identification of language and somatomotor function with similar accuracy to more invasive techniques (see Fig. 8 ). Task-based fMR imaging is one of several measures that are useful for preoperative planning to identify the relationship of a brain tumor to important functional cortex. The distance from the functional area depicted on task-based fMR imaging to a tumor to be resected has been correlated with the degree of postoperative loss of function, with a small margin (<1 cm) predicting a poorer outcome.
RS-fMR imaging has also been used to identify eloquent cortex as part of presurgical planning in patients with brain tumors. Although the experience is more limited, several studies have shown the ability to localize somatosensory cortex in relationship to brain tumors. RS-fMR imaging offers the ability to study functional connectivity of the brain and is thus a potentially powerful research sequence for studying the brains of patients with tumors and the effects of treatment. To date there have been several small studies that have shown decreased functional connectivity in resting-state networks in patients with brain tumors but this is expected to be an ongoing area of active research in the future.
Technique
DWI
Low ADC: cellular tumor such as lymphoma, high-grade gliomas often with areas of mildly reduced diffusion
Postoperative cytotoxic edema in devitalized tissues
Higher ADC: surrounding vasogenic edema as opposed to cellular infiltrative edema. Treatment effect may have higher ADC values than true progression, but difficult to distinguish in daily clinical practice
DTI
Infiltrative tumors may infiltrate as opposed to displace functional tracts, complicating and likely precluding surgical resection
DSC perfusion
Perfusion curves in gliomas should return close to baseline
Perfusion curves with leaky capillaries (metastases, choroid plexus tumors, extra-axial tumors) generally do not return close to baseline
Higher rCBV is suggestive of higher-grade as opposed to lower-grade glioma and in the setting of follow-up is suggestive of true progression as opposed to treatment effect
DCE perfusion
Higher permeability suggestive of higher-grade glioma as opposed to lower-grade glioma. Within a tumor may potentially identify areas of higher grade
ASL
Higher blood flow may be useful to identify areas of recurrent tumor
Although experience is limited, higher blood flow may be seen in higher-grade as opposed to lower-grade gliomas
MRS
Gliomas generally characterized by increased choline (3.2 ppm) and decreased NAA (2.0 ppm) levels, although this is nonspecific
Higher-grade gliomas show higher choline/NAA and choline/creatine ratios than lower-grade gliomas
Higher choline ratios are also suggestive of true progressive tumor compared with treatment effect/necrosis
Susceptibility-sensitive imaging
Useful to show/identify tumor mimics such as cavernous malformations
Identify blood products and calcifications. Identify radiation-induced microhemorrhages/induced vascular malformations
fMR imaging
Select cases for preoperative functional localization
RS-fMR imaging
Research use for identifying resting-state networks and evaluating changes in functional connectivity
Related posts:


Stay updated, free articles. Join our Telegram channel

Full access? Get Clinical Tree


