and represents the change in displacement with depth (i.e., how tissue compresses). Strain is related both to the applied stress (σ, i.e., force per unit area) and the inherent tissue mechanical properties (E, the elastic, or Young’s modulus), and under simplifying assumptions is described by the equation:

(3.1)
Fig. 3.1
Schematic representation of tissue with a soft circular inclusion (top, light gray) and stiff circular inclusion (bottom, dark gray) prior to compression (a), post-compression (b), the induced displacements (c), and the computed strain (d). The background has linearly varying displacement throughout depth due to the applied force at the top of the tissue and fixed bottom boundary; thus, the background has constant strain, as represented by the yellow line. The displacement in the region with the two inclusions is piecewise linear, with different slopes in the lesions and the background. The soft lesion displaces more than the background, and the stiff inclusion displaces less than the background; thus, the strain provides information about the relative stiffness of the lesions and background
The elastic modulus describes the stiffness of tissue; stiffer tissues have a higher elastic modulus than softer tissues. Since strain is inversely proportional to the elastic modulus, for a given stress, stiffer structures exhibit smaller strain, or displacement, and softer tissues exhibit larger strains (Fig. 3.1). Both MRI and ultrasound can be used to measure tissue motion; thus, in elastographic imaging methods, tissue displacement in response to an applied stress is measured, and images of tissue displacement or strain are generated that reflect relative differences in tissue stiffness.
In addition to compressing the tissue, it is possible to generate shear waves in the tissue. These shear waves propagate in a direction orthogonal to the applied stress and are in concept similar to the ripples that propagate away from a pebble dropped in water. The spatial and temporal behavior of a shear wave in tissue is governed by the wave equation:
where u is the displacement of the tissue, c s is the wave speed, and ∇ is the Laplacian operator.
(3.2)
Equation 3.2 relates the spatial behavior of the wave, the left side of the equation, to the temporal behavior of the wave, the right side of the equation. Additionally, there is a constant of proportionality c s , which is known as the shear wave speed. The shear wave speed can be related to the shear modulus through assumptions of linear elasticity and homogeneity, such that μ = ρc s 2 where μ is the shear modulus and ρ is the density. Furthermore, under the assumption of incompressibility, which is considered reasonable in soft tissues such as the prostate, the shear modulus is directly proportional to the Young’s modulus, such that E = 3μ = 3ρc s 2. Therefore, if the shear wave speed is measured using elastographic techniques, it is possible to directly estimate the corresponding shear and Young’s moduli, which represent the inherent material elastic properties of the tissue.
3.2.3 Elastic Properties of the Prostate
In addition to empirical evidence that prostate cancer is stiffer than normal prostate tissue (i.e., the digital rectal exam), multiple studies have been published that quantify the stiffness. Zhang et al. performed a study on ex vivo prostates and found that the Young’s moduli of normal posterior and cancerous prostatic tissue were 15.9 ± 5.9 kPa and 40.4 ± 15.7 kPa, respectively (Zhang et al. 2008). Zhai et al. utilized quantitative shear wave-based elastography methods in ex vivo samples and reported that the Young’s moduli of normal peripheral zone and cancerous prostatic tissues were 12.3 ± 2.4 kPa and 30 ± 3.0 kPa, respectively (Zhai et al. 2009). Although the stiffness differed between the studies, both found that there is approximately a 2.5x increase in the stiffness of the cancerous regions as compared to the prostatic peripheral zone tissue.
3.2.4 Elastographic Methods in Prostate
Strain Imaging
The vast majority of prostate elastography clinical studies have employed strain imaging (i.e., compression elastography) because this method is commercially available (Kamoi et al. 2008; Cochlin et al. 2002; Miyagawa et al. 2009; Nelson et al. 2007; Pallwein et al. 2008a, b, c; Parker et al. 2011; Salomon et al. 2008; Tsutsumi et al. 2007). Strain imaging requires the user to obtain a B-mode image of the prostate, then compress the organ, and obtain a second B-mode image. The tissue displacement is estimated using correlation-based techniques, and the strain between the two states is then computed (Parker et al. 2011; Ophir 1991).
Strain imaging assumes that the operator applies a uniform stress across the prostate. Stiffer regions can then be identified by their relatively low strain compared to the surrounding tissue as shown in Fig. 3.1. Elastography is typically performed as a freehand technique with the operator gently compressing the prostate with the ultrasound transducer. A skilled technician is needed to obtain adequately uniform compression, which can be challenging. Some recent studies have used inflatable balloons that surround the endorectal transducer and can be filled or emptied by the operator, thereby generating a more uniform stress on the prostate (Parker et al. 2011; Kapoor et al. 2011; Tsutsumi and Miyagawa 2010).
Researchers have also investigated the potential use of strain imaging to obtain quantitative information about the tissue. To accomplish this, the inverse problem is solved using models of the tissue structure and displacement data. While this method holds promise, it has not been used clinically to date due to challenges with implementation (Barbone and Gokhale 2004; Fehrenbach 2007).
Transrectal ultrasound (TRUS) is widely used for visualization during systematic prostate biopsies, but it is not typically used for biopsy guidance since tumors may not be visualized (Pallwein et al. 2008b). The primary use of strain imaging investigated in the clinical literature is for biopsy guidance. As will be reviewed below, many studies have employed conventional biopsy techniques and then used elastography to identify and target additional regions (Kamoi et al. 2008; Cochlin et al. 2002; Miyagawa et al. 2009; Nelson et al. 2007; Tsutsumi et al. 2007; Kapoor et al. 2011). Some studies have acquired elastography data and retrospectively compared suspicious regions with those that were biopsied (Pallwein et al. 2008a) or with whole-mount histology after the prostate is excised (Salomon et al. 2008).
Cochlin et al. demonstrated a significant improvement using strain imaging as compared to TRUS for prostate cancer (PCa) biopsy guidance. The authors studied 100 patients and using elastography identified five cancers that would not have otherwise been biopsied. Additionally, of these five cancerous regions, three were in patients whose other biopsies showed no cancer; thus, cancer detection was only achieved through the use of elastography. For elastography, the reported sensitivity and specificity for PCa were 51 and 83 %, respectively (Cochlin et al. 2002).
Nelson et al. in 2007 studied targeting biopsies using TRUS, color Doppler, and elastography in addition to the traditional sextant biopsy. The authors concluded that color Doppler and elastography both improve cancer detection, but that the detection is not sufficient to replace the standard sextant biopsy. Additionally, the authors showed that cancer detections in grayscale ultrasound, color Doppler, and elastography images are all correlated with Gleason score (Nelson et al. 2007).
Kamoi et al. studied 107 patients using both power Doppler ultrasound and elastography, indicating that elastography had 68 % sensitivity and 81 % specificity for PCa. The authors report that elastography is more successful at detection of high Gleason score tumors, with 100 % of the tumors with a Gleason score 8 being detected. The authors indicated that their primary difficulty with elastography was the image quality variability between users due to the user-dependent nature of compression (Kamoi et al. 2008).
Although the previous studies used both Doppler ultrasound and strain imaging, other groups have evaluated exclusively strain imaging. A 311 patient study by Miyagawa et al. reported a 90 % diagnostic sensitivity for PCa using the combination of TRUS and elastography. The authors reported that elastography was most successful in detecting cancer in the anterior prostate. They also noted that the sensitivity of elastography decreased as prostate volume increased, which they attributed to the confounding effects of BPH (Miyagawa et al. 2009).
The observation that the diagnostic utility of elastography differs in various regions of the prostate was expanded upon by Tsutsumi et al. The authors divided the prostate into three regions, anterior, middle, and posterior and analyzed the utility of elastography for prostate cancer detection. While elastography improved cancer detection in all regions of the prostate, the largest benefit was seen with anterior tumors, with decreasing improvement for middle and posterior tumors (Tsutsumi et al. 2007).
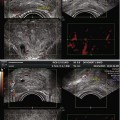
Pallwein et al. studied 492 patients, who had elastograms of the prostate recorded prior to receiving a systematic 10-core biopsy. The urologist performing the biopsy was blinded to the results of the elastography study. The authors found a whole organ sensitivity of 86 % and specificity of 72 % in the retrospective analysis of suspicious regions in the elastograms. Cancer detection in the basal region was compromised due to high false-positive rates associated with chronic inflammation and atrophy. A representative series of elastograms is reproduced from their work in Fig. 3.2 (Pallwein et al. 2008a).
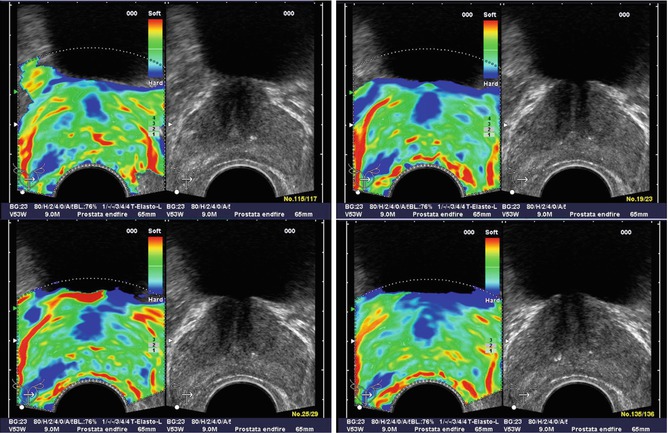
Fig. 3.2
Patient (picture series) with histologically confirmed prostate cancer in the right mid-gland of prostate. The elastographic examination showed a well-defined lesion with low strain (dark blue). The peripheral zone on the patient left side showed normal stiffness (Figure reproduced with permission Pallwein et al. (2008a))
Kapoor et al. performed a 50-patient study specifically focused on determining the utility of elastography in targeting biopsies. The authors reported the sensitivity and specificity of 91.7 and 86.8 %, respectively, as compared to their reported sensitivity and specificity of TRUS: 16.7 and 89 %, respectively. They noted that the primary challenges in using elastography are the inability to differentiate between cancer and prostatitis, very large prostates, and lack of operator experience (Kapoor et al. 2011).
Salomon et al. studied prostate elastography in 109 patients undergoing radical prostatectomy, in which the preoperative elastography data was correlated with whole-mount histology data. The authors reported 75 % sensitivity and 77 % specificity for elastography. The authors found that elastography detection of PCa was positively correlated with Gleason score (Salomon et al. 2008).
One of the common challenges reported for strain imaging of the prostate is achieving uniform compression of the organ. To address this challenge, Tsutsumi et al. inflated a water balloon surrounding the transducer to compress the tissue, which reduced the operator dependence of the image quality. Using this method, the authors detected 71 % of histology confirmed prostate cancer lesions (Tsutsumi and Miyagawa 2010).
Overall, the multitude of studies performed using strain imaging has demonstrated great promise for guidance of targeted biopsies. The primary benefits have been reported for detecting PCa in the peripheral zone, where approximately 80 % of cancers are located (Pallwein et al. 2008b). Although the studies have demonstrated higher sensitivity than with TRUS alone, challenges have also been identified. The studies using freehand compression noted that an experienced operator was needed to obtain high-quality images. Additionally, many studies demonstrated a high false-positive rate due to the confounding effects of BPH, which looks similar to cancer in strain images. Finally, the studies determined that targeted biopsies are not sufficient and that standard sextant or 10-core biopsies are necessary in addition to elastography-targeted biopsies.
Acoustic Radiation Force Impulse (ARFI) Imaging
Although strain imaging has been the most widely used elastographic imaging technique in the prostate to date, many other methods are currently under investigation. One promising area is the use of an acoustic radiation force impulse (ARFI) excitation rather than transrectal compression. The primary benefit of ARFI excitation is the ability to apply the force directly within the tissue, reducing the operator dependence of image quality (Torr 1984).
ARFI imaging applies short duration (<1 ms)-focused ultrasound pushing pulses that displace the tissue on the order of 10 μm; the displacement response is then measured with the same ultrasonic transducer. Regions of decreased displacement are assumed to represent stiffer tissues in the same way that regions of decreased strain represent stiffer tissues in strain imaging (Nightingale et al. 2002).
ARFI imaging has been used in preliminary feasibility studies to detect prostate cancer. Zhai et al. have acquired three-dimensional volumes of ARFI data and correlated their results to whole-mount histology in both ex vivo and in vivo studies. The initial ex vivo studies demonstrated that ARFI images portrayed zonal anatomy, BPH, and prostate cancer with considerably higher contrast than matched B-mode images (Zhai et al. 2010a).
In a follow-up study of 19 patients, the same group acquired three-dimensional volumes in vivo using an end-fire endocavity transducer prior to radical prostatectomy. The images were then correlated with histological results. As with strain imaging, when visible, cancers appeared as stiffer regions, corresponding to decreased displacement in the ARFI images. In addition, regions of BPH within the central gland were well visualized with a nodular appearance. Representative ARFI images and corresponding histology slide are shown in Fig. 3.3 (Zhai et al. 2008, 2012).
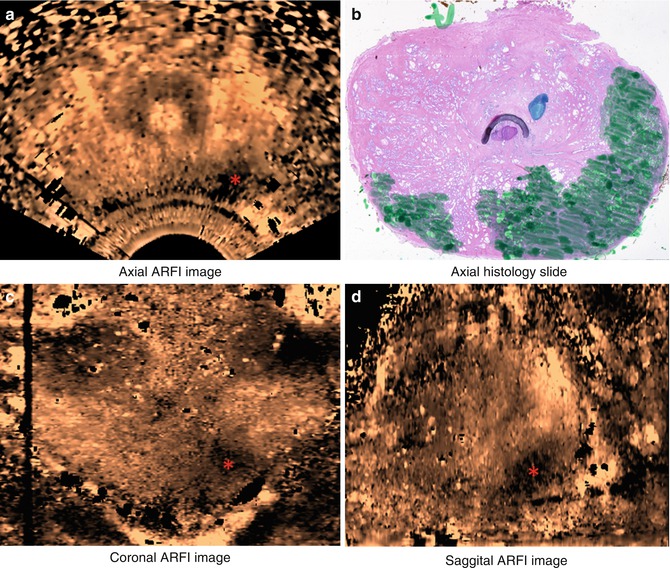
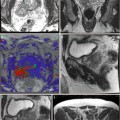
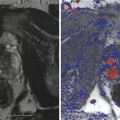
Fig. 3.3
Axial (a), coronal (c), and sagittal (d) sections of ARFI images in vivo and the corresponding histological slide (b). The basal area of the prostate is at the top of the coronal image, and the apex is at the bottom; the red asterisk indicates where the orthogonal views intersect. Images were obtained in vivo immediately prior to radical prostatectomy surgery. In the histological slide, cancerous regions were masked in green by a pathologist. The stiff structure (dark) in the right apex region shown in the ARFI image corresponds to the large cancerous region
Shear Wave Elastography
Shear wave imaging is an elastography technique in which the tissue stiffness is interrogated by exciting a shear wave and monitoring the speed of propagation away from the excitation, thus obtaining c s , as given in Eq. 3.2. To generate a shear wave in vivo, acoustic radiation force impulse excitations are used, either with a single focus or in a multifocal “supersonic” configuration (Bercoff et al. 2004); an image of the tissue is then generated by estimating the shear wave speed in small regions that are assumed to be uniform (Parker et al. 2011).
Although shear wave imaging has been used to image the breast (Tanter et al. 2008), muscles (Gennisson et al. 2010), and liver (Muller et al. 2009), it has only recently been translated to imaging prostates in vivo (Correas et al. 2013). In a single-center study, Ahmad et al. imaged and biopsied 50 patients, 33 of which had at least one positive biopsy core. Based on this work, they found that cancer was approximately 50 % stiffer than the benign tissue and that they were able to detect cancer with high sensitivity and specificity (0.9 and 0.88, respectively) (Ahmad et al. 2013).
Vibro-elastography
Vibro-elastography is an elastography technique that uses external vibratory actuators to excite the tissue at many frequencies simultaneously. The displacement of the tissue is then monitored using ultrasound, and the biomechanical properties of the tissue are calculated from the induced displacement. This method is equivalent to a strain image but is calibrated to the frequency and amplitude of motion, and therefore it can be used to obtain quantitative values for stiffness, density, and viscosity (Turgay et al. 2006).
Vibro-elastography has been used in a pilot study by Salcudean et al. to demonstrate the potential utility in detecting prostate cancer and brachytherapy seed placement. The tissue is excited using a mechanical actuator coupled to a transrectal ultrasound transducer to generate displacements within the tissue, which are subsequently observed using correlation-based techniques. The authors showed the ability to generate repeatable, operator-independent images that revealed stiff regions in the prostates they studied (Salcudean et al. 2006; Mahdavi et al. 2011).
Vibration Amplitude Sonoelastography
Another ultrasound-based elastographic method that has been used to evaluate prostate cancer in vivo is vibration amplitude sonoelastography. Two external mechanical actuators positioned beneath the patient’s pelvis vibrate at low frequency (70–200 Hz) generating vibrations within the prostate. These vibrations are monitored using a specially designed ultrasound Doppler processing mode. Regions of decreased amplitude are associated with stiffer structures in the tissue (Castaneda et al. 2009; Hoyt et al. 2008; Taylor et al. 2005; Parker et al. 2011).
Castaneda et al. imaged 10 patients prior to radical prostatectomy and correlated the results with whole-mount histology. Twelve of 19 cancerous lesions were identified (average diameters: 7.4 mm visualized, 3.8 mm missed), and 12 false-positive regions were identified, 6 of which corresponded to BPH. The primary challenges associated with this method are the inability to detect small tumors and difficulty in coupling enough vibration energy into the tissue (Castaneda et al. 2009; Hoyt et al. 2008).
3.2.5 Conclusions
Related posts:

Stay updated, free articles. Join our Telegram channel

Full access? Get Clinical Tree


