Introduction
In this chapter, we will review the normal anatomy and sonographic appearances of the abdominal arteries and veins. We will include an analysis of the normal Doppler waveforms of the abdominal vessels. Of course, recognition of the normal vascular anatomy is essential for the investigation of any abdominal vascular problem. Doppler studies of the abdominal vessels demand an understanding of normal and abnormal blood flow patterns. The detection of changes in abdominal blood flow allows accurate diagnosis of arterial and venous abnormalities, including stenosis, occlusion, and thrombosis. As is mentioned in several chapters in this book, identification of changes in blood flow patterns offers tremendous insight into vascular pathologies that may occur distant from the site of interrogation.
Abdominal Aorta
It is important to remember that all abdominal arterial branches identified during our Doppler studies receive blood supply via the abdominal aorta. The abdominal aorta leaves its vascular “imprint” on all its branches. Therefore changes in aortic blood flow related to stenosis (high-velocity flow) or aneurysmal dilatation (low-velocity flow) may be transmitted to its branches. That is why we always begin our examinations of the mesenteric and renal arteries with an evaluation of the abdominal aorta for plaque, stenosis, aneurysm, dissection, or occlusion. It is good practice to include an examination of the aorta during all abdominal arterial studies to detect aneurysm or significant atherosclerotic disease. The presence of significant atherosclerotic plaque in the abdominal aorta certainly increases suspicion of underlying branch disease, particularly at the origin of the vessels. We obtain velocity measurements and waveforms from the abdominal aorta and compare them to the waveforms from the branch artery to assess for changes in velocity and waveform shape.
Doppler waveforms obtained from the proximal abdominal aorta near the origins of the celiac and renal arteries usually have a low-resistance flow pattern, reflecting the need for continuous forward diastolic flow by the liver, spleen, and kidneys. Remember that, like the brain, the highly metabolic parenchymal organs of the abdomen (liver, spleen, kidneys) demand continuous forward flow in systole and diastole (low-resistance flow). The arteries that feed these organs generate waveforms that look like the internal carotid artery waveforms.
Waveforms obtained from the distal abdominal aorta near the iliac bifurcation usually have a higher-resistance flow pattern, reflecting the peripheral resistance of the lower extremity arteries. Examples of these flow patterns are seen in Chapter 24 , Fig. 24.1 . Waveforms obtained from the peripheral arteries demonstrate a triphasic pattern in the resting state with reversal of flow during diastole. This is due to branching into smaller arteries and capillary beds. The average velocity range for the abdominal aorta is 60 to 100 cm/s. A similar velocity range is expected for the major branches of the abdominal aorta.
Celiac Artery
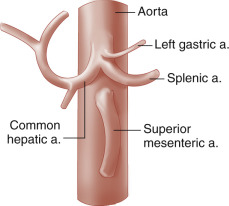
The celiac artery, also called the celiac trunk or celiac axis, is the first major visceral branch of the abdominal aorta ( Fig. 23.1 ). It arises from the anterior aortic surface, between the diaphragmatic crura. It then bifurcates about 1 to 3 cm from its origin into the common hepatic and splenic arteries, which are readily visualized with ultrasound. The celiac artery also gives rise to the left gastric artery, which is generally not visible sonographically. The branching pattern of the celiac artery is quite constant, occurring in approximately 93% of individuals. In the most common variations, one or more of the celiac branches arises separately from the aorta or from the superior mesenteric artery (SMA). In less than 1% of individuals, the celiac artery and the SMA arise from the aorta as a common trunk. In such cases, the common trunk splits into the celiac artery and the SMA within 1 or 2 cm from the aorta.
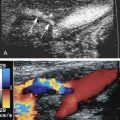
Ultrasound examination of the celiac artery usually begins with a transverse sweep of the proximal abdominal aorta. The transverse approach allows visualization of the bifurcation of the hepatic and splenic branches, usually resembling a T or “seagull” appearance ( Fig. 23.2A ). The longitudinal approach is preferred for evaluation of the celiac artery origin. We also utilize the longitudinal view for Doppler interrogation of the celiac artery. The examiner can follow the course of the vessel and optimize the angle correction of less than or equal to 60 degrees in this projection (see Fig. 23.2B ). This view also permits evaluation of the SMA, which is found just inferior to the celiac artery (see Fig. 23.2C ).
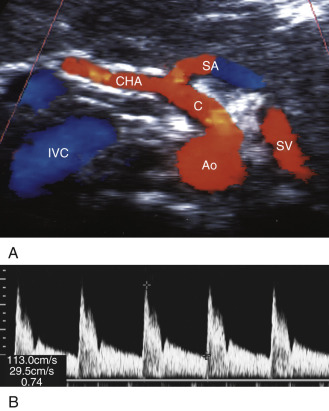
The characteristic Doppler waveform of the celiac artery demonstrates a low resistance flow pattern (see Fig. 23.2B ). As mentioned earlier, continuous forward flow throughout diastole is required for adequate perfusion of the liver and spleen. The hepatic and splenic Doppler waveforms also have this low-resistance pattern. The range of normal blood flow velocity in the celiac artery is 98 to 105 cm/s. See Table 23.1 . However, AbuRahma and colleagues reviewed 153 patients and found that the mean velocity for the celiac artery was 148 cm/s with a standard deviation of 28.42.
| Artery | Normal Velocity Range |
|---|---|
| Celiac artery | 98–105 cm/s |
| Superior mesenteric artery | 97–142 cm/s |
| Inferior mesenteric artery | 70–200 cm/s |
The mesenteric circulation is notable for extensive arterial anastomoses and a rich collateral network. This network allows for continuous circulation to the splanchnic organs in the event of stenosis or occlusion of mesenteric branches, avoiding end-organ ischemia. With occlusion of the celiac artery, there is collateralization through the pancreaticoduodenal arterial arcade, a network of small vessels surrounding the pancreas and duodenum. These vessels enlarge and feed into the gastroduodenal artery. When the proximal celiac artery is occluded, there is retrograde flow through the gastroduodenal artery to supply blood to the common hepatic artery. Thus blood supply to the liver and spleen can be maintained.
Splenic Artery
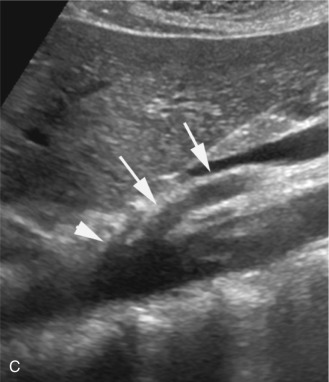
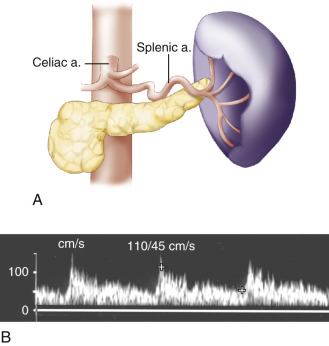
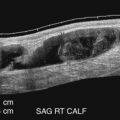
The splenic artery (limb of the celiac T toward patient’s left; Fig. 23.2 ) follows a tortuous course along the posterosuperior margin of the pancreatic body and tail ( Fig. 23.3A ) and terminates by splitting into a number of branches in the hilum of the spleen. Along the way, the splenic artery gives rise to several pancreatic branches, short gastric branches, and the left gastroepiploic artery. These vessels are usually not seen with ultrasound. Transverse scans from a midline approach usually reveal the proximal portion of the splenic artery (see Fig. 23.2A ). The distal portion of the splenic artery is best seen through the splenic hilum from a left lateral approach. The splenic artery typically takes a tortuous course to the spleen from the aorta ( Fig. 23.3A ). Spectral broadening is usually seen on the waveform display (see Fig. 23.3B ).
Hepatic Artery
The common hepatic artery ( Fig. 23.4 ) is the limb of the celiac T that heads toward the patient’s right ( Fig. 23.2 ). After running a short distance along the superior border of the pancreatic head, the common hepatic artery gives rise to the gastroduodenal artery, which can often be seen with ultrasound at the anterosuperior border of the pancreatic head. Beyond the gastroduodenal artery origin, the common hepatic artery becomes the proper hepatic artery, which follows the portal vein to the porta hepatis. At this point, it divides into the left and right hepatic arteries, which penetrate the hepatic tissue. The anatomic relationships among the hepatic artery, the portal vein, and the extrahepatic bile ducts are shown in Fig. 23.4B .
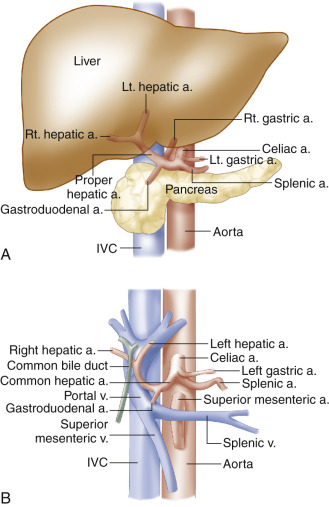
The classic hepatic artery configuration just described is seen in 72% of individuals. A number of alternative patterns may occur, the most noteworthy are the following: (1) the common (4%) or right (11%) hepatic artery may arise from the SMA and (2) the left hepatic artery may arise from a shared trunk with the left gastric artery (10%).
The hepatic arteries are usually well visualized sonographically from an anterior abdominal approach. The common hepatic artery is easily identified at its origin from the celiac artery (see Fig. 23.2A ). The proper hepatic artery is seen on ultrasound images near the porta hepatis, anterior to the portal vein, in short- or long-axis views, as can be seen in Fig. 23.5 . The right and left hepatic artery branches can be followed into the liver from the porta hepatis. As noted previously, the hepatic arterial system has low-resistance flow characteristics, with continuous forward flow throughout diastole. It is important to note that blood flow in the proper hepatic artery and portal vein are both hepatopetal, delivering blood flow toward the liver. This may be the only location where the accompanying artery and vein demonstrate blood flow in the same direction.

Superior and Inferior Mesenteric Arteries
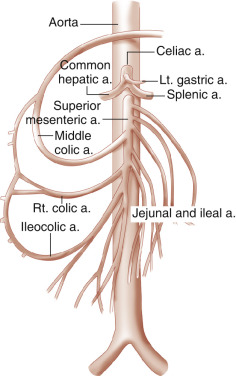
The SMA arises from the anterior surface of the aorta, immediately distal to the origin of the celiac artery ( Fig. 23.6 ). The SMA generally consists of a short, anteriorly directed segment and a much longer inferiorly directed segment that ends in the vicinity of the ileocecal valve. SMA branches supply the jejunum, ileum, cecum, and ascending colon, and the proximal two-thirds of the transverse colon and portions of the duodenum and pancreatic head. As noted previously, the SMA may also give rise to an aberrant right hepatic artery (11%) or common hepatic artery (4%). The SMA communicates with the celiac artery via the pancreaticoduodenal arcade.
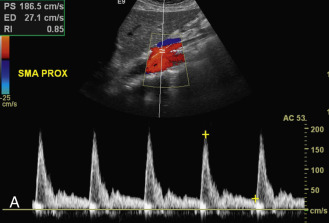
The SMA is easily identified on longitudinal or transverse ultrasound images ( Fig. 23.7A ). The SMA serves as an important landmark for identifying upper abdominal structures that are well seen on transverse ultrasound images. The SMA lies to the left of the superior mesenteric vein. The pancreas and the splenic vein lie anterior to the SMA. In contrast, the left renal vein (discussed later) lies posterior to the SMA (between the SMA and the aorta). These anatomic relationships allow the SMA to be an excellent point of orientation for abdominal scanning.
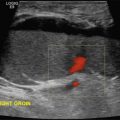
The inferior mesenteric artery (IMA) arises from the abdominal aorta below the renal arteries, above the iliac bifurcation. It originates at the left anterolateral aspect of the aorta and proceeds inferiorly and to the left ( Fig. 23.7B ). The IMA provides blood supply to the distal colon (distal third of the transverse colon, descending colon, and sigmoid colon) and proximal rectum. There are multiple collateral circuits between the SMA and the IMA, including the arc of Riolan and the marginal artery of Drummond (see Fig. 26.6 in Chapter 26 ).
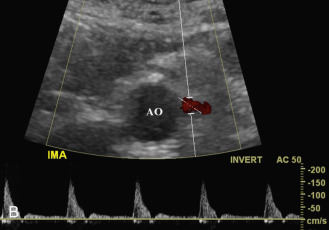
The IMA is seen in most patients studied for mesenteric vascular integrity. The best approach is a transverse view, sliding down the abdominal aorta below the renal arteries. The IMA is visualized arising from the anterolateral aorta on the left. The inferior mesenteric vein receives blood from the distal colon and rectum. It usually empties into the splenic vein, although less commonly, it may drain into the superior mesenteric vein. It is typically found to the left of the IMA and anterior to the left psoas muscle.
Color Doppler and duplex imaging of the SMA and IMA are performed along the long axis. For the SMA, a longitudinal view allows visualization of a long segment of the artery from a single projection. For the IMA, an oblique view works best because the artery courses to the left before heading inferiorly toward the distal colon ( Fig. 23.7B ). These views allow the direction of blood flow to be determined for optimal angle correction during pulsed Doppler interrogation. Doppler waveforms are usually obtained from the origins and proximal segments.
The SMA and IMA Doppler waveforms show mild spectral broadening near their origins. The flow patterns become more uniform as the vessels move distally from the aorta. In a fasting patient, a high-resistance flow pattern is seen in the SMA and IMA (see Fig. 23.7A and B ), with sharp systolic peaks and little diastolic flow. These waveforms commonly show slight reversal of blood flow early in diastole because of peripheral resistance from arterial branching. Within 30 to 90 minutes after a meal, however, the SMA and IMA waveforms tend to develop a low-resistance pattern, with broad systolic peaks and continuous diastolic flow. This change in blood flow pattern is related to vasodilatation that occurs in the mesenteric vascular beds with digestion. It is important to note that most mesenteric arterial Doppler studies are performed in the fasting state. Patients that present with low-resistance flow patterns in the mesenteric arteries will either have proximal inflow disease or they “cheated” before the study, having had a meal or snack prior to the examination. The normal peak systolic velocity in the SMA ranges from 97 to 142 cm/s. The normal range of peak systolic velocity in the IMA is 70 to 200 cm/s.
Related posts:
 Doppler Flow Imaging and Spectral Analysis
 Ultrasound Diagnosis of Lower Extremity Venous Thrombosis
 Evaluating Carotid Plaque and Carotid Intima-Media Thickness
 Risk Factors and the Role of Ultrasound in the Management of Extremity Venous Disease
 Ultrasound in the Assessment and Management of Arterial Emergencies
 Evaluation of Organ Transplants
Stay updated, free articles. Join our Telegram channel

Full access? Get Clinical Tree


