The substantia nigra and subthalamic nucleus are two key structures in the midbrain that are very important in movement disorders, particularly those associated with parkinsonism. Using conventional magnetic resonance (MR) imaging, the anatomic description of both these structures can be challenging. This article describes the importance of understanding the underlying anatomy and some of the changes associated with pathology in these structures. Advances in MR imaging are discussed, including high-field MR imaging, diffusion tensor imaging, inversion-recovery imaging, and susceptibility-weighted imaging, with particular reference to the substantia nigra and subthalamic nucleus. Understanding of MR imaging features of these nuclei needs to be firmly based on underlying knowledge of anatomy and pathology from postmortem studies, and more work is needed in this field.
Conventional magnetic resonance (cMR) imaging, including T1-weighted (T1-w), T2-weighted (T2-w) and proton-density–weighted (PD-w) images (often now in combination with fluid-attenuated inversion-recovery (FLAIR) and sometimes, T2 ∗ -weighted [T2 ∗ -w] imaging) often form the basis of standard MR imaging protocols when investigating movement disorders. Of patients with the hypokinetic-/akinetic-rigid movement disorders, those with Parkinson disease (PD) are by far the largest group, and currently, there are no significant abnormalities detected on cMR imaging. The role of cMR imaging is supportive and may be helpful in excluding structural abnormalities or normal pressure hydrocephalus, for example, in addition to aiding in the planning of stereotactic neurosurgery.
Importance of anatomic accuracy on MR imaging
The substantia nigra (SN) and subthalamic nucleus (STN) are key nuclei in PD and parkinsonian illnesses, such as progressive supranuclear palsy (PSP); the SN is severely affected in both conditions but with slightly different topography; the STN is a preferred target in stereotactic surgical techniques in PD (deep-brain stimulation [DBS]) and as a characteristic site of severe pathologic involvement in PSP. These structures and their components are often difficult to identify on cMR imaging, despite the efforts of many investigators since the 1980s, when MR imaging started to become clinically available. The recent literature has highlighted the importance of anatomic accuracy and shed some light on methods by which this may be improved. Discussion of this literature on the anatomy of the SN and STN on MR imaging will form the substance of this review and a framework for considering an approach to other small brainstem nuclei which are of increasing interest — for esample the pendunculopontine tegmental nucleus (PPN) and locus coeruleus (LC). With improvements in MR imaging technology, including higher field strength and use of diffusion tensor imaging (DTI) and susceptibility-weighted imaging (SWI), there should soon be a far greater ability to visualize these small nuclei during life. This ability should enable accurate anatomic identification of small subcortical nuclei, enhance the ability to make early diagnoses, and monitor progression of the natural history and treatment effects.
Iron and conventional MR imaging
Using cMR imaging, brain morphology and signal intensity can be assessed. Normal change associated with increasing age is an important consideration—changes in signal intensity on T2-w MR imaging reflecting, largely, the deposition of iron. In the normal human brain, iron is deposited symmetrically in the globus pallidus (GP), red nucleus (RN), SN, putamen, and dentate and caudate nuclei. In animals (monkeys), iron is also deposited in the striato-pallido-nigral and cerebellar corticonuclear systems. Iron is also deposited in the STN .
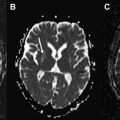
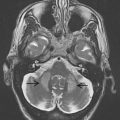
T2-w MR images at 1.5T show T2-w signal hypointensity in the GP, SN pars reticulata (SNr), RN, dentate, putamen, and subcortical U fibers and also hypointensity within the STN. These hypointense regions correlate at least partially, but not perfectly, with the distribution of iron seen on Perl stain (see later discussion) ( Fig. 1 ).
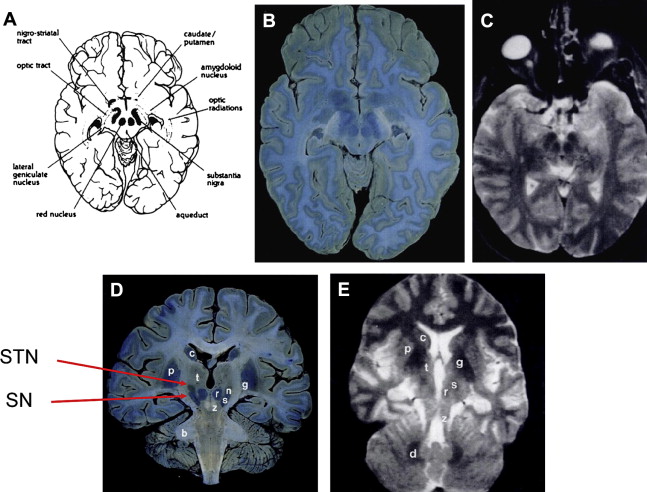
On T2-w MR imaging at 1.5T, deep gray matter nuclei are not hypointense at birth and iron is deposited sequentially in the GP, RN, SN, and dentate nuclei. By the age of 25 years, these structures are all hypointense relative to cortical gray matter. During normal adult life, the pallidum becomes progressively more hypointense but the RN, SN, and dentate remain unchanged. Changes with age in the STN are not well studied.
Iron and conventional MR imaging
Using cMR imaging, brain morphology and signal intensity can be assessed. Normal change associated with increasing age is an important consideration—changes in signal intensity on T2-w MR imaging reflecting, largely, the deposition of iron. In the normal human brain, iron is deposited symmetrically in the globus pallidus (GP), red nucleus (RN), SN, putamen, and dentate and caudate nuclei. In animals (monkeys), iron is also deposited in the striato-pallido-nigral and cerebellar corticonuclear systems. Iron is also deposited in the STN .
T2-w MR images at 1.5T show T2-w signal hypointensity in the GP, SN pars reticulata (SNr), RN, dentate, putamen, and subcortical U fibers and also hypointensity within the STN. These hypointense regions correlate at least partially, but not perfectly, with the distribution of iron seen on Perl stain (see later discussion) ( Fig. 1 ).

On T2-w MR imaging at 1.5T, deep gray matter nuclei are not hypointense at birth and iron is deposited sequentially in the GP, RN, SN, and dentate nuclei. By the age of 25 years, these structures are all hypointense relative to cortical gray matter. During normal adult life, the pallidum becomes progressively more hypointense but the RN, SN, and dentate remain unchanged. Changes with age in the STN are not well studied.
Iron in disease
Iron deposition is increased in the SN in PD, PSP, and multiple system atrophy (MSA). Iron is deposited with ferritin and also binds strongly to neuromelanin ; it is found deposited in brainstem Lewy bodies (the pathologic hallmark of PD). Most iron detected is present in ferric Fe 3+ form bound to ferritin, and in PD, iron is deposited leading to increased loading of ferritin. Little is known about iron deposition in the STN, although it does seem to be present in control postmortem tissue, and there is some indirect evidence that iron deposition is increased in the STN in PD. The role of iron deposition in the pathogenesis of neurodegenerative disease is still unclear; Zecca et al provide a review of iron in ageing and neurodegeneration.
A note on anatomic terms
The use of anatomic terms in the radiological and pathologic literature is slightly different: radiologists prefer the terms anterior, posterior, superior, and inferior, which may be referred to as ventral, dorsal, rostral, and caudal in the anatomic/histologic literature ( Table 1 ). In the region of the STN, this is more confusing because dorsal and superior may be synonymous, and indeed, this is discussed more in the section on the STN anatomy. In the following discussion, the terms anterior, posterior, superior, and inferior have been used for consistency and ease of reference.
| Anatomic | Radiological |
|---|---|
| Ventral | Anterior |
| Dorsal | Posterior |
| Rostral | Superior |
| Caudal | Inferior |
SN
The Anatomy of the SN
Location, orientation and constituent parts
The substantia nigra (SN) is found in the mesencephalon posterior (dorsal) to the crus cerebri, anterior (ventral) to the midbrain tegmentum, and just inferior to the red nucleus. It runs from the level of the mamillary nuclei down the ventral pontine nuclei. It lies inferior and lateral to the RN and takes up an oblique angle, being most lateral at its superior boundary. It is divided into 2 anatomically and functionally distinct parts: the inferior (caudal) and posterior (dorsal) SN pars compacta (SNc) containing melanized neurons, and the superior (rostral) and anterior (ventral) SNr.
Connections
The neurons of the pars compacta project to the striatum using the neurotransmitter dopamine — “the nigrostriatal pathway”—and there is a reciprocal projection from the striatum that uses (GABA), substance P, and dynorphin—“the striatonigral pathway.” The neurons of the SNr form one of the output nuclei of the basal ganglia along with the internal segment of the GP; they project to the thalamus using the neurotransmitter GABA.
Internal anatomy
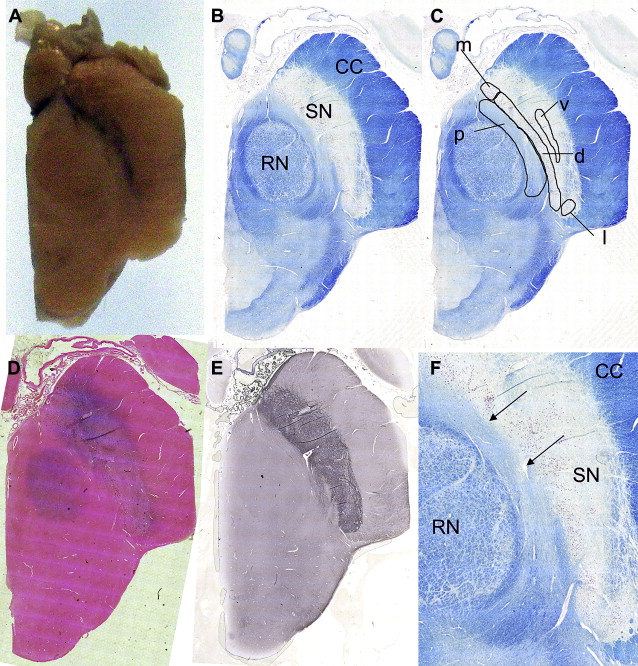
The anatomy of the SN is complex and various schemes have been proposed for the internal anatomy of neurons within it. Olzewski and Baxter described 3 tiers of melanized neurons in the posterior-anterior (dorsoventral) axis (alpha, beta and gamma). The gamma group of pigmented neurons are called the SN pars dorsalis by Damier and colleagues ; however, the use of substance P to delineate the anatomy of the SN based on the striatonigral innervation excludes this group, which is labeled the parabrachial pigmented nucleus and separates the SN and RN; Halliday provides a review of the SN anatomy ( Fig. 2 ). Within the SNc itself, Fearnley and Lees identified 2 tiers of pigmented neurons, the posterior and anterior (dorsal and ventral) tiers. These are orientated in an anteromedial block along the course of the mesencephalon. The anterior and posterior tiers can be further subdivided by anatomic location (splitting the 2 tiers into 3 subdivisions) or by using calbindin immunohistochemistry, which stains the neuropil but reveals discrete calbindin-poor zones called nigrosomes where pigmented neurons reside. The SNc also contains medial and lateral clusters of pigmented neurons (pars medialis and pars lateralis).
Pathology in the SN
Macroscopic pallor of the usually darkly stained SNc is visible to the naked eye in PD (SN literally meaning “black substance”); Fig. 2 A shows the normal macroscopic appearance. Loss of pigmented neurons at the rate of 4.7% per decade is found in normal aging, and in PD, 45% of pigmented neurons are lost in the first decade of the disease. Importantly, neuronal loss is not homogenous throughout the SN—in normal aging, the most severely affected region is the medial anterior and posterior tiers; in PD, the loss is greatest in the lateral anterior tier (ventrolateral tier). The progression of pathology in PD seems to move from the inferior anterolateral SNc and progress superiorly, medially, and posteriorly. Other neurodegenerative conditions show increased loss with different topography: the posterior tier in MSA and posteromedial tier in PSP. In PSP, the SNc is affected and there is loss of up to 70% of SNr neurons. In MSA, the SNc is more affected in MSA-P (parkinsonism type, striatonigral degeneration) than MSA-C (cerebellar type, olivopontocerebellar atrophy).
MR Imaging of the SN
Conventional MR imaging
Early MR imaging studies compared iron distribution as defined by Perl stain with reduced signal intensity (hypointensity) on T2-w MR imaging. The match was felt to be “precise”, with reduction in T2-w signal intensity and reduced T2 relaxation time in regions of most intense Perl staining. Based on signal intensity, a medial region of signal hypointensity in the midbrain was attributed to the SNr and the lateral region with higher signal intensity, to the SNc. Furthermore, “smudging“ of the SNr was seen in atypical parkinsonism, and “restoration” of the T2-w signal intensity, in the lateral SN in PD. Further studies found the correlation of Perl staining and T2-w signal hypointensity to be imperfect in other anatomic locations, with less T2-w signal hypointensity in the putamen and caudate and more hypointensity in the internal capsule, commissures, and corpus callosum than would be expected from Perl studies (see Fig. 1 ).
To clarify the situation, comparison of MR characteristics and histology in the same tissue should be instructive. However, imaging postmortem tissue to date has not significantly improved our understanding of the origin of the signal from the SN. At 2T (repetition time [TR] 800 ms, echo time [TE] 40 ms, 8 excitations) and at 1.5T (TR 500 ms, TE 25, 2 excitations), the SN was identified as a broad band of relatively bright signal between the tegmental and tectal structures. In a further comparison of histologic sections and post mortem T2-w MR images, the SN is seen as a poorly defined high-signal structure in the midbrain anterior to the relatively hypointense cerebral peduncles.
Using iron to define anatomy and in disease
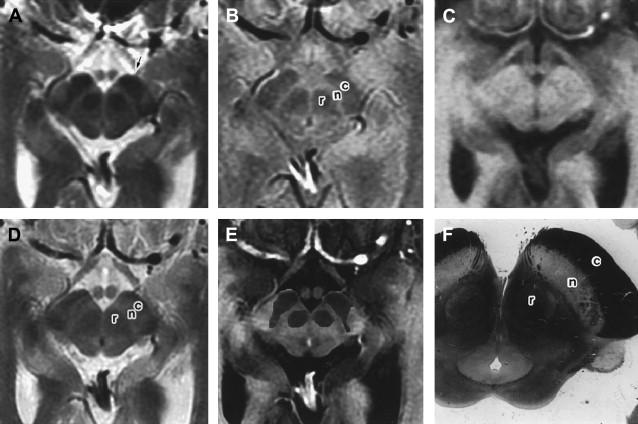
Using T2-w images to define the anatomy of the SN, it has been proposed that the SNc is represented by a region of high signal intensity, between the low signal intensity of the RN and that of the SNr in the anterior-posterior axis (see Fig. 3 ). This fits with the known distribution of iron in the RN and SNr and therefore has become the basis for the description of abnormalities seen in disease (see Fig. 2 D).
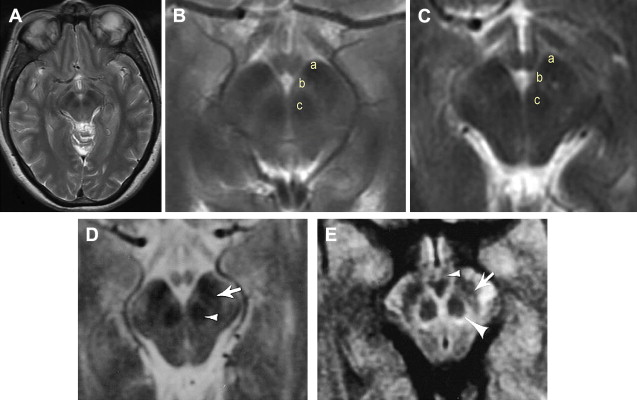
Reduced width of the SNc in PD was attributed to an increase in iron deposition in the SNr and/or loss of dopaminergic melanized neurons in the SNc. Subsequent studies also showed reduction in SNc width or described a smudging of the SNr hypointensity with reduction in the distance between the RN and the SNr in PD and also in other parkinsonian syndromes. Other abnormalities described in PD (and atypical parkinsonian illnesses, MSA and PSP) include T2-w signal hyperintensity within the SNr or restoration of normal signal intensity in the lateral SN (ie, loss of the hypointense signal). However, only one study has found a correlation between the width of the SNc and a measure of clinical severity.
MR relaxometry in the SN
If iron is the chief determinant of the MR imaging hypointensity on T2-w imaging and is also deposited during disease, measuring the T2 relaxation time may provide insight into the progression of disease. Indeed, the literature contains many attempts to use T2 relaxometry measurements as surrogate markers of disease. However, T2 measurements alone are not reliable enough; this is borne out by the fact that T2 measurements in the SN overlap in control and PD groups, and T2 measurements are affected by local iron-induced field inhomogeneities and the differing magnetic susceptibilities of tissue interfaces, thus reflecting global field inhomogeneities.
Using a gradient recalled-echo sequence to measure T2 and T2 ∗ at 3T, it is possible to discriminate between PD and control cases based on T2′ (a component of T2 ∗ that is a more specific measure of tissue iron) and R 2 ‘ (1/T2’). Additionally, R 2 ‘ measurements correlate with simple motor scores in PD, implying a relationship between clinical features, iron deposition in the SN, and R 2 ‘. This is also found using the partially refocused interleaved multiple echo (PRIME) MRI sequence to measure R 2 ∗ and R 2 ‘ relaxation rates, which are higher in the SN of PD than in controls at 1.5T.
The role of field strength and novel iron-sensitive techniques
Field strength is a crucial consideration, because relaxation rates theoretically increase (inversely as relaxation times fall) with magnetic field strength and the concentration of iron. Measurement of iron/ferritin specifically using field-dependent R 2 increase (FDRI) at 0.5T and 1.5T showed an increase in FDRI in SNc and SNr in addition to other regions (GP, putamen, caudate nucleus, and frontal white matter) in patients with PD younger than 60 years. Later-onset patients had decreased FDRI compared with age-matched controls, which may have been because of reduced iron/ferritin and increased free iron deposition, although the influence of age-related changes in iron deposition should also be considered.
Later, novel iron contrast sequences were used at 4T showing asymmetrical differences in the SN in PD, and quantitative differences in PD from controls attributed to iron deposition (using T 2ρ ) and neuronal loss (using T 1ρ ) in the SN; these changes were seen despite no significant changes in T2 being observed.
In addition, the regional predilection of PD for the anterolateral SNc has been studied using multiple gradient-echo MR imaging at 3T to measure R 2 ∗ in a paradigm designed to minimize magnetic field inhomogeneities arising from tissue-tissue and air-tissue interfaces; regional increase in iron content as evidenced by increased R 2 ∗ in the lateral SNc was found in early untreated PD, which correlated with United Parkinson Disease Rating Scale scores.
Defining the anatomy of the SN on MR imaging
Ever since the original description of the anatomy of the SN on MRI, there has been concern about the accuracy of the anatomic correlation. The description of the high-signal band on T2-w images corresponding to the SNc has been questioned. Immunohistochemical techniques suggest that the SNc does not extend all the way to the RN and that pigmented neurons in this location are part of the parabrachial pigmented nucleus. There are also white matter tracts in this region, and rather than representing the SN, the hyperintense T2-w band could be the site of white matter of the nigrostriatal tracts. Furthermore, signal changes attributed to the SN using different MR imaging modalities appear to have different precise anatomic origins (see later discussion).
PD-w and fast short inversion time inversion-recovery imaging
PD-w and fast short inversion time inversion-recovery (FSTIR) enhance gray matter-white matter contrast thereby reducing the effect of “iron-related” mechanisms of T2-w imaging. The SN appears as a tilted bandlike structure of hyperintense gray matter, without discriminating between the SNc and SNr ( Fig. 4 ). On coronal images, the SN is seen inferolaterally to the RN, and on sagittal images, anteroinferiorly. This is in line with anatomic descriptions of the SN and is different in location to that of the hypointense regions seen on T2-w images, which has been attributed to the SNr. Comparison of FSTIR with Perl stain shows that the hypointense region overlaps only with the most superior and anterior portion of the SN ( Fig. 5 ).
Segmented inversion-recovery imaging
Heavily T1-w inversion-recovery images show signal abnormalities in the SN in PD at 1.5T. On so-called gray-matter suppressed (GMS) inversion-recovery sequences, there is increased signal in areas of degeneration; on white-matter suppressed (WMS) sequences, the signal is reduced in the same regions. Using a ratio of inversion-recovery acquisitions, WMS to GMS, the sensitivity of the signal changes is increased. A gradient of increasing signal abnormality from medial to lateral and inferior is found in PD. A radiological index of the lateral and medial SN signal correlates with clinical severity. Using the WMS image to define the boundaries, an automatic segmentation technique can be applied to extract the SN (called segmented inversion-recovery imaging [SIRRIM]). In PSP, a reverse gradient is seen, with the most severe changes being medial, and the known atrophy of the SN can be visualized ( Fig. 6 ). SIRRIM could potentially distinguish PD from healthy controls and from essential tremor, PSP, and MSA and may be potentially sensitive enough to assess changes in the early course of the disease. However, in other studies, this technique was not as robust as 18 F-Dopa PET in distinguishing control from PD or parkinsonism (PD or parkin mutation-positive parkinsonism), with 67% of parkin mutation-positive patients, 44% of PD patients, and 25% of controls identified as abnormal. However, more generalized signal changes are seen in patients with parkin mutation who have more widespread nigral pathology, which may in part be because of the longer disease duration of parkin patients. Although there are clearly technical problems to overcome, including aspects of acquisition and processing (eg, division versus subtraction of GMS and WMS images), and problems with artefactual appearances, high variance in data, and the issue of field strength, abnormalities when present reflect the pathologic topography. Further nonsubjective quantitative analysis of the spectra from the SN using SIRRIM, the spin-lattice distribution index, may be more accurate and less user-dependent, but further studies are needed. Three-dimensional techniques of acquisition of GMS and WMS data enable accurate segmentation of the SN using the driven-equilibrium single-pulse observation of T1 acquisition.
Imaging neuromelanin
Melanin has been shown to increase longitudinal T1 relaxation rates in vitro, and thus, the LC and SN on T1-w fast spin-echo (FSE) images at 3T may appear hyperintense. At 3T, the combination of increased spatial resolution, the doubling of the signal-to-noise ratio (SNR), and the prolonging of T1 relaxation times in combination with FSE-related off-resonance magnetization transfer effects suppressing brain tissue signal all contribute toward this finding. The location of the T1-w hyperintense signal matches the distribution of melanized neurons in the SNc and LC in control postmortem tissue. In PD, the hyperintense signal is lost as expected. This approach can be used to visualize age-dependent changes in the LC. The role of iron in the SNc may mask the effect of prolonging T1 via susceptibility effects; this may explain why the changes in the SNc are less remarkable than in the LC.
Diffusion-weighted imaging
The boundaries of the SN may be more accurately seen by assessing the structures immediately surrounding the SN, rather than the signal from the SN itself. The orientation of white matter tracts in the midbrain makes them a useful marker of the SN borders; using multishot diffusion-weighted images, the outline of the SN is clearly visualized. The SN is represented by a crescent of low signal intensity situated between the higher signal of the tegmentum of the midbrain and the cerebral peduncle (see Fig. 1 C, D). The SN is most clearly seen when the orientation of the diffusion gradient was in the left-right direction, perpendicular to the pyramidal tracts (superior-inferior) and those between the SN and RN that are orientated anterior-posterior (see Fig. 2 F). When the width of the SN is measured in PD, it is within the normal range, but secondary parkinsonism is associated with SN atrophy. This is in line with pathologic studies where atrophy of the SN is not prominent in PD.
The importance of understanding the pathologic topography is illustrated in the recent literature. Early quantitative MRI measurements within the whole SN showed no significant difference in regional apparent diffusion coefficient (rADC) in PD, MSA-P, and PSP. Later, a significant reduction in fractional anisotropy (FA) and nonsignificant increase in ADC were found in a medial SN region of interest in PD, which correlated inversely with clinical severity, although the separation was not great enough to enable this technique to be used as a diagnostic marker. However, using high-resolution DTI at 3T, the most lateral SN region of interest had significantly lower FA in early (<2 years) untreated PD and enabled discrimination from an unaffected cohort with 100% sensitivity and specificity. Reduced FA along the path of the nigrostriatal projection is evident, particularly in regions of interest near the SN in PD. Furthermore, FA loss is observed along the nigrostriatal projection in PD and PSP, and in among other regions, the STN, GP, and cortex in PSP, as would be expected from the pathology.
Magnetization transfer imaging
Magnetization transfer imaging (MTI) relies on the transfer of energy between protons bound in macromolecules, such as myelin, and those in mobile molecules, such as water. Changes correlate with myelin and axonal density, and as such, MTI enables good contrast between gray and white matter. The SN can be clearly seen as a region of relatively increased signal in comparison with the cerebral peduncles and RN on magnetization transfer saturated images. MTI has been proposed recently as a more reliable technique than T1-w images, which are conventionally used for segmentation of subcortical gray matter structures. This is particularly important as the SN is not well-defined on T1-w images.
STN
Anatomy of the STN
Location, composition and orientation
The STN was first described by Luys in 1865, but the clinical significance of this structure was not obvious until the description of hemiballism arising from a vascular lesion in the region of the STN. The STN contains approximately 550, 000 projection neurons in humans. It lies in the mesencephalon and is an almond-shaped structure; the internal capsule is on its anterolateral border and the fields of Forel and hypothalamus (with which the borders are blurred) on its medial border, with the SN ventrally (inferior and lateral), and the zona incerta (ZI) and lenticular fasciculus dorsally (superior and medial) positioned. It is obliquely orientated with regard to standard anatomic axes being 20° oblique to the horizontal plane, 35% oblique to the sagittal plane, and 55° oblique to the frontal plane. Its dimensions are approximately 3×5×12 mm in humans.
Connections
From its medial border runs the subthalamic fasciculus to the pallidum across the internal capsule. Projections from the pallidum (ansa lenticularis and lenticular fasciculus) encase the STN after their passage through the internal capsule and on their way to the thalamus, before joining with the fibers from the RN and brainstem to become the thalamic fasciculus. Afferent connections to the STN come from the cortex (glutamate), the external segment of the GP (GABA), the thalamus (glutamate), the SNc (dopamine), the PPN and laterodorsal tegmental nucleus (acetyl choline, glutamate), the dorsal raphe nuclei (serotonin), and other nuclei. The main efferent projections (glutamate) are to the internal and external segments of the GP, the SNc and SNr, the striatum and brainstem nuclei, including the PPN, and the anterior (ventral) tegmental area. The projections maintain topography and are complex single neurons projecting to more than one of the basal ganglia output structures.
Internal anatomy
The STN can be divided into 3 sections determined by its connectivity: the dorsolateral portion forms part of the sensorimotor circuit; the ventromedial portion, the associative circuit; and the medial portion, the limbic circuit.
The STN lies in the mesencephalon at the junction of the rostral Meynert brainstem axis and more caudal Forel brainstem axis, which lie at an angle of approximately 90° to 105° to each other. This has led to some confusion about the use of the terms dorsal and ventral and some have proposed that the sensorimotor STN, which has been ascribed the anatomic label of “dorsolateral,” should be referred to as the anterior, lateral, and superior STN, suggesting that superior may be less ambiguous than dorsal in the context of STN anatomy.
Iron in the STN
Along with other structures in the basal ganglia, iron is known to be deposited in the STN ( Fig. 7 , also see Fig. 1 ). Although not commented on, this is clearly visible in the article by Rutledge and colleagues. However, there is no published data on how this changes with age or disease, although there is some indirect evidence of increased iron deposition in the STN in PD.
Related posts:
 Brain Magnetic Resonance Imaging Techniques in the Diagnosis of Parkinsonian Syndromes
 Current Role of Functional MRI in the Diagnosis of Movement Disorders
The Role of Imaging in the Diagnosis of Vascular Parkinsonism
Current Role of Functional MRI in the Diagnosis of Movement Disorders
The Role of Imaging in the Diagnosis of Vascular Parkinsonism
 How Can Neuroimaging Help in the Diagnosis of Movement Disorders?
The Role of Imaging in the Surgical Treatment of Movement Disorders
How Can Neuroimaging Help in the Diagnosis of Movement Disorders?
The Role of Imaging in the Surgical Treatment of Movement Disorders
 Role of Transcranial Ultrasound in the Diagnosis of Movement Disorders
Stay updated, free articles. Join our Telegram channel

Full access? Get Clinical Tree


