Transcranial B-mode sonography (TCS) may provide supplementary information to other neuroimaging methods, adding valuable information to the diagnosis and differential diagnosis of movement disorders. The value of TCS in the differential and early diagnosis of Parkinson disease (PD) has been proven. There is increasing evidence that substantia nigra hyperechogenicity, the ultrasound marker typical for PD, may disclose a nigrostriatal vulnerability if found in healthy people, which may contribute to defining high-risk groups for this neurodegenerative disorder. This article provides information about the ultrasound procedure, its specific diagnostic value, and its limitations. Pathophysiologic mechanisms leading to changes in the reflection of ultrasound waves are discussed.
Ultrasound of intracranial structures such as brain vessels or parenchyma through the intact skull was believed to be impossible until the 1980s. Since then, with ongoing improvements in the ultrasound technique, especially the development of transcranial color-coded sonography, ultrasound has gained increasing importance in the diagnosis of cerebrovascular disorders. In the early 1990s the first reports showed the possibility of differentiating main brain parenchymal structures sonographically in different parts of the brain, from the pontine brainstem to the parietal lobes, including the ventricular system and brainstem structures. With this method visualization of brain tumor tissue and cerebral hematomas was possible by ultrasound. In 1995, Georg Becker and his group described for the first time a disease-specific sonographic finding in Parkinson disease (PD): hyperechogenicity of the substantia nigra (SN). This finding began a new era of transcranial sonography. There had been no way of visualizing structural changes in PD using other structural neuroimaging techniques; this limitation in diagnosis was first challenged by the finding of the typical hyperechogenicity of the SN in PD.
Transcranial B-mode sonography (TCS) in movement disorders was met with scepticism from the scientific community, because it was hard to believe that a method for overcoming the acoustic bone window might show disease-specific abnormalities that could not be shown by other well-established structural neuroimaging methods. Since then, however, TCS results have been confirmed and extended by several independent groups internationally (see later discussion). TCS has become a reliable and valuable tool for the diagnosis and differential diagnosis of PD and other movement disorders. Because TCS is broadly available, quick to perform in moving patients, and inexpensive, it is worth considering as a supplementary diagnostic neuroimaging tool in general practice. This article provides a comprehensive summary on the ultrasound technique, the typical findings, and their value in the diagnosis and differential diagnosis of PD and other movement disorders.
Technique: how to perform TCS
For TCS, a high-end ultrasound machine as applied in transcranial color-coded cerebrovascular ultrasound equipped with a 1.8- to 3.5-Mhz transducer should be used. An overview of the various systems that have been applied in studies is given in Table 1 . Table 2 summarizes standard system settings from the authors’ laboratory, which need to be individually optimized depending on the ultrasound system applied.
| N | References | |
|---|---|---|
| Advanced Technologies Laboratories (Washington, DC, USA) | ||
| Ultramark 3000 | 1 | |
| Ultramark 9 | 1 | |
| General Electric (Milwaukee, WI, USA) | ||
| Logiq 7 | 2 | |
| Philips (Eindhoven, Netherlands) | ||
| HDI 5000 | 2 | |
| SONOS 4500 | 3 | |
| SONOS 5500 | 3 | |
| Siemens (Erlangen, Germany) | ||
| Sonoline CF | 3 | |
| Sonoline Elegra | 35 | |
| Acuson Antares | 1 | |
| Toshiba (Tokyo, Japan) | ||
| SSH-140A | 1 | |
| Aplio | 1 | |
| Ultrasound transducer | 1.8–3.5 MHz |
| Penetration depth | 14–16 cm |
| Dynamic range | 45–55 dB |
| Contour amplification | Medium–high |
| Postprocessing parameters | Moderate suppresion of low echo signals |
| Time gain compensation | Adjust as needed |
| Image brightness | Adjust as needed |
Scanning Procedure
The patient is in supine position, and the examiner usually sits at the head of the examination table. The examination is performed consecutively from each side, using the posterior or middle temporal bone window. For evaluation of certain brain structures, including the mesencephalic brainstem, the basal ganglia, and the ventricle system, standardized axial scanning planes are used. Several publications give detailed descriptions of the various brain structures and sonographical landmarks that can be depicted in these planes.
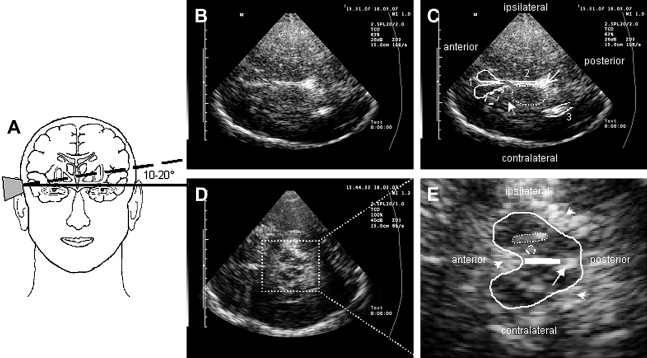
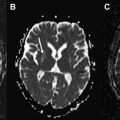
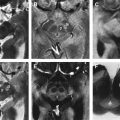
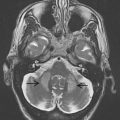
To approach the plane of the mesencephalic brainstem, the ultrasound probe is placed at the temporal acoustic bone window in parallel to the imagined “orbitomeatal line” ( Fig. 1 A ). In this plane, the butterfly-shaped structure of the mesencephalic brainstem, which is surrounded by the highly echogenic basal cisterns, can easily be delineated. Within the brainstem, several structures, including SN, red nucleus (RN), the brainstem midline raphe, and the aqueduct, can be visualized ( Fig. 1 D, E). For evaluation of basal ganglia and ventricles, the ultrasound probe is slightly tilted 10° to 20° upwards with respect to the midbrain plane (see Fig. 1 A). In this plane, the third ventricle, the anterior horn of the contralateral lateral ventricle and the anatomic site of the basal ganglia and the thalamus can be depicted ( Fig. 1 B, C). Structures close to the midline (SN, RN, raphe) are assessed at the side that is ipsilateral to the ultrasound probe. Structures more distant to the midline are assessed contralaterally to the probe.
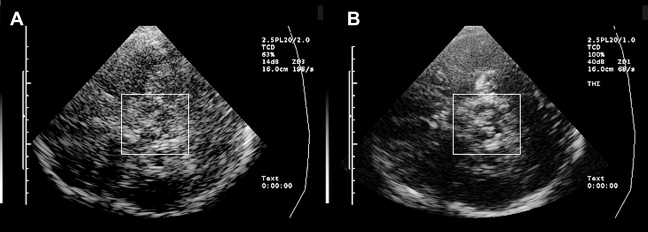
Optimal tissue contrast and resolution may be achieved using the harmonic ultrasound reflections (tissue harmonic imaging, THI). However, because this technique is more dependent on the quality of the acoustic bone window and is often limited concerning insonation depth, B-mode is required by convention for all quantitative and semiquantitative assessments ( Fig. 2 ). Structures within the brainstem and the basal ganglia are denoted “hyperechogenic” when either the area (ie, of the SN) or the intensity (ie, hyperechogenicities in the basal ganglia) of the reflected signal are abnormally increased in contrast to the surrounding tissue. “Hypoechogenicity” is used to denote when the area or the intensity of the echogenic signal is abnormally decreased (ie, at the midline raphe).
Typical Sonographical Features
Mesencephalic brainstem
For clinical evaluation, assessment of the, in general, highly echogenic structures of SN, RN, and raphe within the hypoechogenic midbrain is essential.
SN
The SN is a patchy or tie-shaped echogenic structure, visible bilaterally in the butterfly-shaped midbrain. The echogenic structure should be visualized at its greatest extension to allow valid assessments. The extension can be biased by adjacent highly echogenic structures such as penetrating vessels or the RN, which need to be differentiated as clearly as possible. When the best depiction of the SN is achieved, the image is freezed and magnified 2- to 4-fold. For quantitative assessment the ipsilateral area of echogenicity of the SN is manually encircled with the cursor and its area is calculated automatically (compare Fig. 1 E). SN hyperechogenicity is determined as an increased area of SN echogenicity, whereas SN hypoechogenicity is determined as diminished areas of SN echogenicity.
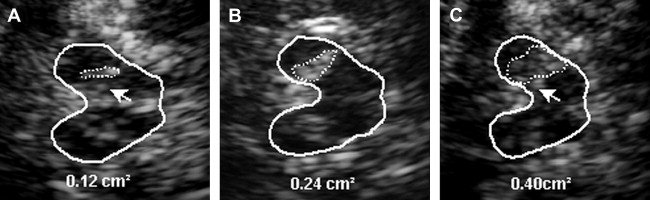
Cutoff values for increased and decreased SN echogenicity need to be established for each individual ultrasound system. SN areas of echogenicity above the 75th percentile of the normal population are classified as “moderately hyperechogenic,” SN areas of echogenicity above the 90th percentile are classified as “markedly hyperechogenic” ( Fig. 3 ). For the most frequently used ultrasound system in studies (Siemens Sonoline Elegra, Erlangen, Germany), cutoff values are 0.20 cm 2 for moderate and 0.25 cm 2 for marked hyperechogenicity. Values less than 0.20 cm 2 are considered normal. SN hypoechogenicity is not yet clearly defined; however, several studies demonstrated SN hypoechogenicity when SN areas of echogenicity ranged below the 10th percentile. Because of the limitations of resolution when small areas of SN echogenicity are assessed, values are normally given as sum values of both sides in the assessment of SN hypoechogenicity.
Raphe
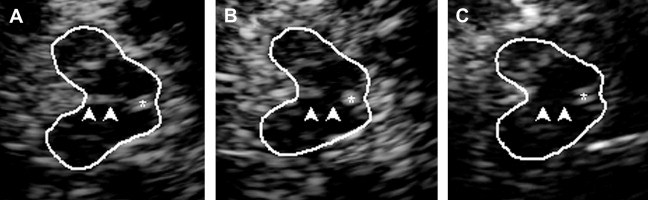
The highly echogenic brainstem midline structure represents the brainstem raphe. When the third ventricle is enlarged (see later discussion) the bottom of the third ventricle may be mistaken for the raphe. Therefore, scanning for raphe echogenicity should include the whole mesencephalic brain stem with special emphasis on the lower mesencephalon. The raphe is rated semiquantitatively using the echogenicity of either the RN or the basal cisterns as reference points. Normally, the raphe constitutes a continuous highly echogenic line. When this line seems interrupted or not visible (ie, isoechogenic to the brainstem parenchyma) the raphe is classified as hypoechogenic ( Fig. 4 ). The side of best visibility of the raphe is considered for assessment.
Related posts:
 Brain Magnetic Resonance Imaging Techniques in the Diagnosis of Parkinsonian Syndromes
 Current Role of Functional MRI in the Diagnosis of Movement Disorders
 Anatomy of the Substantia Nigra and Subthalamic Nucleus on MR Imaging
The Role of Imaging in the Diagnosis of Vascular Parkinsonism
Anatomy of the Substantia Nigra and Subthalamic Nucleus on MR Imaging
The Role of Imaging in the Diagnosis of Vascular Parkinsonism
 How Can Neuroimaging Help in the Diagnosis of Movement Disorders?
 Role of Neuroimaging in the Evaluation of Tremor
Stay updated, free articles. Join our Telegram channel

Full access? Get Clinical Tree


