Fig. 1
A hypothetical idealized organ made up of 100 cells (circles), exposed to a dose of radiation that will kill (black cells) 50 % of the cells. For illustrative purposes, it is assumed that a FSU, represented by—boxes, becomes dysfunctional (gray filled boxes) if there are fewer than 5 cells remaining (i.e., if there are ≥5 cells remaining, then the FSU can be repopulated to be functional). Note how the number of FSU’s that are functional after the radiation changes dramatically as the number of cells per FSU (and the total number of FSUs within the organ) changes. If there is 1 cell per FSU (left side), then 50 % of the FSU remain functional. If there are 100 cells per FSU (right side), then that FSU would remain functional. The middle panes reflect an intermediate of 10 cells per FSU, resulting in 70 % FSUs remaining functional (though conceptually this could range from 50–100 % depending on the distribution of damage to the 100 cells). Cell repopulation is not depicted in this figure
Thus, the observed global sensitivity of an organ will depend on the inherent sensitivity of the target cells, as well as the number of target cells within a FSU. For example, in the kidney, each nephron has a proximal tubule, loop of Henle, and the distal tubule that are dependent on each other. One might consider the FSU to be the entire nephron, or more likely, the most sensitive subcomponent of the nephron (e.g., perhaps the arteriolar-glomerular interface). The relatively few number of cells per FSU might explain the sensitivity of the kidney to radiation, despite the large number of nephrons (or FSUs) within the kidney. FSUs are thus an often-useful construct, though it is not widely applicable to all organs. Even in the kidney, there are some inter-tubule dependencies. For example, the nephrons cannot concentrate urine without the concentration gradient created by the other nephrons globally.
2.
Organizational structure between FSUs: A related consideration is the manner in which FSUs are ‘connected to each other’ to yield the overall organ function (Fig. 2). Normal organs can be broadly classified as having a parallel versus series architecture, analogous to electrical circuits (Hall and Giaccia 2012; Marks 1996; Withers and Taylor 1993). In parallel organs, regions of an organ can be damaged without necessarily impairing global organ function, since the other regions retain function. Just as a surgeon can remove regions of the lung, liver, or kidney, without demonstrable impact on global organ function, large regions of these organs can be similarly irradiated to “locally-damaging” radiation doses. The global response of such “parallel organs” depends largely on the volume of organ affected. There is typically little effect on global function until a “critical volume” of the organ is affected, at which point global organ function can become compromised.
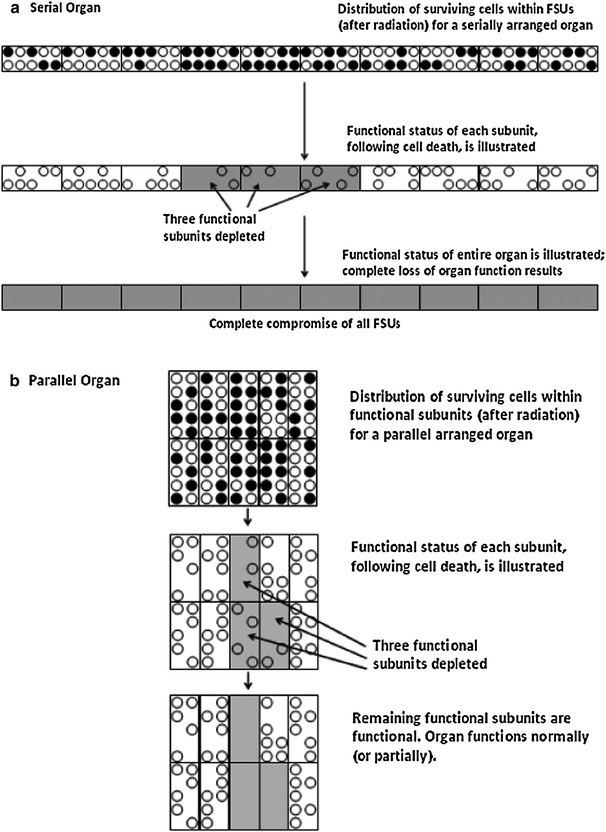

Fig. 2
Illustrative comparison of serial versus parallel organs. In this figure, the hypothetical example (depicted in Fig. 1) of 10 cells (circles) per functional unit (square) is shown, after radiation in which 50 % of cells are killed (black circles), and FSUs with five or more cells remain functional after radiation. Figure 2a shows an organ in which FSUs are arranged in series; the organ’s function is dependent upon connectivity to its neighboring FSUs. For organs with FSUs arranged in series (a) damage to 1 or more FSUs (3 are damaged in figure) results in complete compromise of that component (i.e., loop of bowel, or region of spinal cord). For organs in which FSUs are arranged in parallel (b) damage to a portion of FSUs (3 shown in figure) results in partial, or no apparent, organ compromise. Repopulation within the FSUs is not shown
Conversely, in “series” organs, dysfunction of one region may render the entire organ dysfunctional. This might be the case for nerves, esophagus, intestines, or bronchi. For example, a stricture in one portion of the esophagus or bowel renders the region of esophagus or bowel both proximal and distal to that injury essentially nonfunctioning. The response of such series organs to radiation is most dependent on the maximum dose delivered to that organ (e.g., a focal hotspot in the spinal cord can cause major neurologic dysfunction).
2.2 Distribution of Function
The above discussion is idealized as many organs as typically not uniform. Thus, organs can be considered to have homogeneous versus heterogeneous function throughout. In homogeneous organs, different regions of the organ are relatively functionally equivalent. This might be the case for healthy lung, liver, and kidney. Nevertheless, even in these settings, there may be some regional differences in functional importance (e.g., a more favorable ventilation/profusion ratio in the lung bases versus lung apices). In other organs, variations in regional function are readily apparent (e.g., heart, brain). In these organs, the risk of radiation-associated injury is also related to the spatial distribution of radiation dose within the organ (e.g., “is the hot spot in the brain stem [critical] vs. the anterior tip of the temporal lobe [less important]). It may not be enough to know that 20 % of the organ is receiving >40 Gy; one may need also to know which 20 % of the organ is irradiated.
A good example of this phenomenon is the brain. In patients treated with radiosurgery, there is a nice relationship between the prescribed radiation dose, and the incidence of radiographic-defined radiation injury. For this endpoint, the risks are relatively similar in different regions of the brain. However, for the endpoint of symptomatic injury, the location of the effected region is critical (Flickinger et al. 2000).
Table 1 illustrates the association between the concepts of parallel versus series, and heterogeneous versus homogeneous function. Note that the distinctions are not always clear. Some organs may be considered parallel in some regards, but serial in others. For example, for the endpoint of stricture, the bowel may be considered a series organ. Conversely, for the endpoint of ulceration/bleeding, the organ may be considered parallel. These distinctions are imperfect. The different regions of small bowel are relatively homogeneous in function, but there are clearly regional differences. The entire digestive apparatus can be considered as a heterogeneous series (e.g., esophagus, stomach, intestines).
Table 1
Association between concepts of parallel versus series and heterogeneous versus homogeneous function
|
Homogeneous
|
Heterogeneous
|
|
|---|---|---|
|
Parallel
|
Liver, Kidney, Lung, Alveoli (Gas Exchange)
|
Brain, lung with COPD, Heart, Spinal cord
|
|
Series
|
Small bowel, Nerve, Esophagus
|
Optic chiasm and nerves, Digestive Tract, Lung airways (gas conduction)
|
2.3 Different Paths, Different Organs, Same Outcomes
Different types of injuries can lead to the same clinical outcome. For example, damage to the alveoli (small FSUs organized in parallel), or damage to the trachea (a likely larger FSU organized in series) can both lead to shortness of breath. Similarly, adding another level of complexity, symptoms such as dyspnea can reflect lung injury, as well as heart injury, chest wall fibrosis, anemia, or any combination of the above. These realizations make the study of radiation-associated normal tissue injury even more complex and interesting.
In summary, one could then think of organs as being comprised of FSUs, which are arranged in parallel or series. The number of cells per FSU (as a theoretical construct) describes the inherent radiation sensitivity of the organs components, and the arrangement of the FSUs (parallel or series) describes how FSU damage from radiation impacts organ function. It should be recognized that the concept of a FSU describes a model used to explain differences in radiation sensitivity between organs. The notion that the FSU represents a separate functional unit, and that remaining cells within the FSU can repopulate the FSU in a sense is assigning two conflicting characteristics to the FSU cells: (Rubin and Casarett 1968) independent organ function and (Michalowski et al. 1984) progenitor cell differentiation to functional cells. The FSU construct also does not account for other important mediators of late effects, including small vessel vascular injury and inflammation. While all organs possess similar vascularity, conceivably, differences in radiation sensitivity between organs could reflect differences in vascular redundancy or angiogenesis after radiation. The inflammatory reaction after radiation to some extent is systemic, and therefore similar for all organs (as manifested by the release of serum cytokines). However, local inflammatory reactions, or inflammation in the setting of specific organ conditions may result in different susceptibilities to late effects. Figure 3 depicts the complicated multifaceted nature of late effects after radiation.
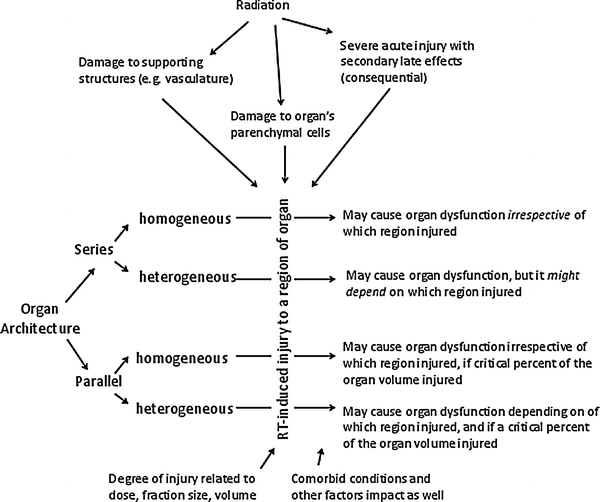

Fig. 3
There are many variables which impact development of late effects, as described in the text
2.4 Other Confounding Factors
The study of radiation-associated normal tissue injury is also confounded by the increasing use of systemic agents for cancer therapy. Concurrent systemic agents (i.e., chemotherapy) with radiation are used for the treatment of many malignancies, to augment the effect of radiation. Incorporating chemotherapy into predictive models is challenging, as the dosing/schedules of these drugs vary, and there are often new agents being added into the mix. The exact timing of the drugs relative to the radiation treatment delivery likely impacts the degree of interaction. Furthermore, chemotherapy in the absence of radiation can result in late normal tissue effects (i.e., cardiotoxicity from anthracyclines). Often patients receive chemotherapy prior to or after radiation, and accounting for the possible interactions of these different therapies can be complicated. Likewise, prior surgical interventions can result in late complications, often resulting from post-surgical scarring and vascular disruption, as can direct effects from the tumor itself, presenting even more confounding variables.
The risk of delayed effects is further compounded by the possibility of “consequential late effects,” which can develop from healing that occurs after a severe acute radiation reaction. For example, in a study from Duke, the major determinant of late esophageal stricture was the severity of the acute reaction (Ahn et al. 2005). Consequential late effects have also been described in the rectum and other organs with a brisk acute reaction (Fig. 3).
3 The Impact of Endpoint Selection
A variety of approaches can be taken to define and score radiation-associated normal tissue injury, and the approach taken will impact the reported injury rate. Endpoints might be broadly categorized as symptomatic/clinical (e.g., shortness of breath), imaging-based (e.g., changes on chest X-ray or CT), or analytic (e.g., reduction of pulmonary function tests or alterations in serum markers such as BUN and creatinine to assess renal function, liver enzymes, and albumin to assess liver function and TSH and thyroid hormone levels to assess thyroid function). The degree to which these different types of endpoints are related to each other is variable and organ-dependent. For example, endpoints of interest among patients undergoing thoracic radiation include shortness of breath (clinical), pulmonary function tests (analytic), and chest CT (imaging). Patients who have a decline in pulmonary function tests may be more likely to complain of shortness of breath compared to patients without a decline in pulmonary function tests. However, the presence of a change on radiographs may or may not be associated with the complaints of shortness of breath.
Furthermore, specific clinical endpoints may reflect either a regional injury (e.g., structure of the esophagus), or a global dysfunction (e.g., hepatic renal insufficiency). Most analytic endpoints are reflective of global organ function (e.g., liver function tests, creatinine, pulmonary function tests). There are some association between the different endpoints and their impact on global function, and their relationship with each other, and the organ’s structure (parallel vs. series, and heterogeneous vs. homogeneous). For example, imaging typically can detect changes in regional structure/anatomy. Again in the lung, there is very good data that relates regional radiologic changes (in tissue density [CT] or blood perfusion) to regional radiation dose (Mah and Van Dyk 1988; Marks et al. 1997; Ma et al. 2009, 2010; Boersma et al. 1993). However, the degree to which the “average” regional radiographic change relates to the change in global function is far less clear. In several studies, the sum of regional injuries (or the average change in regional imaging) is only weakly related to changes in global function (Fan et al. 2001a, b; Seppenwoolde et al. 2004). Further, the relationship between the sum of regional injuries and changes in global function will necessarily relate to the distribution of a function within the organ (i.e., is the “global” function impacted equally by each region of the lung). Figure 4 depicts an example of the interaction between the various endpoints after radiation to the lung.
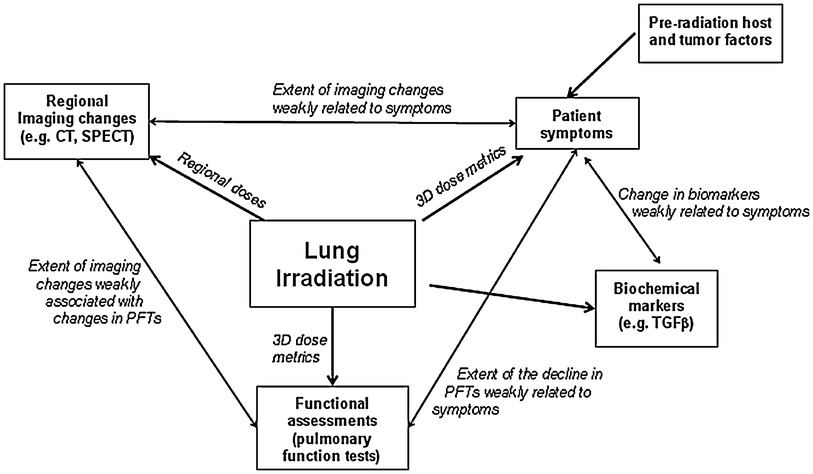

Fig. 4
A schematic representing the impact of localized radiation to the lung on global subjective and objective pulmonary function. Regional lung radiation is associated with reasonably well described dose-dependent regional imaging changes. The sum of regional injuries (perhaps reflected by the regional imaging changes) is weakly associated with changes in global lung function (e.g., pulmonary symptoms, objective declines in pulmonary function) or cytokine release. A similar construct could also be considered for the heart where there are also dose-dependent changes in regional myocardial perfusion, and where the presence/severity of these regional perfusion defects is perhaps weakly related to changes in regional function (e.g., regional wall motion) or global function (e.g., ejection fraction)
4 Tolerance Dose and Dose/Volume/Outcome Considerations
4.1 Historical Background
4.1.1 Introduction: Historical Perspective, Background, and Significance
The need to precisely measure and quantify the radiation dose became evident with its discovery by Roentgen and the Curies. The early pioneers unwittingly exposed themselves to radiation in exploring its possible applications in medicine and ultimately realized that radiation resulted in adverse normal tissue reactions. The initial observation of skin erythema and alterations in blood/bone marrow translate in time to neoplasia, which proved fatal. Radiation claimed the lives of its researchers who became its “martyrs,” sacrificing themselves to uncover its potential uses. Through decades of research, the benefits of therapeutic radiation were realized, and ultimately, the field of Radiation Oncology was born.
Radiation is a double-edged sword as a treatment modality in that it cures and injures simultaneously. In the early years of therapeutic radiation, with the use of relatively low energy radiation, skin toxicity was the primary dose-limiting factor. With the introduction of megavoltage radiation therapy, the radiocurability of a large variety of cancers became possible due to improved capability of delivering therapeutic dose to greater depth. Historically, radiation therapy fields/doses were selected empirically, based largely on experience. Physicians relied on clinical intuition to select field sizes/doses. They understood that these empiric guidelines were imprecise and did not fully reflect the underlying anatomy, physiology, and dosimetry.
4.1.2 Dose-Limiting Normal Tissues
With the widespread adoption of megavoltage radiation, there arose a need to better understand the tolerance of internal organs to radiation. The National Cancer Institute (NCI) mandated and sponsored research conferences to explore dose/time relationships to define “tumor lethal doses” and “normal tissue tolerance doses”. Figure 5 depicts a hypothetical dose–response curves for tumor control and normal tissue complication; ideally the therapeutic dose is chosen to maximize tumor control while minimizing toxicity risks, as graphically demonstrated by the “uncomplicated tumor control” curve.
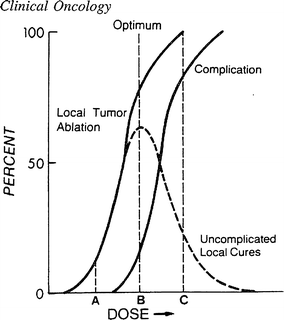

Fig. 5
The hypothetical dose–response curves for tumor control and normal tissue complication are shown, along with the associated curve for ‘Uncomplicated Tumor Control”, [From Rubin Clinical Oncology 8th edn. Treatment outcomes. Uncomplicated cures (dashed lines) are the desired result of treatment. This is illustrated as a function of the therapeutic ratio, i.e. the greater the separation between the tumor control (ablation) curve and the normal tissue complication curve, the greater the number of uncomplicated cures that will result. A, B, and C represent three different dose levels that if chosen, would lead to three diffrent outcomes. A would result in few tumor cures but no complications. C would lead to complicate cure in many cases, but virtually all patients would suffer complications. The optimal choice in this group of dose levels is B, which would result in the greatest number of cured patients without complications. (Adapted from Mendelsohn 1969 with permission)]
The biometric of normal tissue tolerance doses was initially described by Rubin and Casarett (Rubin and Casarett 1968, 1972) and remains a commonly used metric. The minimal tolerance doses, with respect to specified toxicity endpoints, were described by the TD5/5 (i.e., the dose which results in a 5 % severe complication rate within 5 years) and the TD50/5 (i.e., the dose that results in 50 % severe complication rate in 5 years). Radiation oncologists are often faced with the clinical dilemma whereby the optimum dose for tumor control exceeds the normal tissue dose tolerance of what are considered vital “dose limiting normal tissues”. With the impetus of defining therapeutic ratios in RTOG protocols, Rubin, Phillips, et al. defined tolerance doses into three categories: (Rubin and Casarett 1968, 1972).
4.1.3 Tolerance Volumes (Rubin et al.)
The concept of tolerance volume is defined in the same fashion as tolerance dose. The dose to a given volume or organ/tissue frequently proves to be more predictive of complication risks. It is possible to obliterate or lose a certain volume of a vital organ with suprathreshold doses, akin to surgical resection (i.e., stereotactic radiation surgery). Depending on the organ, loss of some volume may not affect organ survival because that organ can compensate for volume loss, up to a threshold volume, through regeneration or hypertrophy (i.e., liver) and/or remain, although impaired, within functional tolerance for survival (i.e., kidney or lung). Different organs demonstrate a range of tolerance volume (TV) parameters:
1.
TV5–25: 5–25 % of the organ volume irradiated above suprathreshold doses can result in a life-threatening or lethal complication.
2.
TV50–90: 50–90 % of the organ volume irradiated above suprathreshold doses can result in a life-threatening or lethal complication.
There are generally two levels of critical volume for dose-limiting vital organs. The gastrointestinal tract, proximal tracheal-bronchial airway, and central nervous system (CNS) can have disastrous outcomes after small volumes (TV 5–10 %) are exposed to doses exceeding TD5–50. However, it is important to note that necrotic bowel and necrotic CNS foci can occasionally be resected successfully. For the majority of organs considered dose-limiting, such as bone marrow, lung, kidney, heart, and liver, high doses can be tolerated to relatively small volumes. Such organs may decompensate when more than 50 % of the total volume (as applied to paired organs) is exceeded and threaten survival.
The time when organ decompensation begins clearly depends on the compensatory regenerative mechanisms that come into play when significant organ volume loss occurs. The dose–response curve is not an absolute or fixed effect but varies as a function of volume (Fig. 6a). This is an important concept because it describes why large doses can be delivered to partial volumes. For TD5 and TD50, the dose increases as the volume decreases.
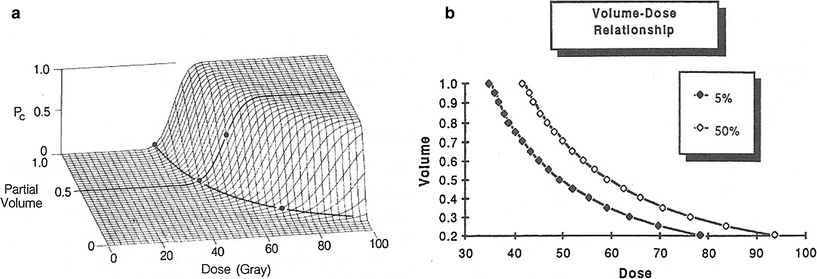

Fig. 6
Volume effect: (a) The dose response curve is not an absolute or fixed effect but varies as a function of volume. (b) For TD5 and TD50, the dose increases as the volume decreases. Note that the slope changes as more than 50 % of the whole organ is included. Small increments in dose, that is, 10–20 %, can prove to be lethal. From Rubin Clinical Oncology 8th edn. This important concept allows the radiation oncologist to give much larger doses to partial volumes. (From Lyman and Wolbrast 1987 with permission from Elsiever Science)
4.1.4 Tolerance Dose/Volume/Injury Concept (Lyman and Wolbarst)
An important and insightful concept was developed by Lyman, in which the dose response curve is not an absolute or fixed effect but varies as a function of organ volume. A 3D construct allowed for a method of assessing complication probabilities from dose volume histograms (Fig. 6a) this concept provided the radiation oncologist with a guide as to varying the dose depending on volume (Fig. 6b). This concept applied to organ tolerance doses, was then published by Emami, Lyman et al. (discussed below).
4.1.5 Tolerance Volume: Focal/Global Injury
Marks (1996) related the concepts of focal and global injury to clinical endpoints. The diagram linking these factors for the bladder (as an example) is shown in Fig. 7. For many organs, either, or both, focal and global injury are most clinically relevant (Table 2).
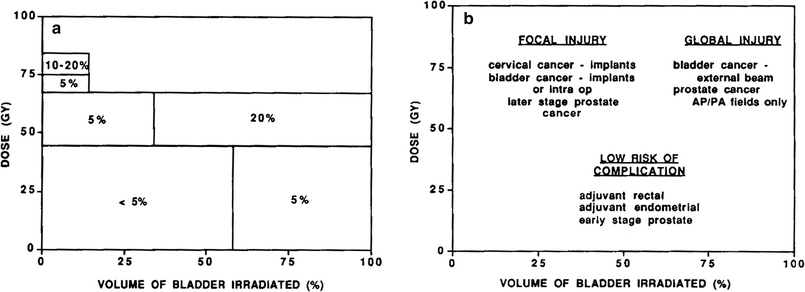

Fig. 7
A schematic diagram illustrating the dose-volume relationship to complications, using urinary bladder as an example. This is shown in two different ways in panels a and b. In panel a, the approximate overall serious complication rate is shown as a function of the dose delivered and volume exposed. The corresponding clinical situations are shown in panel b. Global bladder injury appears to occur when the total dose to the bladder exceeds 50–55 Gy. A focal bladder injury occurs when the dose to a portion of the bladder exceeds approximately 70–75 Gy, Marks (1995)
Table 2
Example clinically relevant focal and global endpoints for various organs
|
Organ
|
Focal endpoint
|
Global endpoint
|
|---|---|---|
|
Brain and cranial nerves
|
Focal weakness, blindness
|
Neurocognitive decline
|
|
Eye
|
Visual field cut
|
Acuity
|
|
Lung
|
Bronchial stricture
|
Dyspnea
|
|
Heart
|
Coronary stenosis
|
Pericarditis, reduced ejection fraction
|
|
Esophagus
|
Stricture, ulcer
|
|
|
Bladder
|
Bleeding
|
Reduced capacity, urinary frequency
|
|
Bowel
|
Stricture, bleeding
|
Malabsorption
|
|
Kidney
|
Reduced renal clearance
|
|
|
Liver
|
Reduced hepatic function
|
4.1.6 Emami and QUANTEC: Summary of Normal Tissue Dose/Volume (Emami, Lyman et al., and Marks et al.)
In the late 1980s and early 1990s, 3D planning systems were providing clinicians with a plethora of information. A great promise of 3D treatment planning was quantitative correlates of doses/volumes with clinical outcomes. This promise was partly delivered; guidelines were needed to help physicians predict the relative safety of proposed treatment plans, although only limited data were available. In 1991, to meet this need, investigators pooled their clinical experience, judgment, and information regarding whole organ partial organ tolerance doses, and produced the “Emami and Lyman paper” (Emami et al. 1991). This report was, and remains, a landmark summary of decades—worth of data for a wide variety of organs, supplemented with expert opinion where data were lacking. While this paper is often criticized, it clearly stated the uncertainties and limitations in its recommendations, and it is widely admired for addressing a clinical need.
During the decades of the 1990s and 2000s, numerous studies reported associations between dose/volume parameters and normal tissue outcomes. Much of this was reviewed by Milano et al. in 2007 (Milano et al. 2007, 2008). In 2007, a joint task force of physicists and physicians was formed, with the support of ASTRO and AAPM, to summarize the available data in a format useful to clinicians and to update/refine the estimates provided by Emami, Lyman. The resulting quantitative analysis of normal tissue effects in the clinic (QUANTEC) review articles (published in a special issue of the International Journal of Radiation Oncology, Biology, and Physics in March, 2010) summarized the available data. A central goal of QUANTEC was to update and refine the estimates provided by Emami, Lyman et al. and summarize published information in a clinically useful manner (Marks et al. 2010a, b). A summary table from the Quantec effort is shown in Table 3.
Stay updated, free articles. Join our Telegram channel

Full access? Get Clinical Tree


