20
DOSES AND RISKS IN NONRADIATION ONCOLOGY SUBSPECIALTIES
FRANK DONG, KEVIN WUNDERLE, AND SALIM BALIK
Question 1
What is the standardized computed tomography (CT) dose metric?
Question 1 What is the standardized computed tomography (CT) dose metric?
Answer 1
The CT dose index (CTDI) is the standardized CT dose metric that is recognized internationally by the International Electrotechnical Commission (IEC). CTDI is measured in 1 of 2 cylindrical phantoms made of polymethyl methacrylate (PMMA), also called acrylic; the attenuation properties of this material closely resemble those of soft tissue. One phantom (the body CTDI phantom) has a diameter of 32 cm, which represents an average human torso. The other phantom (the head CTDI phantom) has a diameter of 16 cm and represents an average adult head. The IEC 60601-2-44 standard recommends that the CTDI for an adult human torso be determined using the 32-cm body phantom and that the CTDI for a head (adult or pediatric) be determined using the 16-cm head phantom. Currently, the CTDI used for a pediatric torso varies, with some vendors using the 16-cm head phantom and others using the 32-cm body phantom. The recently revised IEC 60601-2-44 standard recommends using the 32-cm body phantom for both adult and pediatric bodies to avoid confusion.
IEC 60601-2-44:2009 Medical electrical equipment—Part 2–44: Particular requirements for the basic safety and essential performance of x-ray equipment for CT. February 2009.
McCollough C, Cody D, Edyvean S, et al. The Measurement, Reporting, and Management of Radiation Dose in CT. AAPM Report No. 96; January, 2008.
Question 2 How are computed tomography dose index (CTDI) and CTDIw measured?
Answer 2
CTDI is defined as the integrated absorbed dose along the z-axis of the CTDI phantom, normalized by the total beam collimation. The integrated radiation exposure is measured by a 100-mm pencil ion chamber and then converted to the absorbed dose to the phantom. The measured CTDI value is labeled as CTDI100, where “100” represents the length of the ion chamber in mm. CTDI100 is measured at both center and peripheral positions in the phantom; the ion chamber can be inserted into holes at those locations (the holes are usually plugged with pins made of the same acrylic material). The weighted average of the peripheral and central dose values (CTDIw) is calculated as:
![]()
Bauhs JA, Vrieze TJ, Primak AN, Bruesewitz MR, McCollough CH. CT dosimetry: comparison of measurement techniques and devices. Radiographics. 2008;28:245–253.
McCollough C, Cody D, Edyvean S, et al. The Measurement, Reporting, and Management of Radiation Dose in CT. AAPM Report No. 96; January, 2008.
McNitt-Gray M. AAPM/RSNA physics tutorial for residents: radiation dose in CT. Radiographics. 2002;22: 1541–1553.
Question 3
How is computed tomography dose index volume (CTDIvol) defined?
Question 3 How is computed tomography dose index volume (CTDIvol) defined?
Answer 3
CTDIw is the weighted average of the dose absorbed by the phantom during an axial scan without table movement. However, most clinical CT scans use helical mode, in which x-ray exposure is turned on as the patient table moves. To account for the table movement, a helical pitch factor (table movement per revolution/total beam collimation) is used to scale the CTDIw so that a volume-averaged CTDI (CTDIvol) can be calculated:
![]()
All commercial CT vendors are required to display CTDIvol as one of the radiation dose metrics for each scan (the other metric is dose-length product [DLP], discussed in Question 5) and must also save this information in a radiation dose structured report.
Bauhs J, Vrieze T, Primak A, et al. CT dosimetry: comparison of measurement techniques and devices. Radiographics. 2008;28:245–253.
McCollough C, Cody D, Edyvean S, et al. The Measurement, Reporting, and Management of Radiation Dose in CT. AAPM Report No. 96; January, 2008.
McNitt-Gray M. AAPM/RSNA physics tutorial for residents: radiation dose in CT. Radiographics. 2002;22: 1541–1553.
Question 5
What is dose-length product (DLP) and how can it be used to estimate effective dose?
Question 5 What is dose-length product (DLP) and how can it be used to estimate effective dose?
Answer 5
DLP is defined as the product of computed tomography dose index volume (CTDIvol) and scan length. DLP is proportional to the total energy deposited in a patient from a CT scan. In general, DLP values for multiple scans of the same body region can be added.
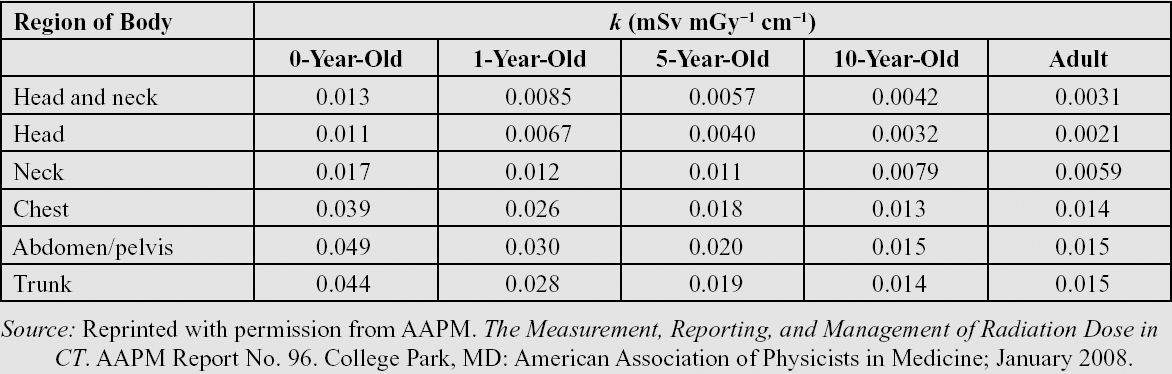
DLP from a CT examination can be used to estimate effective dose for the purpose of radiation risk assessment. To convert DLP to effective dose in mSv, a conversion factor (k-factor) can be used (see the following table). k-Factors are determined from Monte Carlo simulations and depend on the body region (organs irradiated) and patient age. For example, the k-factor for an adult head CT scan is 0.0021 mSv/(mGy*cm), whereas the k-factor for a newborn is 0.011 mSv/(mGy*cm), indicating that the newborn is more sensitive to radiation than is the adult patient.
Table of age-dependent conversion factor k for the effective dose from DLP
McCollough C, Cody D, Edyvean S, et al. The Measurement, Reporting, and Management of Radiation Dose in CT. AAPM Report No. 96; January, 2008.
McNitt-Gray M. AAPM/RSNA physics tutorial for residents: radiation dose in CT. Radiographics. 2002;22:1541–1553.
Question 7
Would the radiation risk from multiple computed tomography (CT) examinations be cumulative?
Question 7 Would the radiation risk from multiple computed tomography (CT) examinations be cumulative?
Answer 7
In general, the radiation risk from a CT examination follows a stochastic risk model if the examination is performed properly. In a stochastic model, the probability that an adverse event will occur (not the size of the event) is proportional to the insult (the amount of radiation dose) that the target receives.
All four major radiation protection agencies (International Commission on Radiological Protection [ICRP], National Council on Radiation Protection and Measurements [NCRP], Biological Effects of Ionizing Radiation [BEIR], and United Nations Scientific Committee on the Effects of Atomic Radiation [UNSCEAR]) support the linear no-threshold (LNT) risk model as a reasonable risk predictor for radiation protection purposes. The LNT risk model indicates that there is no threshold to radiation-induced risk: all radiation exposure is assumed to carry some risk for cancer, and thus there is no safe level of radiation in terms of carcinogenesis. The other assumption of the LNT model is that excessive cancer risk (above the natural occurrence rate of cancer, which is ~ 42% in the United States) is linearly proportional to the amount of radiation dose. When cancer risk prediction is based on the LNT stochastic model, each radiation event is independent, and only the probability of cancer occurrence is proportional to the radiation dose. With this model, the risk of cancer occurrence from the next CT examination is not increased or decreased based on the number of CT examinations performed previously. The decision to order another CT scan should therefore not be based on the number of previous CT examinations performed if CT is the best diagnostic tool for the patient.
Durand D, Dixon R, Morin R. Utilization strategies for cumulative dose estimates: a review and rational assessment. J Am Coll Radiol. 2012;9:480–485.
Question 9
What are the typical effective doses from a routine abdomen/pelvis scan and head scan?
Question 9 What are the typical effective doses from a routine abdomen/pelvis scan and head scan?
Answer 9
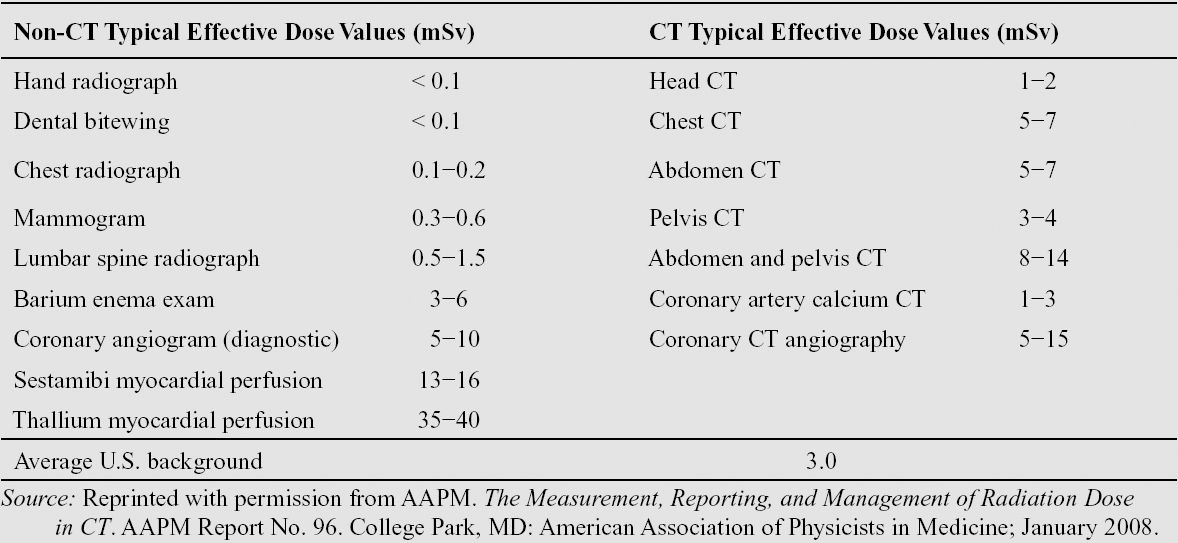
The effective dose from a routine abdomen/pelvis scan ranges from 7 mSv (abdomen) to 12 mSv (abdomen + pelvis). The effective dose from a routine head scan ranges from 1 mSv to 3 mSv. The following table reports effective doses from typical x-ray radiographic and computed tomography (CT) examinations:
Typical effective dose for several common imaging procedures
Mettler F, Huda W, Yoshizumi T, et al. Effective doses in radiology and diagnostic nuclear medicine. Radiology. 2008;248:254–263.
Question 11
How do new technologies help reduce the computed tomography (CT) radiation dose?
Question 11 How do new technologies help reduce the computed tomography (CT) radiation dose?
Answer 11
In the past, cardiac CT examinations were among the diagnostic studies with the highest radiation exposure because of the challenge posed by heart motion. With the advent of new technologies such as wider detector coverage, fast gantry rotation, and ECG-gated tube modulation, radiation dose from a typical coronary CT angiogram has been reduced to a few mSv as compared to previous doses of 20 to 30 mSv.
CT iterative reconstruction is a feature that uses the information acquired during the scan and repeated reconstruction steps to produce an image with less noise or better image quality (e.g., higher spatial resolution or decreased artifacts) than is achievable using filtered back projection, the standard image reconstruction technique. Iterative reconstruction can therefore help to maintain a clinically acceptable image quality at a reduced CT radiation dose to the patient. The degree of dose reduction is dependent on the diagnostic task. For example, the radiation dose required to image kidney stones is less than that required to detect a low-contrast liver lesion; therefore, aggressive dose reduction in conjunction with iterative reconstruction has been used for kidney stones, whereas only minimal dose reduction can be achieved for liver lesion detection even with a very aggressive iterative reconstruction algorithm.
McCollough C, Cody D, Edyvean S, et al. The Measurement, Reporting, and Management of Radiation Dose in CT. AAPM Report No. 96; January, 2008.
McNitt-Gray M. AAPM/RSNA physics tutorial for residents: radiation dose in CT. Radiographics. 2002;22: 1541–1553.
Question 13
During a head computed tomography (CT) scan, it is critical to reduce or minimize the dose to the eye lens. How well does the computed tomography dose index volume (CTDIvol) measured on a head CTDI phantom approximate the dose to the eye lens?
Related posts:

Stay updated, free articles. Join our Telegram channel

Full access? Get Clinical Tree


