Etiology, Prevalence, and Epidemiology
Pulmonary vasculitis is traditionally characterized by size of vessel involvement as defined by the Chapel Hill nomenclature. Within the small-vessel vasculitides, antineutrophil cytoplasmic antibody (ANCA)-associated vasculitis represents a diverse group of entities, and although the inciting stimulus has not been fully elucidated, an immune-mediated response is implicated.
Although rare, with an overall incidence of 20 to 100 cases per million and a prevalence of 150 to 450 cases per million, pulmonary vasculitis remains one of the most challenging diagnoses and management concerns in the care of critically ill patients. This in part is due to the nonspecific disease manifestations and diagnosis through a combination of clinical and imaging criteria.
Because of the tremendous overlap in clinical and laboratory manifestations among the systemic vasculitides and an absence of validated criteria for diagnosis, determining the exact vasculitis affecting the patient and initiation of the appropriate treatment can be difficult. A recent multinational observational study, endorsed by the American College of Rheumatology and the European League Against Rheumatism, the Diagnostic and Classification Criteria for Vasculitis study (DCVAS) was started, seeking to develop and validate diagnostic and classification criteria for the primary vasculitides.
Three entities are traditionally grouped within the small-vessel vasculitis class, specifically, antineutrophil cytoplasmic antibody (ANCA)-associated vasculitis: granulomatosis with polyangiitis (GPA, formerly Wegener granulomatosis), eosinophilic granulomatosis with polyangiitis (eGPA, formerly Churg-Strauss syndrome), and microscopic polyangiitis (MPA). Antineutrophil cytoplasmic antibodies activate neutrophils and monocytes that express the ANCA antigens myeloperoxidase (MPO) and proteinase 3 (PR3) on their surfaces. Cytoplasmic-pattern ANCA (c-ANCA) targets the MPO antigen, whereas perinuclear-pattern ANCA (p-ANCA) targets PR3.
Although each of these entities is associated with a positive ANCA, GPA is associated with c-ANCA reactivity, eGPA is usually associated with perinuclear p-ANCA activity, and MPA can have c-ANCA or p-ANCA positivity. GPA has an annual incidence of approximately 30 cases per million, whereas eGPA is the least common ANCA-associated vasculitis, with an annual incidence of approximately 2.4 cases per million. MPA has an annual incidence similar to GPA, with 10 to 30 cases per million, and represents the most common cause of pulmonary-renal syndrome.
Granulomatosis With Polyangiitis (Formerly Wegener Granulomatosis)
Clinical Presentation
Formerly referred to as Wegener granulomatosis, GPA may manifest as a systemic disease or involve primarily or exclusively the respiratory tract. This limited GPA is not a distinct process but instead exists along a continuum and often precedes systemic disease.
Most patients present with upper and lower respiratory symptoms, including epistaxis, sinusitis, cough, hemoptysis, dyspnea, and pleuritic chest pain. Systemic symptoms include fever, malaise, weight loss, and fatigue; with joint involvement taking the form of arthralgia or arthritis. Fifty percent to 80% of patients have glomerulonephritis.
Pathophysiology
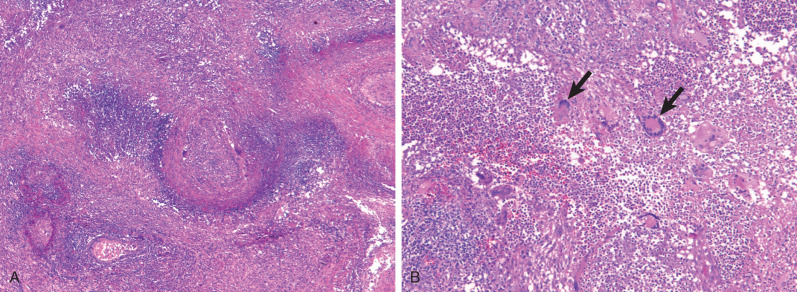
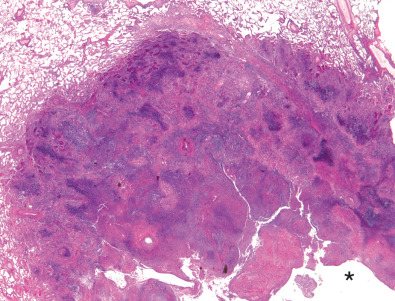
Characteristic histopathologic findings consist of granulomatous inflammation with vasculitis and parenchymal necrosis. A mixed cellular infiltrate of neutrophils, lymphocytes, plasma cells, histiocytes, and eosinophils tends to be aggregated in small microabscess-like clusters. As these clusters become necrotic, they enlarge, coalesce, and result in a characteristic appearance of geographic necrosis ( Figs. 46.1 and 46.2 ). Inflammation is typically parenchymal, although mucosal or submucosal granulomatous inflammation of the airways is also common. On occasion, patients may present with or develop capillaritis, which results in focal or diffuse hemorrhage that remains an important cause of morbidity and mortality in patients with GPA.
Manifestations of the Disease
Radiography and Computed Tomography
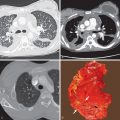
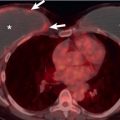
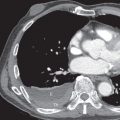
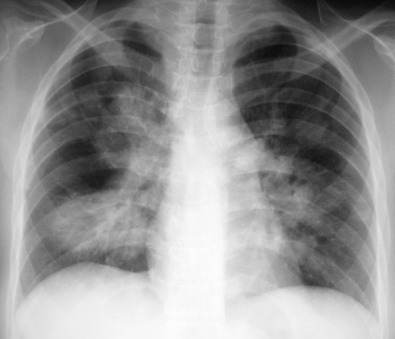
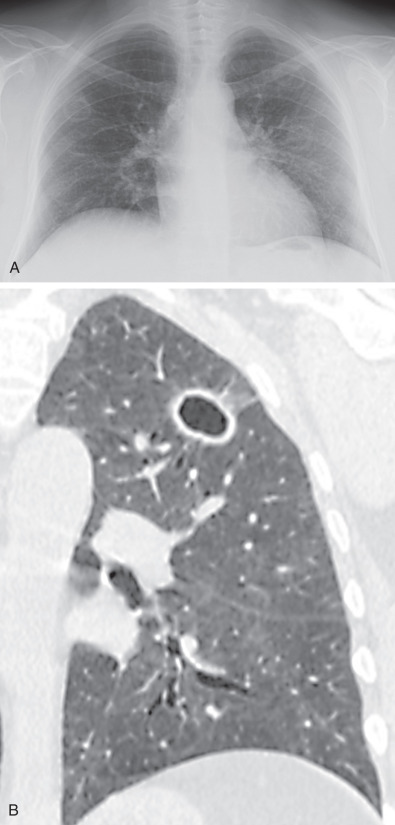
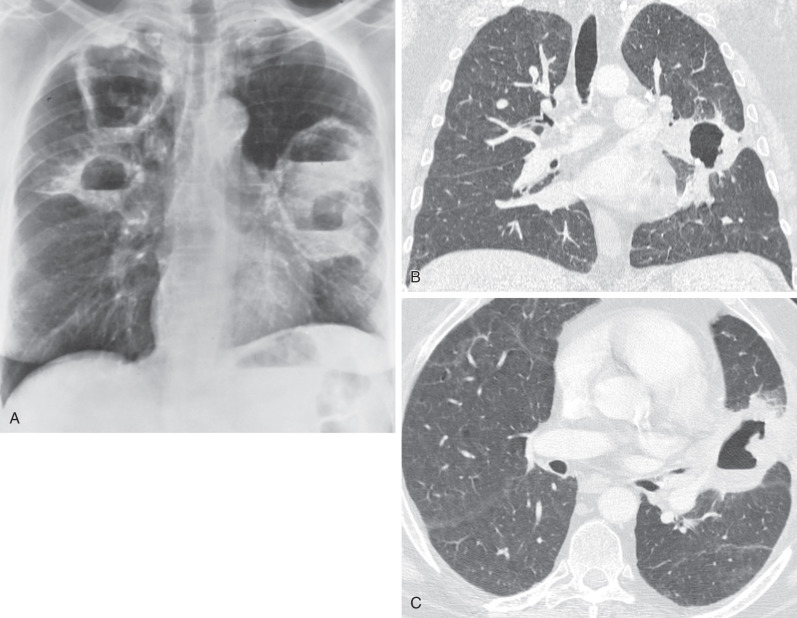
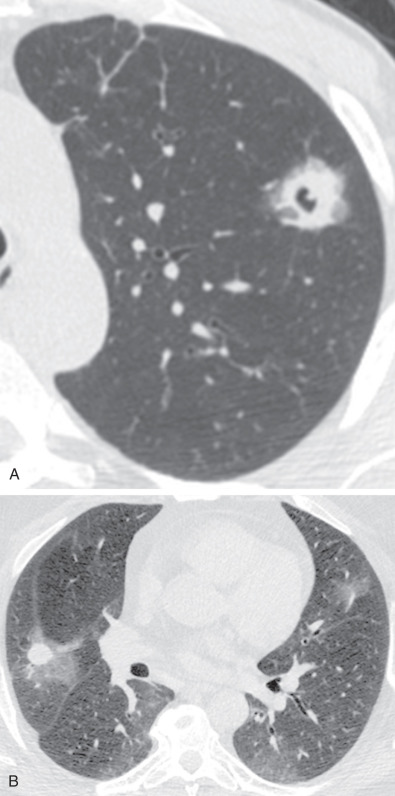
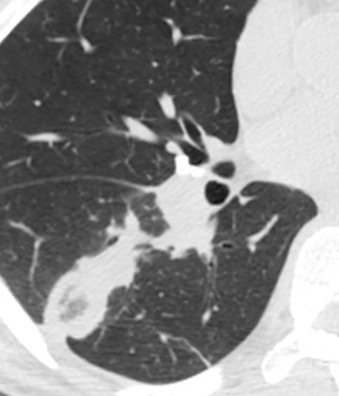
The most common radiographic abnormality consists of lung nodules or masses, seen in up to 90% of patients with GPA ( Fig. 46.3 ). The nodules and masses can range from a few millimeters to greater than 10 cm in diameter. The nodules tend to be bilateral and show no apicobasal gradient. An increase in size and number of nodules is associated with disease progression. Computed tomography (CT) often will show nodules that are not apparent on radiography and is more sensitive for the presence of cavitation, which is evident on CT scan in most nodules larger than 2 cm in diameter ( Fig. 46.4 ). When cavitation occurs, masses tend to be thick walled and have an irregular, shaggy inner lining ( Fig. 46.5 ). In up to 15% of cases, one or more of the nodules or masses are surrounded by a rim of ground-glass opacity representing the CT halo sign ( Fig. 46.6 ). Less commonly, areas of ground-glass opacity can be surrounded by consolidation in the so-called reversed halo sign, which likely represents an organizing pneumonia-like reaction ( Fig. 46.7 ).
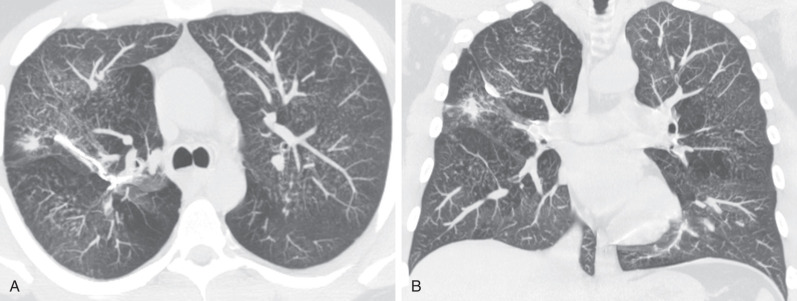
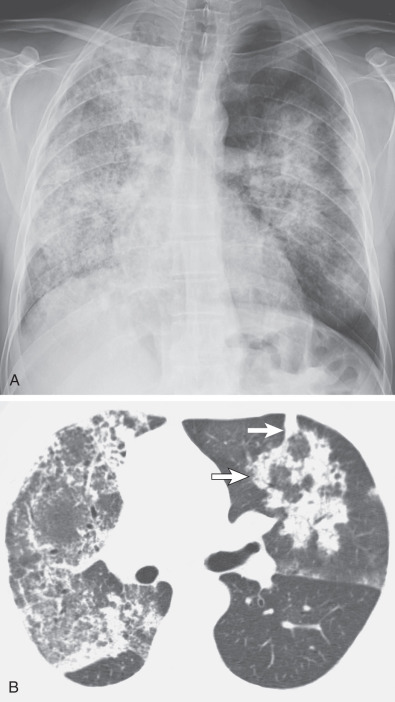
Areas of airspace consolidation, or less commonly ground-glass opacities, are seen in approximately 25% to 50% of patients ( Figs. 46.8 to 46.10 ). Foci of cavitation may occasionally be seen within the areas of consolidation. Diffuse consolidation or ground-glass opacities usually reflects the presence of pulmonary hemorrhage and can be seen in up to 10% of patients (see Fig. 46.9 ).
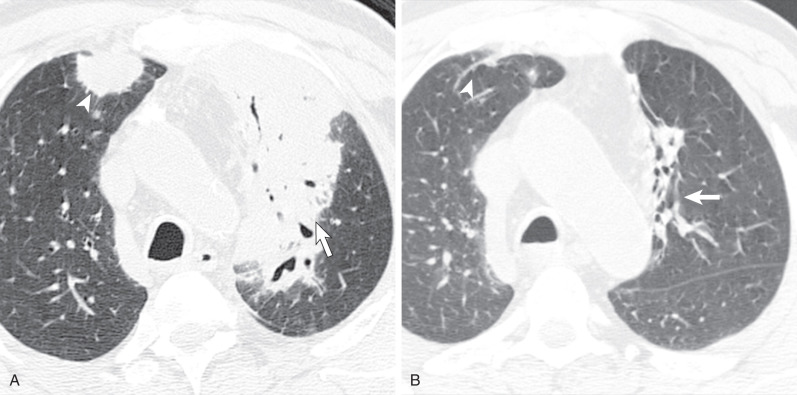
Other less common parenchymal abnormalities include centrilobular nodules, tree-in-bud opacities, septal lines, and foci of calcification within the nodules, masses, or areas of consolidation.
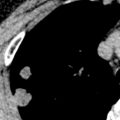
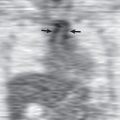
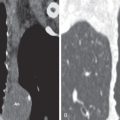
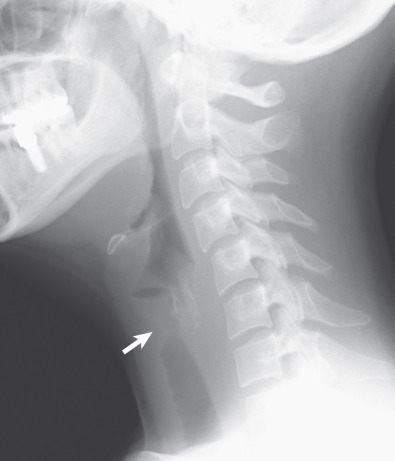
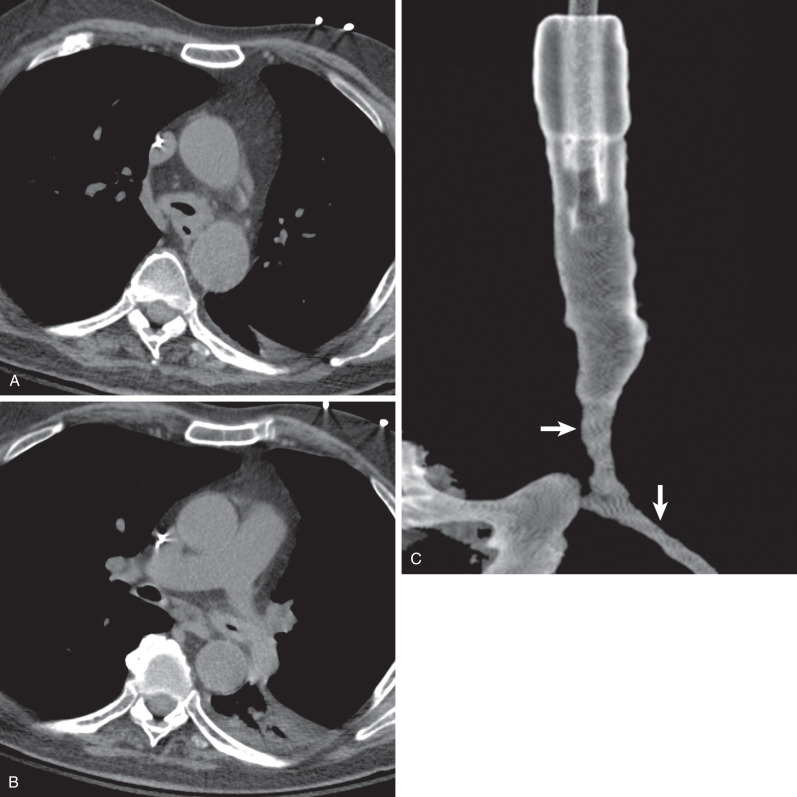
Tracheal and bronchial involvement is usually inferred on radiography by secondary signs of airway obstruction, such as atelectasis or air-trapping. When focal airway stenosis is visualized, it most commonly affects the subglottic trachea ( Fig. 46.11 ). With CT central bronchial wall thickening is seen in 50% to 60% of patients and tracheal wall thickening in 15% ( Fig. 46.12 ). Multiplanar reconstructions are essential for optimal imaging assessment of the presence and severity of airway stenosis (see Fig. 46.12 ).
Pleural effusions occur in 15% to 20% of patients and pleural thickening in 10%. Mediastinal lymph node enlargement is seen on CT in approximately 20% of cases and hilar lymph node enlargement in 3%.
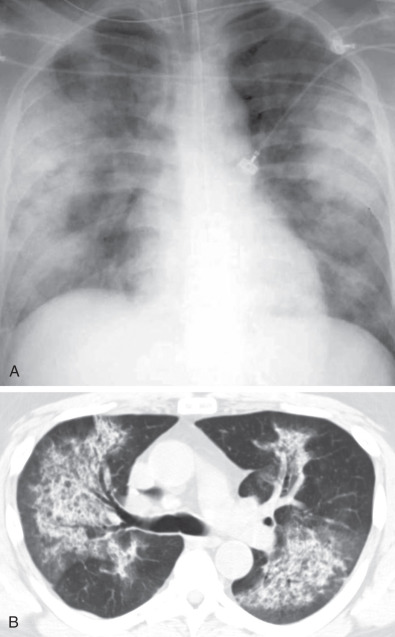
Approximately 50% of nodules and masses will resolve completely with disease treatment, and another 40% will decrease in size. However, intralobular linear opacities and areas of bronchiectasis tend to remain stable. This reinforces the theory that ground-glass opacities, consolidation, cavitated nodules, and masses represent active inflammatory lesions, whereas intralobular linear opacities and areas of bronchiectasis more often represent chronic fibrosis. Rarely, hemosiderin can accumulate in the alveoli from repeated hemorrhage, resulting in diffuse centrilobular nodules ( Fig. 46.13 ).