- •
Transthoracic echocardiography and CT-AVC are the current mainstream modalities for aortic stenosis evaluation, but PET imaging is emerging as a novel molecular imaging technique for assessing disease activity in the valves.
- •
18 F-Fluoride and 18 F-FDG PET can evaluate calcification activity and inflammation, respectively, in the leaflets of patients with aortic stenosis.
- •
18 F-fluoride PET, in particular, provides a powerful prediction of future disease progression and clinical events in aortic stenosis, although whether it provides incremental clinical value to CT-AVC scoring requires further research.
- •
18 F-Fluoride PET does, however, provide important insights into the pathophysiology underlying aortic stenosis, identifying calcification as the key process driving aortic stenosis progression and that elevated Lp(a) levels are associated with increased calcification activity and faster disease progression.
- •
18 F-Fluoride PET is currently being used as an efficacy end point in several ongoing randomized controlled trials testing novel therapies in aortic stenosis.
- •
18 F-Fluoride PET also detects calcification activity in bioprosthetic valves and acts as an early marker of valve degeneration and as a predictor of subsequent valve dysfunction.
- •
Microvascular dysfunction and impaired coronary perfusion play an important role in adverse LV remodeling in aortic stenosis and can be assessed using stress prefusion PET.
Introduction
Aortic stenosis is the most common valvular heart disease in the developed world with an incidence set to treble by 2050. The prevalence of aortic sclerosis in the general population is estimated to be 25% at the age of 65, increasing to almost 50% by the age of 80. The rate of progression to hemodynamically significant aortic stenosis is projected to be almost 2% per year, which translates to a relatively low prevalence (<1%) at age 60 and younger , but a rapid growth to greater than 10% for patients over the age of 75. The natural history is characterized by a long asymptomatic period, in which there is generally a good prognosis. By the time symptoms develop, mortality rates increase dramatically for patients who do not undergo valve replacement, up to 50% after 2 years.
Once thought merely to be related to age-associated wear and tear, aortic stenosis is now known to be an active process, displaying pathophysiologic similarities to atherosclerosis and bone formation. Initially, injury to the endothelium leads to lipid and inflammatory cell infiltration followed by the development of progressive valvular fibrosis and calcification. A progressive vicious cycle of increased mechanical stress, leaflet injury, and further calcification leads to progressive valve stiffening and stenosis, triggering a hypertrophic remodeling response in the myocardium.
Histopathologic studies have demonstrated that early valve lesions, or those in the initiation phase of the disease, are characterized by endothelial damage, lipid deposition, chronic inflammatory infiltrates, and microcalcification. Risk factors for the incidence of aortic stenosis are similar to atherosclerosis, and like atherosclerosis, the starting event is believed to be injury to the valvular endothelium because of mechanical stress or other risk factors, which permit infiltration of lipoproteins and recruitment of inflammatory cells. The importance of mechanical stress is best exemplified by individuals with bicuspid aortic valves (1% to 2% in the general population), in whom the altered valve structure results in abnormal hemodynamics and increased mechanical stresses. Patients with bicuspid aortic valves almost invariably develop aortic stenosis and, in general, require valve replacement one to two decades earlier than patients with tricuspid valves.
The initiation phase is followed by a propagation phase, during which valve interstitial cells (VICs) assume an osteoblast-like phenotype and drive a vicious cycle of valve fibrosis and calcification, the latter demonstrating similarities with skeletal bone formation. In contrast to the initiation phase, atherosclerotic risk factors do not predict disease progression. Rather, it is the burden of calcification that is the strongest independent predictor or disease progression. The Multi-Ethnic Study of Atherosclerosis (MESA), a longitudinal population study, used repeat computed tomography (CT) scans to quantify aortic valve calcium. It showed that the presence of valvular calcification at baseline was a strong and independent predictor of progression of aortic valve calcium, whereas traditional cardiovascular risk factors did not predict disease progression when adjusted for baseline calcium.
Computed tomography
Imaging of the valve is critical in determining the diagnosis of aortic stenosis, grading severity, and informing the timing of valvular intervention. Current guidelines focus on echocardiography, which remains the gold standard method for assessing patients with aortic stenosis. , Recently, however, multidetector computed tomography calcium scoring of the valve has emerged as an alternative assessment of aortic stenosis severity to complement echocardiography. CT aortic valve calcium (CT-AVC) scoring provides a quantitative and accurate measurement of the aortic valve calcium burden, with high intraobserver, interobserver, and scan-rescan reproducibility. , Sex-specific thresholds demonstrate high diagnostic accuracy for severe aortic stenosis and provide a powerful prediction of future disease progression and clinical events. , CT-AVC was included in the most recent European Society of Cardiology guidelines as an arbitrator of aortic stenosis severity in patients with discordant echocardiographic measurements. Contrast-enhanced computed angiography is now used as the standard in the work-up of patients who are being considered for transcutaneous aortic valve implantation (TAVR), providing accurate valve sizing, quantifying the proximity to the coronary arteries, and assessing the optimal access route. Semiquantitative assessment of the aortic valve calcium burden is feasible but not well validated.
Positron emission tomography
Combined with CT, recent advances in positron emission tomography (PET) now allow for the assessment of disease activity in the aortic valve. So far, the literature has focused on two tracers: 18 F-fluorodeoxyglucose ( 18 F-FDG) to measure valve inflammation and 18 F-fluoride for calcification activity, with both discussed in the following sections ( Fig. 28.1 ).

18 F-fluorodeoxyglucose positron emission tomography
18 F-FDG PET is widely used to image vascular inflammation. It is an inactive glucose analog that concentrates in metabolically active cells and is a well-established, sensitive, but nonspecific marker of vascular inflammation. This is based on the premise that macrophages have higher glucose requirements than other surrounding cells in the vasculature and histologic validation experiments performed in carotid atheroma.
Marincheva-Savcheva et al. first explored the role of FDG PET/CT in patients with aortic stenosis. In a retrospective observational study, 84 patients (42 with aortic stenosis and 42 age-matched control patients without aortic stenosis) were identified from a database of subjects who underwent PET/CT imaging between 2005 and 2010, primarily for evaluation of suspected cancer. Severity of aortic stenosis was established on echocardiography and patients were accordingly classified into three groups: those with mild, moderate, or severe aortic stenosis. Overall, the uptake, or the mean target-to-background ratio (TBR mean ), of FDG was increased in patients with aortic stenosis compared with matched controls: median 1.53 (interquartile range [IQR]: 1.42 to 1.76) versus 1.34 (IQR: 1.20 to 1.55); P < .001. On further assessment, FDG uptake was higher in patients with mild and moderate aortic stenosis than control subjects, but there was no difference in those with severe aortic stenosis. Similar trends were observed when subjects were grouped according to aortic valve calcification. This may reflect a survival bias with patients with severe aortic stenosis and the highest FDG uptake or calcium score progressing rapidly to aortic valve replacement (AVR) and therefore not being available for imaging. Additionally, in a subset of patients, it was observed that valvular FDG uptake was higher in patients who subsequently experience progression of aortic stenosis. Specifically, five of the six patients (83%) with high baseline valvular FDG PET uptake experienced subsequent progression of aortic stenosis, compared with two of nine patients (22%) with low TBR ( p = .04). Importantly, this was the first study to demonstrate that FDG uptake is increased in aortic stenosis, supporting the hypothesis that it is a metabolically active condition.
Abdelbaky et al. extended the findings of Marincheva-Savcheva et al. in a larger population before development of symptomatic disease. In a longitudinal study, they demonstrated that in patients without established aortic stenosis, a higher local aortic valve FDG signal is associated with an increased likelihood of subsequent valvular calcification. Given the association between inflammation and FDG uptake, these findings suggest that early valvular inflammation appears to play an important early role in the development of valve calcification. Given the nonspecific nature of FDG uptake, however, it may also represent other noninflammatory metabolically active disease processes.
Dweck et al. performed the largest study investigating FDG activity in patients with aortic stenosis. In a prospective study, 121 consecutive patients over the age of 50 years with aortic sclerosis and mild, moderate, or severe aortic stenosis had 18 F-fluoride and FDG scans of their aortic valve less than 1 month apart. 18 F-FDG showed a diffuse pattern of activity within the valve, which was frequently complicated by high signal in the surrounding myocardium so that quantification of uptake was restricted to the center of the leaflets. Nevertheless, compared with control subjects, FDG uptake was again increased in patients with both aortic sclerosis (TBR MAX : 1.30 ± 0.13 vs. 1.47 ± 0.15; p < .001) and aortic stenosis (TBR MAX : 1.30 ± 0.13 vs. 1.58 ± 0.21; p < .001). Overall, 20% of patients with aortic sclerosis and 35% of patients with aortic stenosis had increased uptake. Unlike in Marincheva-Savcheva et al., FDG uptake progressively increased with more severe aortic valve disease, again underlying the underlying metabolically active nature of the disease process.
18 F-Fluoride positron emission tomography
18 F-Fluoride has been used for over 50 years as a bone tracer and has recently emerged as a marker of vascular calcification activity in multiple different disease states. Fluoride ions exchange with hydroxyl ions in areas of exposed hydroxyapatite crystal (a key component of both bone and vascular calcification), with binding highest in areas of developing microcalcification because of surface area effects. In preferentially targeting developing microcalcification, 18 F-fluoride PET therefore acts as a marker of calcification activity and provides different information to the macroscopic deposits of calcium identified by CT.
In a study by Dweck et al., participants underwent 18 F-fluoride PET/CT. Compared with FDG, the 18 F-fluoride uptake in the valve was much stronger and more distinct with comparatively little activity observed in the surrounding structures. Compared with control subjects, valvular 18 F-fluoride uptake was higher in patients with both aortic sclerosis (TBR MAX : 1.55 ± 0.17 vs. 1.92 ± 0.31; p < .001) and aortic stenosis (TBR MAX : 1.55 ± 0.17 vs. 2.87 ± 0.82; p < .001). In total, 45% of patients with aortic sclerosis and 91% of those with aortic stenosis had increased uptake. The proportion of patients with increased activity rose sharply with increasing disease severity, such that 100% of patients with severe disease had increased uptake, and patients with moderate or severe aortic stenosis demonstrated far higher 18 F-fluoride activity than FDG. Interestingly, although 18 F-fluoride uptake was higher than FDG uptake in the valve, the reverse was true in areas of aortic atheroma, highlighting the importance of the pathologic differences between these two conditions. This also underlines the central importance of calcification in aortic stenosis, particularly in the latter stages of the disease, potentially explaining the disappointing results of statin therapy in treating this condition.
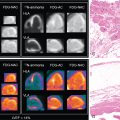
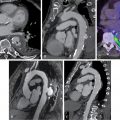
A subsequent follow-up study of this cohort demonstrated that both 18 F-fluoride and FDG predicted disease progression and adverse clinical outcomes in aortic stenosis. Disease progression was assessed at 1 and 2 years using CT-AVC and transthoracic echocardiogram. On repeat CT, new valvular macroscopic calcium was visible in a similar distribution to the 18 F-fluoride activity on the baseline PET imaging ( Fig. 28.2 ). Indeed, baseline 18 F-fluoride uptake correlated strongly with the subsequent rate of progression in the AVC score (Spearman r = 0.80; p < .001) and with echocardiographic measures of hemodynamic progression (mean gradient r = 0.32; p = .001). FDG showed similar but weaker correlations (r = 0.43; p < .001 and r = 0.26; p = .01, respectively). The study also looked at clinical outcomes. The primary clinical outcome end point was a composite of cardiovascular death and AVR. Average follow-up was 1232 days, at which point 23 patients (17%) had undergone AVR and 9 had a cardiovascular death. Both 18 F-fluoride and FDG were independent predictors of all-cause mortality and AVR (hazard ratio [HR] 1.46 [1.24 to 1.71]; p < .001 and HR 1.59 [1.21 to 2.09]; p = .002, respectively).

Left ventricular remodeling and the role of positron emission tomography imaging
Aortic stenosis progression is characterized by increasing left ventricular (LV) pressure afterload. This triggers a hypertrophic response that for many years normalizes wall stress and maintains cardiac performance. With time, however, this process decompensates. The hypertrophied myocardium outgrows its blood supply, leading to relative ischemia, myocyte cell death, and myocardial fibrosis. In combination, these processes lead to the transition from hypertrophy to heart failure and the development of symptoms and adverse events.
These processes can be investigated using novel imaging techniques, including PET/cardiac magnetic resonance (CMR) imaging, which combines the excellent temporal and spatial resolution of magnetic resonance imaging (MRI) with the sensitive molecular imaging of PET. Cine imaging exposes the LV remodeling and function, and late gadolinium enhancement (LGE) and T1 mapping provide tools for myocardial tissue characterization. Replacement midwall fibrosis identified by LGE is common in aortic stenosis (29% to 62%) , and is irreversible even after AVR. On the other hand, diffuse fibrosis is believed to be reversible, and it can be assessed using native T1 mapping and the extracellular volume fraction (ECV) . Recently, Chin et al. showed that ECV indexed to body surface area (iECV) correlates linearly (Pearson’s correlation, r = 0.87) with diffuse fibrosis and was increased in patients with aortic stenosis. It also provides good discrimination between the different stages of aortic stenosis, where increased iECV correlated with increased all-cause mortality.
Fibrosis quantification is a major strength of CMR imaging, but it only defines the presence of established fibrosis and cannot determine fibrosis activity or, indeed, disease activity. In the future, radiotracers targeting fibrosis activity, such as 68 Gallium (Ga)-fibrosis activating peptide inhibitor, will be crucial in determining myocardial disease and fibrosis activity. This will pave the way for the optimal PET/CMR assessment of myocardial fibrosis in aortic stenosis, defining both established and developing fibrosis activity.
The formation of fibrosis secondary to ischemia is a key potential pathophysiologic pathway and the assessment of myocardial perfusion can be linked with the detailed investigation of myocardial function and fibrosis. Steadman et al. measured myocardial perfusion reserve (MPR) and showed for the first time that MPR is independently associated with LV remodeling and the severity of aortic stenosis. More recently, Zhou et al. confirmed that myocardial flow reserve (MFR) impairment correlated directly with aortic stenosis severity using 82 rubidium (Rb) PET. They further showed that the presence of concentric and eccentric patterns of hypertrophy were associated with impaired MFR, as was global longitudinal strain, suggesting a possible association between subclinical myocardial ischemia and fibrosis. Nevertheless, definitive studies linking myocardial ischemia with myocardial fibrosis have yet to be undertaken and are keenly awaited.
Image optimization and current state of the art
A major challenge facing PET/CT of the heart is the impact of cardiac, respiratory, and gross patient movement on PET image quality. These obstacles have been the focus of image optimization studies and have led to the introduction of bespoke novel software-based solutions.
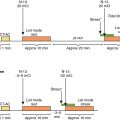
The original scans did not account for cardiac motion. Subsequently, approaches attempted to reduce cardiac motion by only using PET counts acquired during the end-diastolic phase when the heart is relatively still (counts acquired between 50% and 75% of the R-R interval). This reduced blurring from cardiac motion, but image noise was increased because three-quarters of the counts were effectively ignored. , Pawade et al. recruited 15 patients with aortic stenosis who then underwent repeat 18 F-fluoride PET/CT scans within a month. They compared the original nongated PET and noncontrast CT approach with a modified approach that incorporated contrast CT angiography and electrocardiogram (ECG)-gated PET. After that, they explored a range of image analysis techniques to assess which one was the most reproducible. First, they demonstrated that the new technique allowed much more accurate coregistration of the PET data with the contrast CT angiogram, based on matching the relatively high 18 F-fluoride signal in the blood pool with the relevant chambers seen on the CT. Second, they found that the novel approach allowed much more precise localization of the tracer activity in the valve leaflets, with 18 F-fluoride uptake localizing to areas of peak mechanical stress at sites where the leaflets were impacting each other and the aortic valve annulus ( Fig. 28.3 ). Finally, they demonstrated that the ECG-gated, contrast-enhanced PET/CT approach markedly improved the scan-rescan reproducibility of measuring 18 F-fluoride activity in the valve, particularly when a most diseased segment approach was employed. Indeed, the percentage error in estimating mean valvular 18 F-fluoride TBR levels was reduced to around 10%.

Valvular 18 F-fluoride PET imaging was further optimized by Doris et al. They used an alternative motion-correction approach that adjusted cardiac motion without excluding any PET data. A diffeomorphic, mass-preserving, anatomy-guided registration algorithm was used to align the PET images from four cardiac gates, preserving all counts, and applied to both PET/CT and PET/CMR data from six patients with aortic stenosis. Measured signal-to-noise ratios (SNRs) and TBRs were compared with the standard method of using only the diastolic gate. After motion correction, the SNR and TBR increased compared with both the diastolic gate (SNR 51.61 vs. 21.0; TBR 2.85 vs. 2.22) and nonmotion correction data (SNR 51.61 vs. 34.10; TBR 2.85 vs. 1.95, median, p = .028 for all). Furthermore, the median noise decreased from 0.105, using the traditional diastolic approach, down to 0.042 using the motion correction strategy ( p = 0.028 for difference).
Meanwhile, Massera et al. compared the reproducibility of the two main software programs used for reading 18 F-fluoride PET, OsiriX (OsiriX Imaging) and FusionQuant (Cedars-Sinai Medical), and showed comparable results with a high level of agreement. FusionQuant showed improved visualization, user interaction, registration, three-dimensional regions of interest, and cardiac motion correction capabilities; resulted in faster analysis time; decreased noise; and improved image quality. Furthermore, FusionQuant has shown excellent scan-rescan reproducibility for TBR mean and has also provided a marked improvement in the scan-rescan reproducibility of TBR MAX , allowing it to be used as an end point in clinical trials.
These advanced PET and contrast-enhanced CT techniques now allow for precise image coregistration, localization of 18 F-fluoride activity–specific regions of the valve leaflet, and highly reproducible tracer localization, paving the way for future research studies and potential clinical applications of this technique.
Applications of 18 F-Fluoride positron emission tomography
Improved pathologic understanding
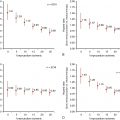
18 F-Fluoride PET/CT is a useful technique for improving our understanding of the pathophysiology underlying aortic stenosis. As discussed, early studies demonstrated that calcification is the predominant pathologic process driving aortic stenosis, particularly in the latter stages of the disease, and that it should be the target of future therapeutic interventions. More recently, Zheng et al. showed that PET/CT has a promising role in research studies that seek to explore the pathophysiology of aortic stenosis and in finding potential novel therapeutic targets. Combining data from the Scottish Aortic Stenosis and Lipid Lowering Trial, Impact on Regression (SALTIRE) study and the role of active valvular calcification and inflammation in patients with aortic stenosis study, they investigated the importance of lipoprotein (Lp)(a) in determining disease activity, disease progression, and clinical events in aortic stenosis. All 145 patients had samples available for Lp(a) and oxidized phospholipids on apolipoprotein B (apoB)-100 measurements. To investigate calcification activity in the aortic valve, 18 F-fluoride PET/CT was performed. Patients in the top Lp(a) tertile demonstrated increased aortic valve 18 F-fluoride PET activity compared with patients in the lower Lp(a) tertiles. This also translated into more rapid disease progression (assessed by both echocardiography and CT-AVC) and more clinical events in patients with the highest Lp(a) levels, indicating that Lp(a) may have a direct procalcific effect and may be implicated in the propagation phase of the disease. Moreover, it positioned Lp(a) as a potentially important therapeutic target in patients with aortic stenosis and elevated levels.
End point in clinical trials
The ability of 18 F-fluoride PET/CT to measure developing microcalcification and serve as a marker of disease activity in aortic stenosis, coupled with its excellent scan-rescan reproducibility, makes it attractive as a potential end point in clinical studies looking to determine the efficacy of novel therapies for this condition. In contrast to assessments of disease progression made with echocardiography and CT-AVC, which require several years to demonstrate a treatment effect, it is likely that changes in the 18 F-fluoride signal will be detectable within months. Indeed, this has been the case when 18 F-fluoride PET has been used to assess the effects of therapy on bone metabolism and FDG has been used to evaluate the effects of therapy on vascular inflammation. Indeed, this hypothesis is being evaluated in several ongoing clinical trials of novel therapies in aortic stenosis where 18 F-fluoride PET is being used as an exploratory end point ( Table 28.1 ). In a prospective trial, Hyo-Soo Kim et al. (NCT03051360) will recruit 140 patients with mild to moderate aortic stenosis and will randomize them to either PCSK9 inhibitors biweekly or a placebo. The primary end point will be progression of calcium score measured by cardiac CT and by 18 F-fluoride PET.
Related posts:
 Radiopharmaceuticals for clinical SPECT and PET and imaging protocols
 Imaging in patients with acute chest pain in the emergency department
 Key concepts in risk stratification and cost-effectiveness using nuclear scintigraphy in stable coronary artery disease
 Patient with known or suspected cardiac sarcoidosis
 Artificial intelligence in nuclear cardiology
 Large-vessel vasculitis
Stay updated, free articles. Join our Telegram channel

Full access? Get Clinical Tree


