Introduction
Disturbances of cardiac rhythm in the human fetus may come to clinical attention in a number of ways. First, an abnormally slow, fast, or irregular heart rate may be detected on fetal heart tone auscultation at routine prenatal visits. Second, fetal arrhythmia may manifest secondarily via its adverse hemodynamic effects; that is, nonimmune hydrops. Intrauterine fetal demise may also be the ultimate manifestation of fetal arrhythmia. Finally, arrhythmias detected in the early postnatal period are in fact continuations of previously unrecognized fetal arrhythmia.
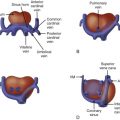
A brief discussion of “normal” fetal electrophysiology aids the understanding of fetal arrhythmias. While the primitive heart tube begins organized contractions (“beats”) by 12 days after conception, development of the fetal heart structure is not complete until 12 weeks’ gestation, and development of the conduction system becomes mature at 16 weeks’ gestation. The developmental biology involving the generation and propagation has been reviewed, with research concentrating on elucidating the specific mechanisms involved in differentiating specialized conduction tissues (i.e., those of the sinoatrial [SA] and atrioventricular [AV] nodes) from the primitive myocardium.
The fetal heart rate varies throughout gestation. During the first trimester, fetal heart rate ranges from approximately 110 to 180 bpm, with the maximum rate attained at about 9 weeks’ gestation. From this point onward in gestation, the average fetal heart rate falls to approximately 135 bpm near term, with an acceptable range of variability falling between 110 and 150 bpm.
The true incidence of fetal arrhythmia remains unknown because many arrhythmias are transient, are of negligible hemodynamic significance, and therefore remain undetected. Other arrhythmias impart such a poor hemodynamic outcome (e.g., ventricular fibrillation) or are associated with major congenital abnormalities (e.g., complete heart block) that intrauterine fetal demise results. It is generally accepted that 1% to 3% of pregnancies manifest some disturbance of cardiac rhythm, with approximately 10% of these being regarded as life-threatening. The remaining 90% are almost always transient, benign arrhythmia, typically as forms of atrial ectopy.
A large series of all fetal ultrasounds performed at a single center sheds some light on the proportion of fetuses with suspected arrhythmia ultimately diagnosed with a significant, potentially hemodynamically deleterious rhythm disturbance. In this study, 12.3% of all referrals for fetal echocardiography were for perceived irregularities of heart rhythm, yet only 1.6% of these referrals were found to have significant arrhythmia. Isolated premature atrial contractions (PACs) were not considered “significant” in this study.
The mainstay of diagnosis for fetal arrhythmia is the transabdominal fetal echocardiogram. The conceptual basis of diagnostic imaging of fetal arrhythmias is to visualize the mechanical or flow-related sequelae of electrical activity. This can be achieved through (1) careful visualization of the timing of motion of various portions of the myocardium through M-mode echocardiography or (2) the analysis of flow through various structures of the heart by Doppler echocardiography. M-mode or pulsed wave Doppler measurements taken via a sample volume encompassing both atrial and ventricular tissue allow for accurate assessment of cardiac rhythm. Alternate sites of sampling may be used, for example, the superior vena cava and ascending aorta and the pulmonary arteries and veins.
In addition, tissue Doppler imaging has been described in the diagnosis of fetal arrhythmias. The fetal electrocardiogram (ECG; electrodes placed on the mother’s abdomen to detect fetal cardiac electrical activity) is unreliable at determining arrhythmias with acceptable accuracy or precision, on account of low-signal voltages. A newer, more specialized technique known as magnetocardiography has been utilized to gain further insights into fetal arrhythmias. Fetal magnetocardiography creates an accurate representation of the fetal ECG, but it requires specialized equipment available at only a few referral centers.
This chapter is devoted to the definition, incidence, pathophysiology, and treatment of the most common fetal arrhythmias. These arrhythmias can be classified as follows: atrial and ventricular extrasystoles (PACs and premature ventricular contractions [PVCs]), supraventricular tachycardias (SVTs), ventricular tachycardias (VTs), and disturbances of AV conduction.
Premature Atrial and Premature Ventricular Contractions
As in children and adults, PACs and PVCs can be seen in the fetus. Such contractions will be followed by compensatory pauses in the ventricular rate. As a rule, PACs are much more common (~10 times more so) than PVCs. An early study using echocardiography revealed an incidence of PACs and PVCs of 1.7% in all fetuses screened late in the third trimester. In general, PACs are benign and, in isolation, are not associated with underlying disease. However, frequent PACs may herald the development of sustained tachyarrhythmia. In addition, PACs are associated with structural congenital heart defects in between 1% and 10% of cases, depending on the study reviewed ; therefore, fetuses with PACs detected in utero may benefit from a complete echocardiographic assessment to rule out structural congenital heart disease (CHD). PACs commonly present in the late third trimester of pregnancy, and upon fetal echocardiographic imaging, a floppy, aneurysmal and redundant atrial septum is often seen bouncing along the posterior atrial wall.
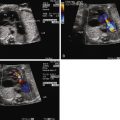
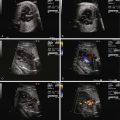
PACs may appear in a bigeminal pattern (i.e., every other beat is a PAC) ( Figure 45-1 ). In this setting, the index of suspicion for anticipation of SVT should be higher and the fetus monitored more closely than if there are only isolated beats. PACs may also be blocked, in that the premature atrial depolarization reaches the AV node while it is still refractory ( Figure 45-2 ). In this scenario, the resulting ventricular rate may be quite slow, on the order of 70 to 80 bpm ( Figure 45-3 ). It is of paramount importance for diagnostic and therapeutic considerations to distinguish this entity from complete heart block.


PVCs similarly have a benign outcome in the fetus in the majority of cases. There is no association between PVCs and SVT. However, a full echocardiographic assessment is warranted to rule out structural and functional abnormalities because inflammatory processes such as myocarditis and intracardiac tumors may be associated with PVCs.
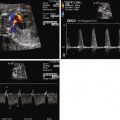
PVCs are identified when there are premature beats that occur early and originate in the ventricles ( Figure 45-4 ). Whereas PACs originate from the atria and will “reset” the sinus node so that there is a pause in atrial activity after an early beat, PVCs are generally not conducted back to the atria and, hence, do not “reset” the sinus node. Sinus rhythm and atrial activity will continue in a regular manner, undisturbed in the presence of PVCs. Regularity of atrial activity with no disturbance in the cadence of the atrial beats is an important marker for distinguishing a premature contraction as being of ventricular, and not atrial, origin. Another way of looking at this is that in a PVC, because atrial activity and sinus node firing is not affected, the time interval between two sinus beats and the time interval between two beats that include the PVC will be identical. The sinus node continues to fire at the same cadence, despite the occurrence of a PVC ( Figure 45-5 ). Because a PVC will occur without atrial activity, it will result in the ejection of blood without the benefit of having augmented filling through atrial contraction. Hence the stroke volume, or volume of blood ejected with a PVC, will be less than normal. This can be seen as an early beat with a lower peak velocity and smaller velocity-time integral relative to the prior sinus beats. Following the PVC, there is increased time for ventricular filling so the beat subsequent to a PVC may have augmented flow and will have an increased peak velocity and higher velocity-time integral relative to sinus beats ( Figure 45-6 ).


Fetal Tachyarrhythmias
Supraventricular Tachycardia
SVT is the most common fetal arrhythmia having the potential for deleterious effects on fetal well-being. SVT is a nonspecific term that encompasses several arrhythmias originating above the AV node, all having different mechanisms of initiation and propagation. The prevalence of SVT in fetuses with tachycardia ranges from 66% to 90%. In utero SVT has been associated with poor neonatal outcomes in a number of studies. Nonimmune hydrops is associated with SVT in 40% to 50% of cases ; furthermore, the response to therapy and mortality are markedly worse in hydropic fetuses. The mechanism of hydrops in fetuses with SVT is complex, but likely relates to decreased diastolic filling time in the setting of the innately decreased ventricular compliance of the fetus during diastole relative to the adult. The adverse hemodynamics conferred by in utero tachycardia results in increased atrial and ventricular filling pressures. Such increased pressures are transmitted back through the venous system, which in turn elevates transudative forces, leading to cell and tissue edema.
In the fetus, SVT is largely (i.e., >90%) due to an orthidromic reciprocating tachycardia, in which an accessory pathway distinct from the AV node and bundle of His allows for electrical activation of the ventricle separately from typical nodal conduction. Histopathology examination has shown parietal subendocardial accessory pathway fibers mostly composed of ordinary myocardium traversing through defects in the AV annulus fibrosus. In most cases of fetal SVT, a reentrant circuit utilizing antegrade conduction (orthidromic) through the AV node–bundle of His and retrograde conduction through the accessory pathway mediates the tachycardia. This is referred to as atrioventricular reciprocating tachycardia (AVRT). The inciting events for AVRT are variable but typically involve appropriately timed PACs that allow for initiation and propagation of the reentrant circuit. A study using fetal magnetocardiography was able to precisely elucidate the mechanisms of AVRT initiation and termination in a series of fetuses with SVT. A retrospective review of 23 fetuses at a single center with SVT used M-mode echocardiography to determine the ventriculoatrial (VA) time interval, via which the mechanism of SVT could be elucidated. In 83% of the fetuses, the tachycardia was of the short VA type, thereby confirming an orthidromic AVRT.
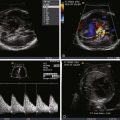
A defining feature of AVRT is the 1 : 1 relationship between atrial and ventricular impulses ( Figure 45-7 ); this distinguishes it from atrial flutter and atrial fibrillation, which are discussed later in this chapter. The ventricular rate in fetal AVRT is typically approximately 250 bpm, with this rate being relatively constant for each particular patient; that is, there is very little variability in the ventricular rate. Consistent with AVRT being a reentrant arrhythmia, the onset and termination of the arrhythmia are abrupt.

Atrial Flutter
Atrial flutter, as in the child and adult, can be differentiated from other types of SVT on the basis of a lack of 1 : 1 AV conduction and a variable ventricular rate ( Figure 45-8 ). Rarely, 1 : 1 AV conduction may occur, in which case differentiation from AVRT becomes difficult. Typically, the ventricular rate will be slower than the atrial rate due to variable degrees of AV block. Experimental observations and the fact that atrial flutter occurs mainly during the third trimester support the hypothesis of atrial macro-reentry as the underlying mechanism of fetal atrial flutter. The atrium probably reaches a critical size for establishing an intra-atrial macro-reentry circuit at approximately 27 to 30 weeks of gestation. Atrial flutter represents approximately 10% to 30% of all cases of fetal tachycardia. A review of all published studies from 1990 onward comparing fetal AVRT and atrial flutter revealed several key distinguishing points: atrial flutter presents later in gestation, atrial flutter and AVRT have similar rates of hydrops and mortality; and there may be a slightly higher association of atrial flutter with structural heart disease than with SVT. In some fetuses with atrial flutter, the presence of an accessory AV pathway has been demonstrated by postnatal transesophageal electrophysiological studies in the neonatal period. The treatment for in utero atrial flutter is to a degree similar to AVRT and is described later.

Management of Fetal Atrial Tachyarrhythmias
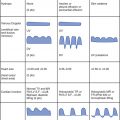
Clear, established guidelines for treating fetal SVT are lacking owing to the absence of large, randomized, controlled trials. In the absence of such trials, treatment is guided based on small case series, expert opinion, and institutional practice. Our approach to management starts with a diagnostic judgment of fetal hemodynamic status. At initial presentation, a comprehensive assessment of fetal well-being is indicated. Hydrops fetalis is an end-stage finding secondary to the sequelae of poor heart function, elevated venous pressure, and low cardiac output; its presence is related to poor outcome. In the past, hydrops has been used as the marker of severity and fetal impact; however, this is a very late event along a physiological spectrum of severity. Currently, a number of other measures can anticipate the onset of unwellness and instability prior to the onset of hydrops. These measures can be used to help decide upon initiation of therapy and monitor for response to therapy ( Table 45-1 ). First, at initial presentation, it is important to determine whether the tachycardia is sustained (present for >50% of the time of observation) or nonsustained (present for <50%). Most nonsustained tachycardias and some sustained tachycardias can be monitored without intervention, so long as other measures of fetal wellness are present. The parameters of evaluation include cardiothoracic ratio, assessment of ventricular systolic function, presence or absence of tricuspid or mitral regurgitation, presence or absence of reversal of flow in the ductus venosus, presence or absence of umbilical venous pulsations, and the presence or absence of pericardial effusion. A comparative assessment of umbilical arterial flow and middle cerebral artery flow provides for an indirect measure of cardiac output and perfusion. The ratio of vascular impedance as measured by the ratio of the pulsatility index (PI) between the placental circulation and the cerebrovascular circulation provides tremendous insight into the adequacy of perfusion. A middle cerebral artery PI that is lower than the umbilical artery PI suggests cerebrovascular vasodilation in an attempt to increase cerebral blood flow and reflects low cardiac output. Conversely, a high (normal) middle cerebral artery PI in comparison with the umbilical PI suggests adequate cardiac output ( Figure 45-9 ). Serial imaging and close follow-up with evaluation of each of these parameters is essential at each assessment interval and provides for an overall picture of the hemodynamic status of the fetus with tachyarrhythmia.
Related posts:
Stay updated, free articles. Join our Telegram channel

Full access? Get Clinical Tree


