Overview of artifacts in liver shear wave elastography
The use of shear wave elastography techniques proves valuable in providing qualitative and quantitative elasticity maps of the liver. There are, however, common disturbances that can affect the tissue measurements of stiffness. Image artifacts, signals that appear present on the image but are not present in the body, can result in overestimation, underestimation, and highly variable calculations of tissue stiffness maps. Several artifacts can influence stiffness measurements for most techniques, most notably ultrasound-based techniques. These include:
- ■
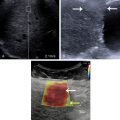
Poor acoustic windows that result in both limited push and tracking penetration and cause high variability in elasticity measurement and rib or lung shadowing, which produce further instabilities in elasticity values. Poor signal-to-noise ratio in the shear wave data or the resultant shear wave speed reconstructions is commonly reported on commercial systems through quality metrics and images.
- ■
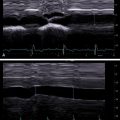
Cardiac pulsatility artifacts that result from both the creation of natural shear waves from a high heart rate and the presence of pulsating vessels near the region of interest.
- ■
Liver boundary, or Glisson capsule, artifacts due to interactions with portal vessels and the distortion of shear wave motion around the liver capsule.
- ■
Tissue viscosity that causes both vibration-frequency dependent shear wave speeds, especially when comparing measurements between modalities, and overestimation bias due to reconstruction assumptions of pure elasticity.
- ■
Tissue nonlinearity such that stiffness changes nonlinearly with strain due to extracellular matrix heterogeneity and is underestimated when calculated with linear assumptions.
- ■
Motion artifacts due to patient motion and natural motion from breathing.
- ■
Shear wave reflection artifacts due to stiffness gradients within the liver.
- ■
Nonperpendicular probe placement that results in nonlinear signal decay and liver stiffness overestimation.
- ■
Compression with the probe/nonlinear tissue response.
Vibration controlled transient elastography
Vibration controlled transient elastography (VCTE) relies upon external, mechanical vibration to induce shear waves within tissue. The shear waves are tracked via Doppler-like ultrasound techniques from which Young’s modulus can be calculated, assuming homogenous, isotropic, and elastic behavior. There are, however, limitations with VCTE and difficulties in interpretation. For example, without controlled probe compression force, the excitation can distort and decrease in center-frequency, resulting in lower stiffness measurements. Excessive compression can also lead to nonlinear stiffening of the compressed tissues. Similarly, without proper damping of the mechanical vibration, duplicate shear waves may be induced, and regression algorithms may misrepresent actual tissue elasticity. These artifacts that were observed with the first version of the FibroScan are less evident in the subsequent versions by controlling the vibration.
Acoustic radiation force impulse techniques artifacts
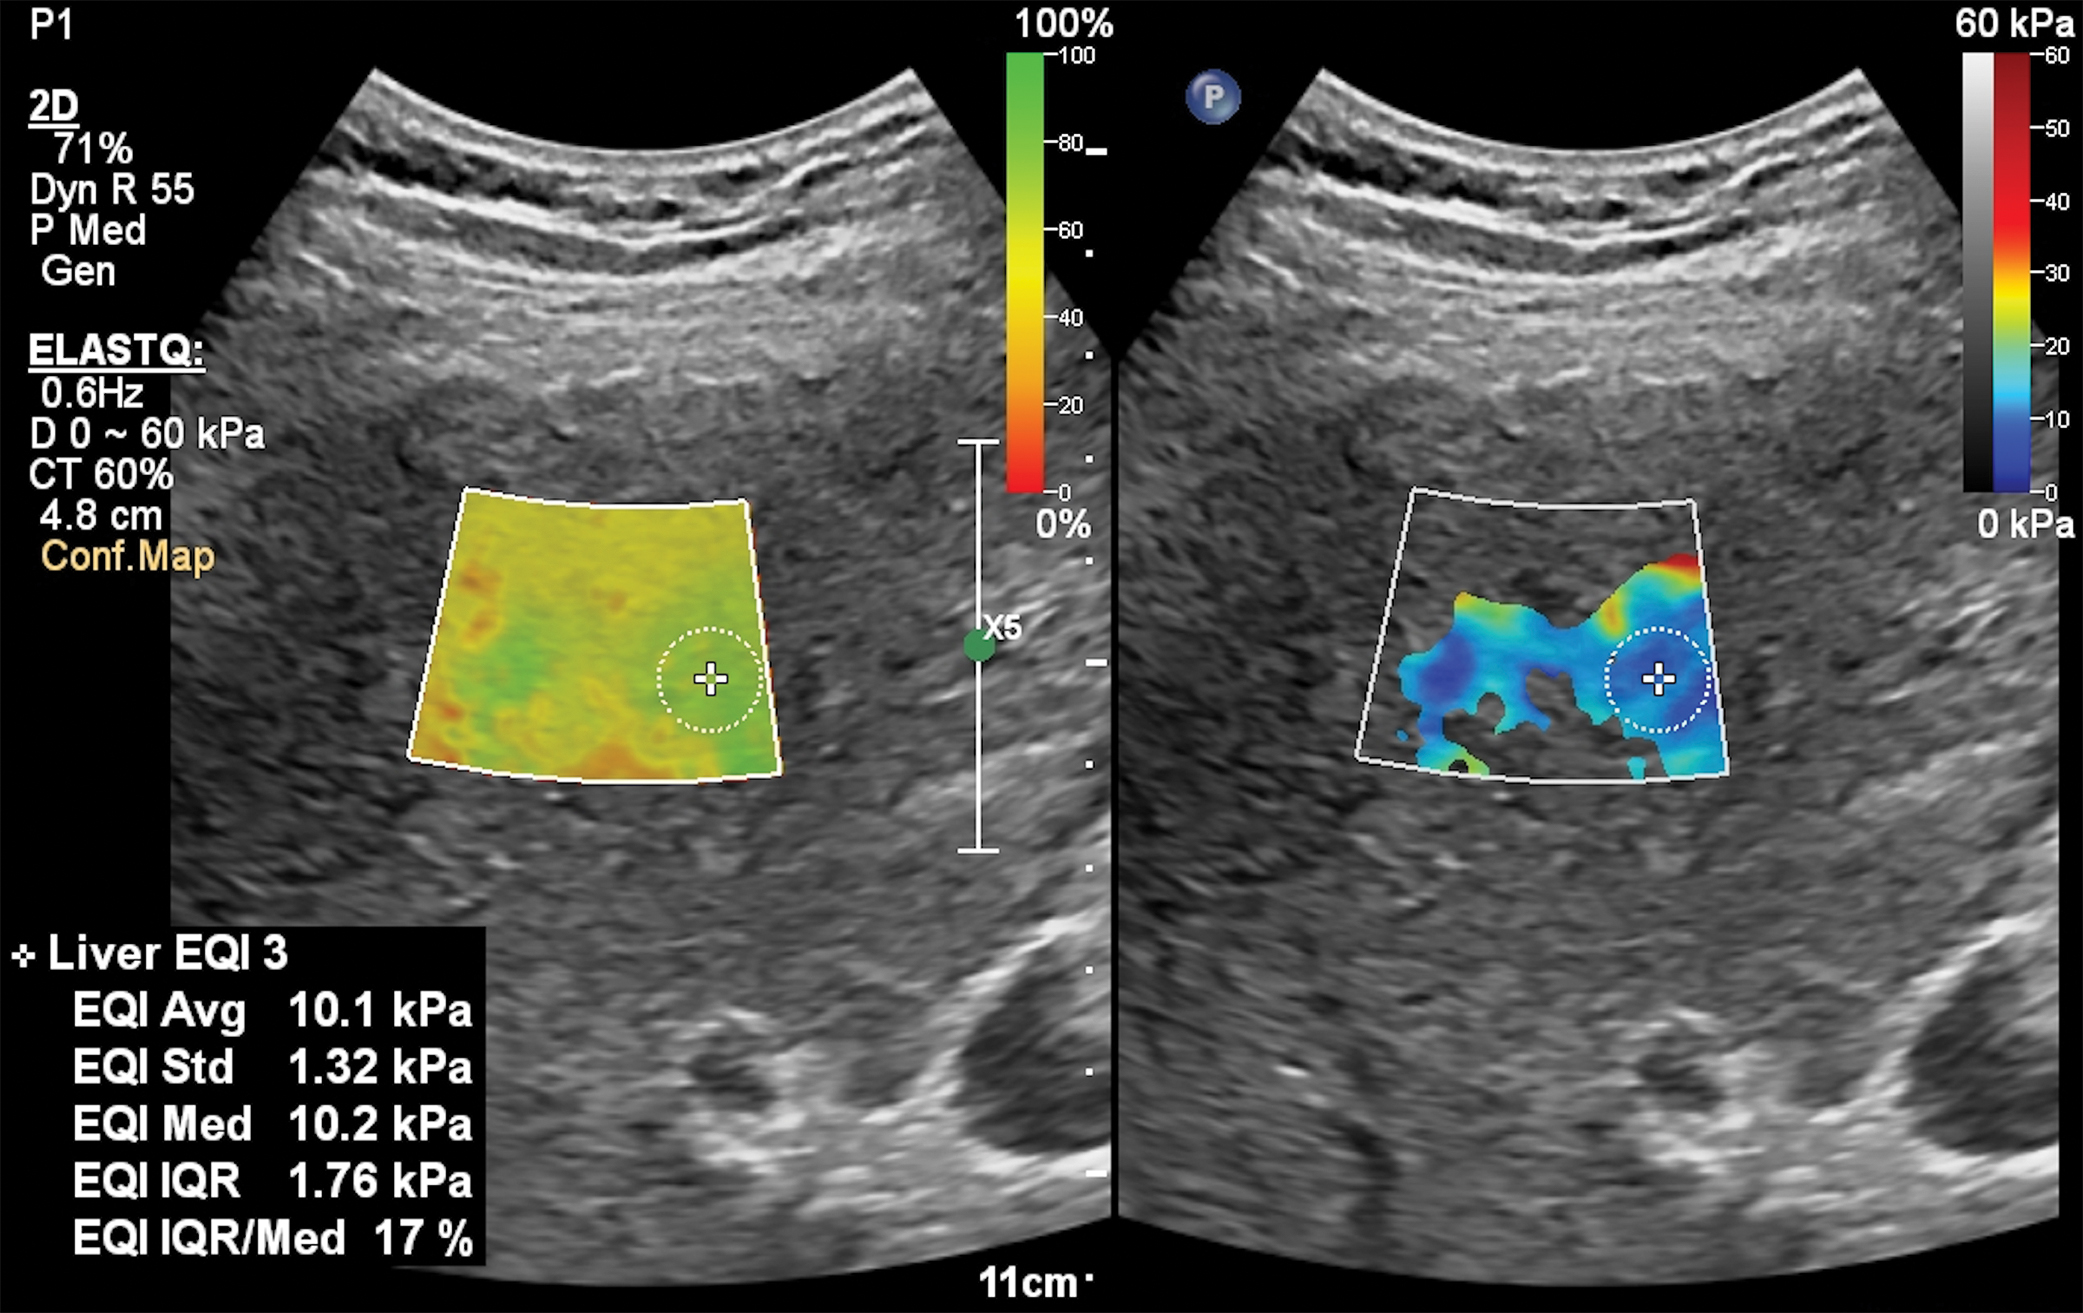
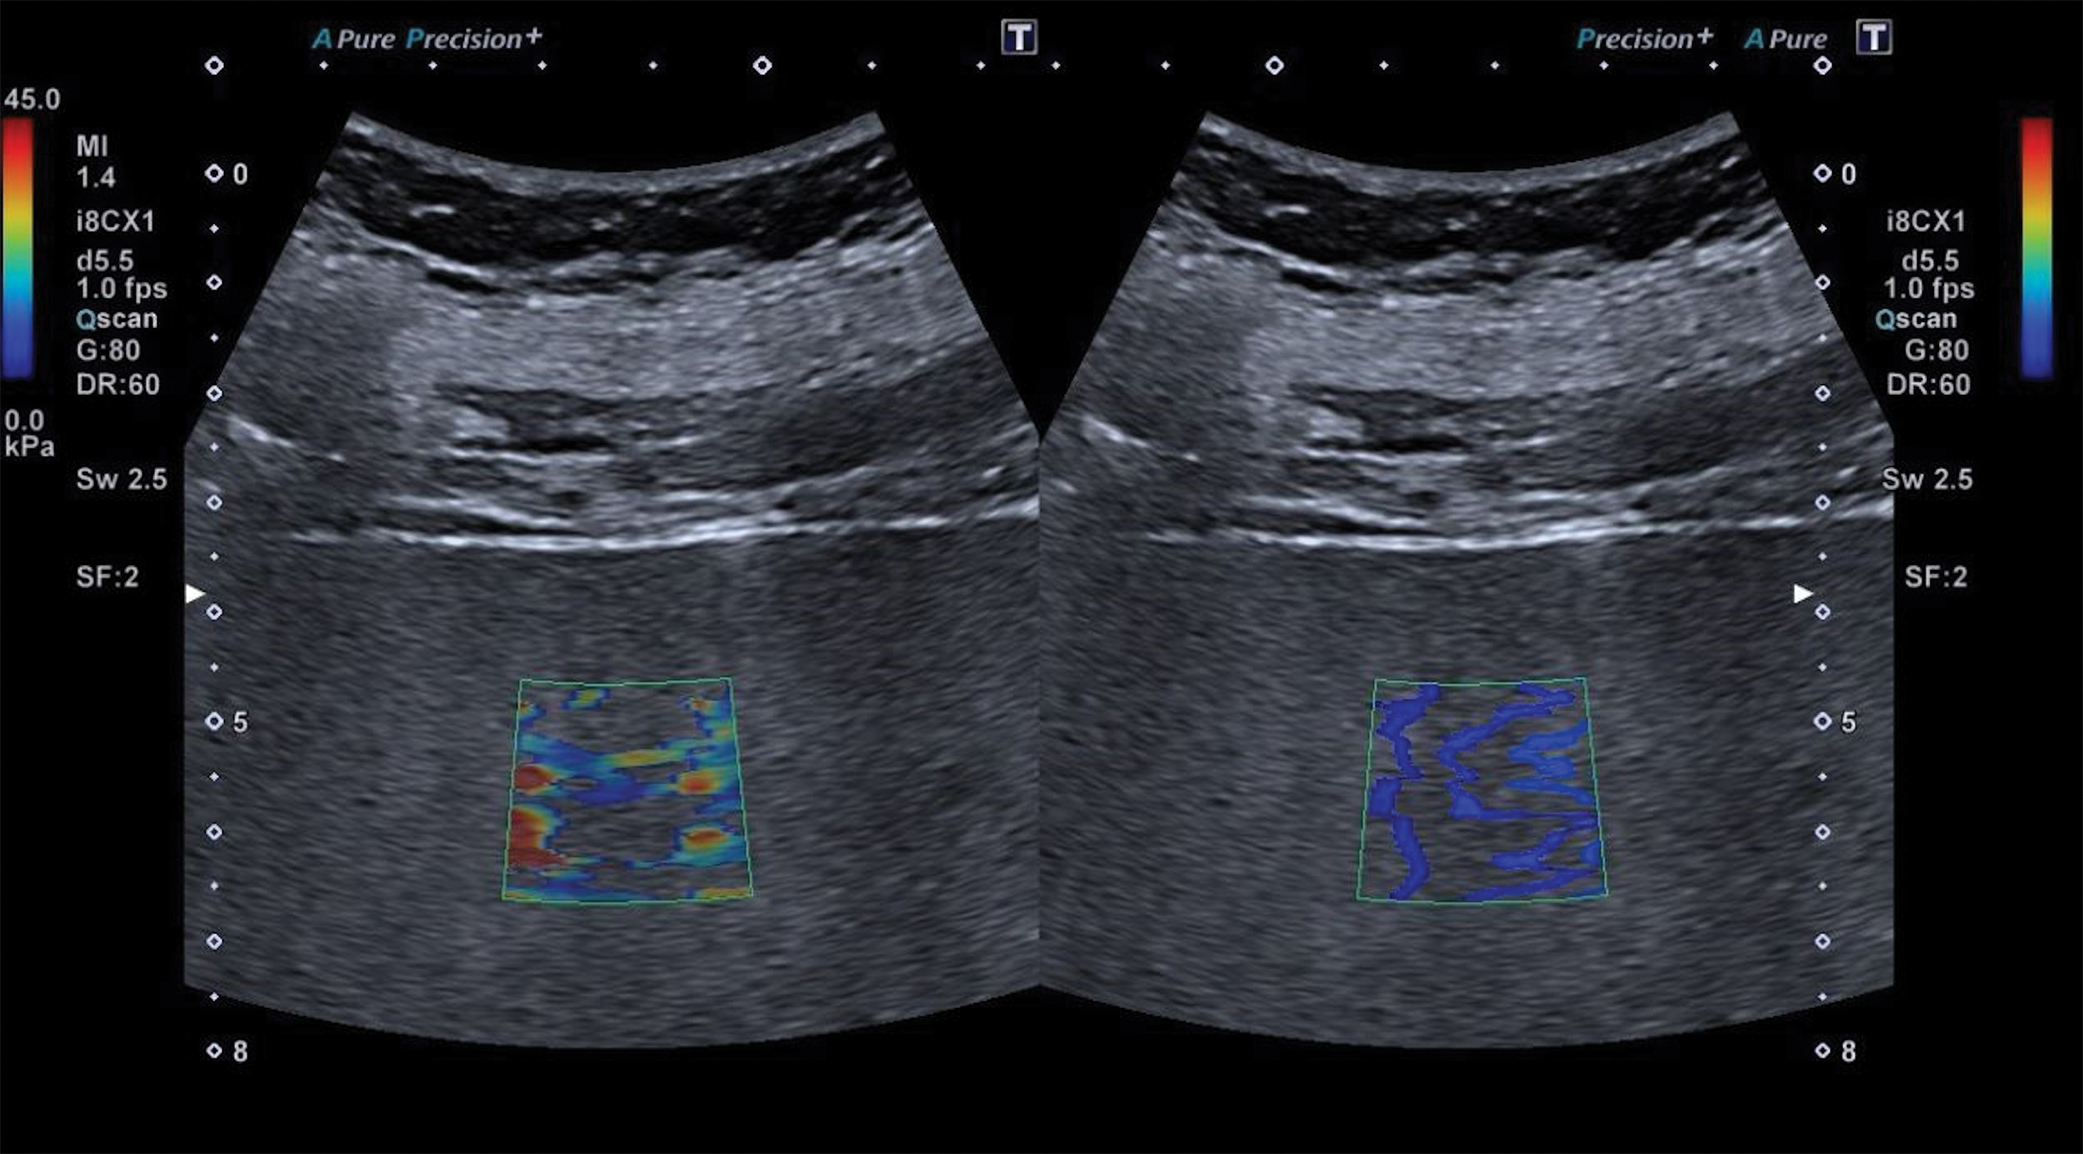
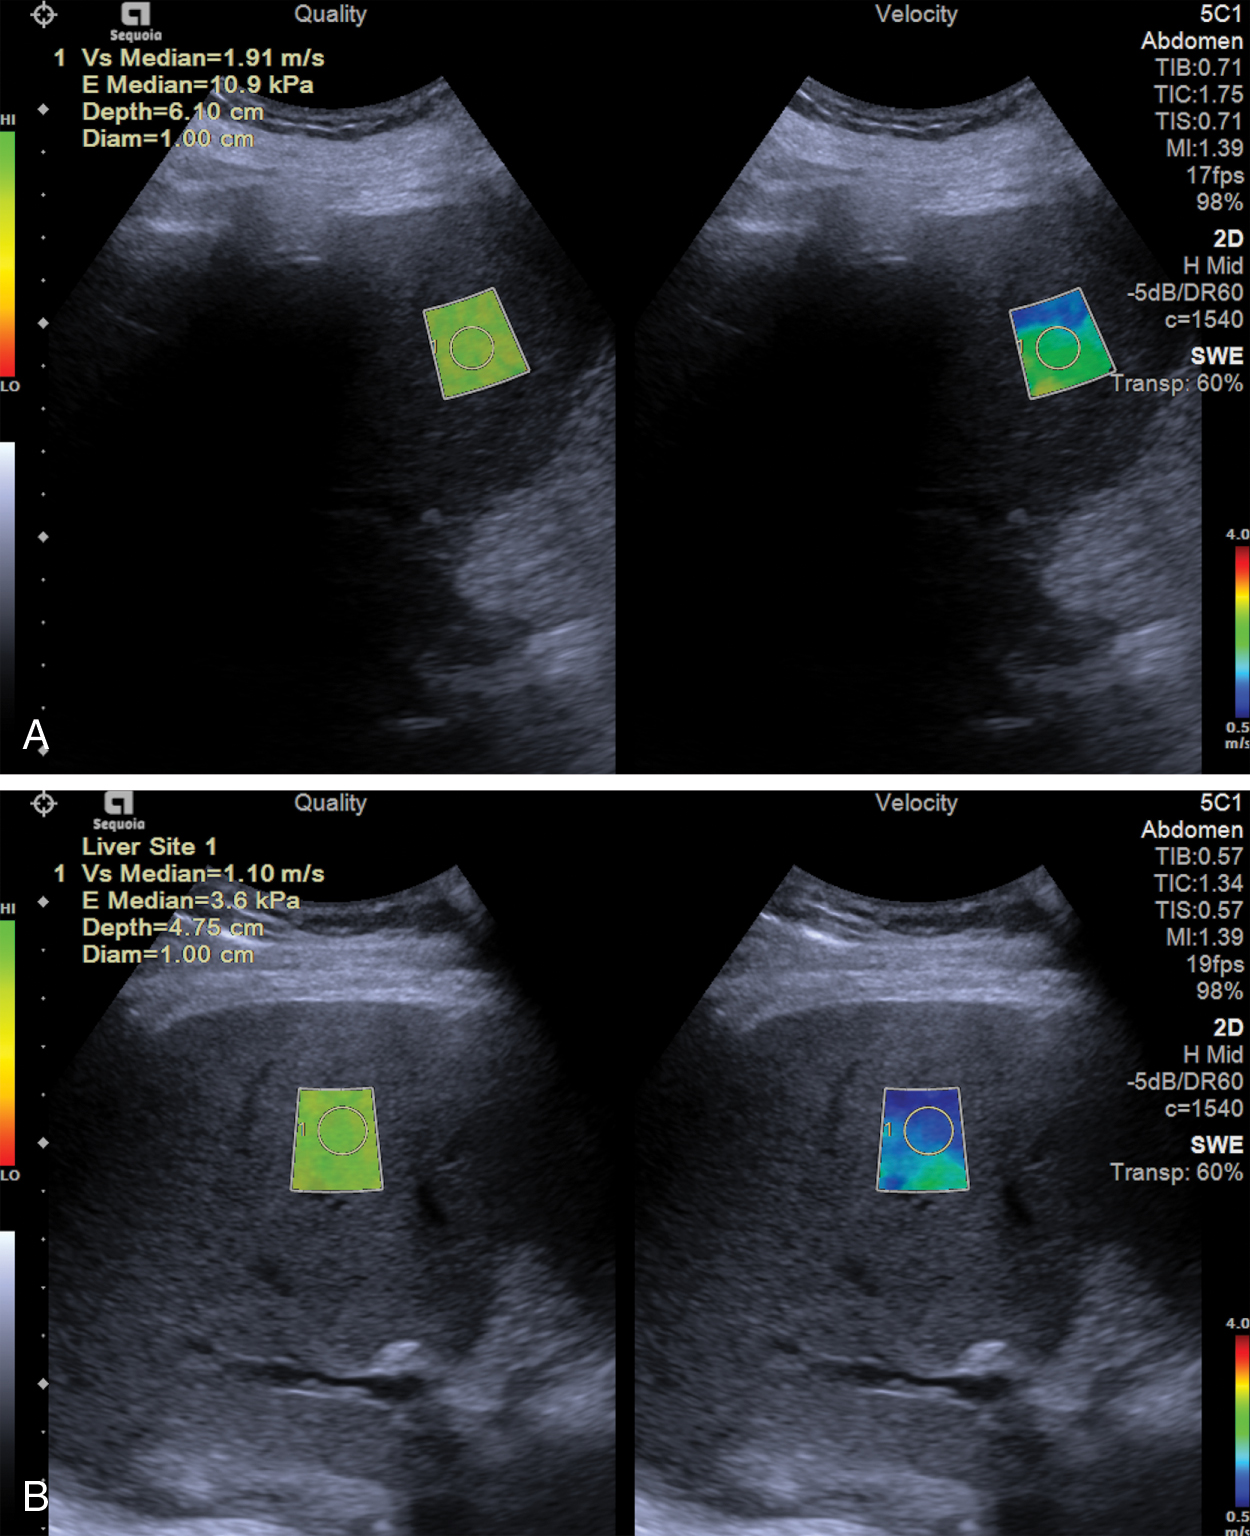
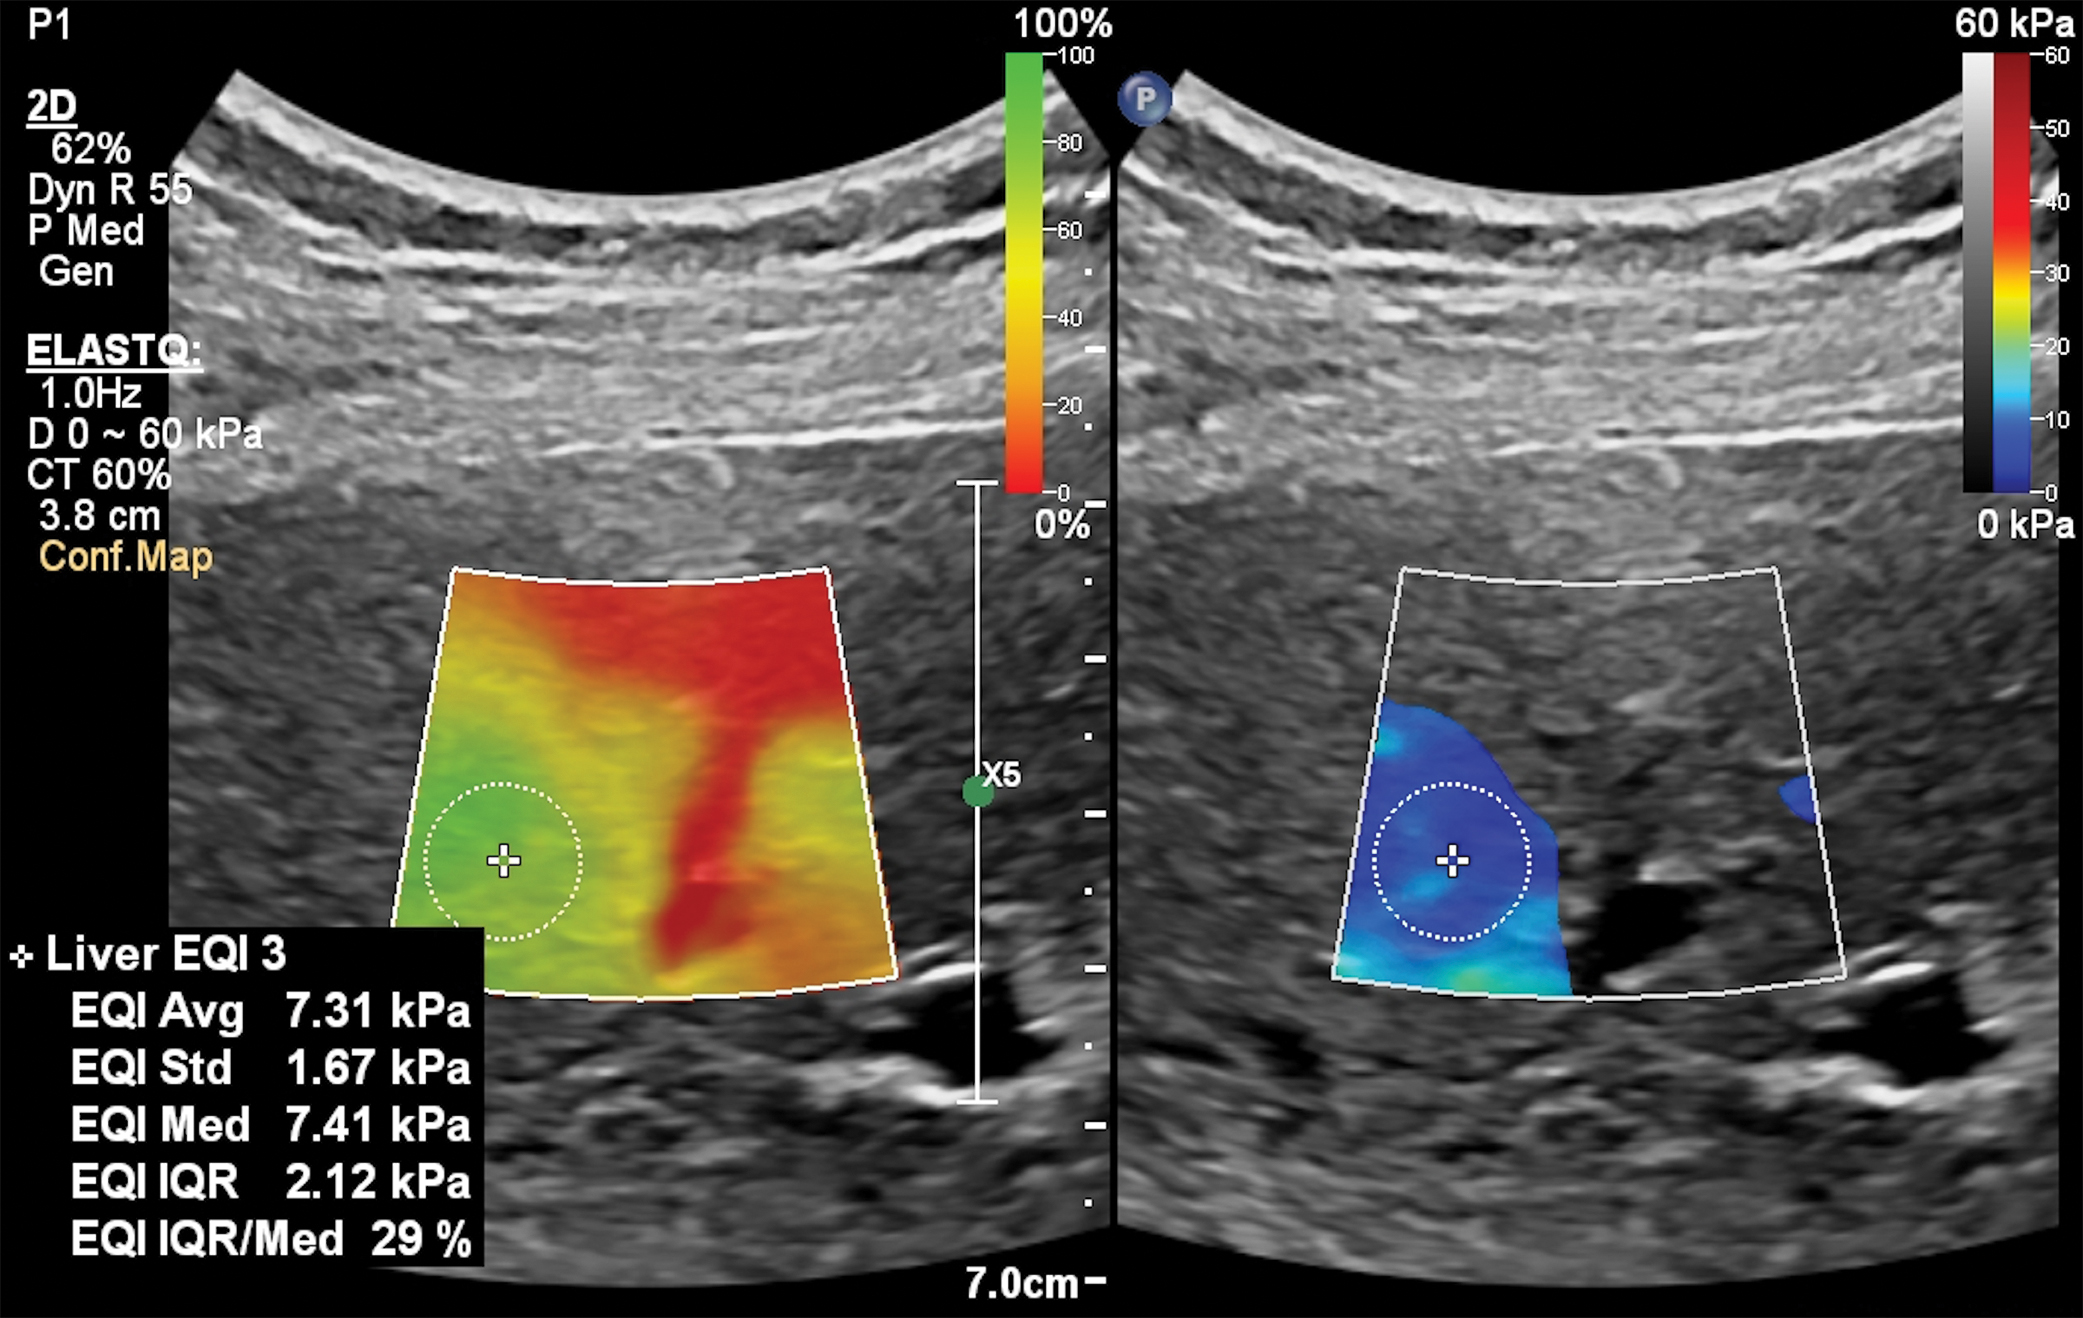
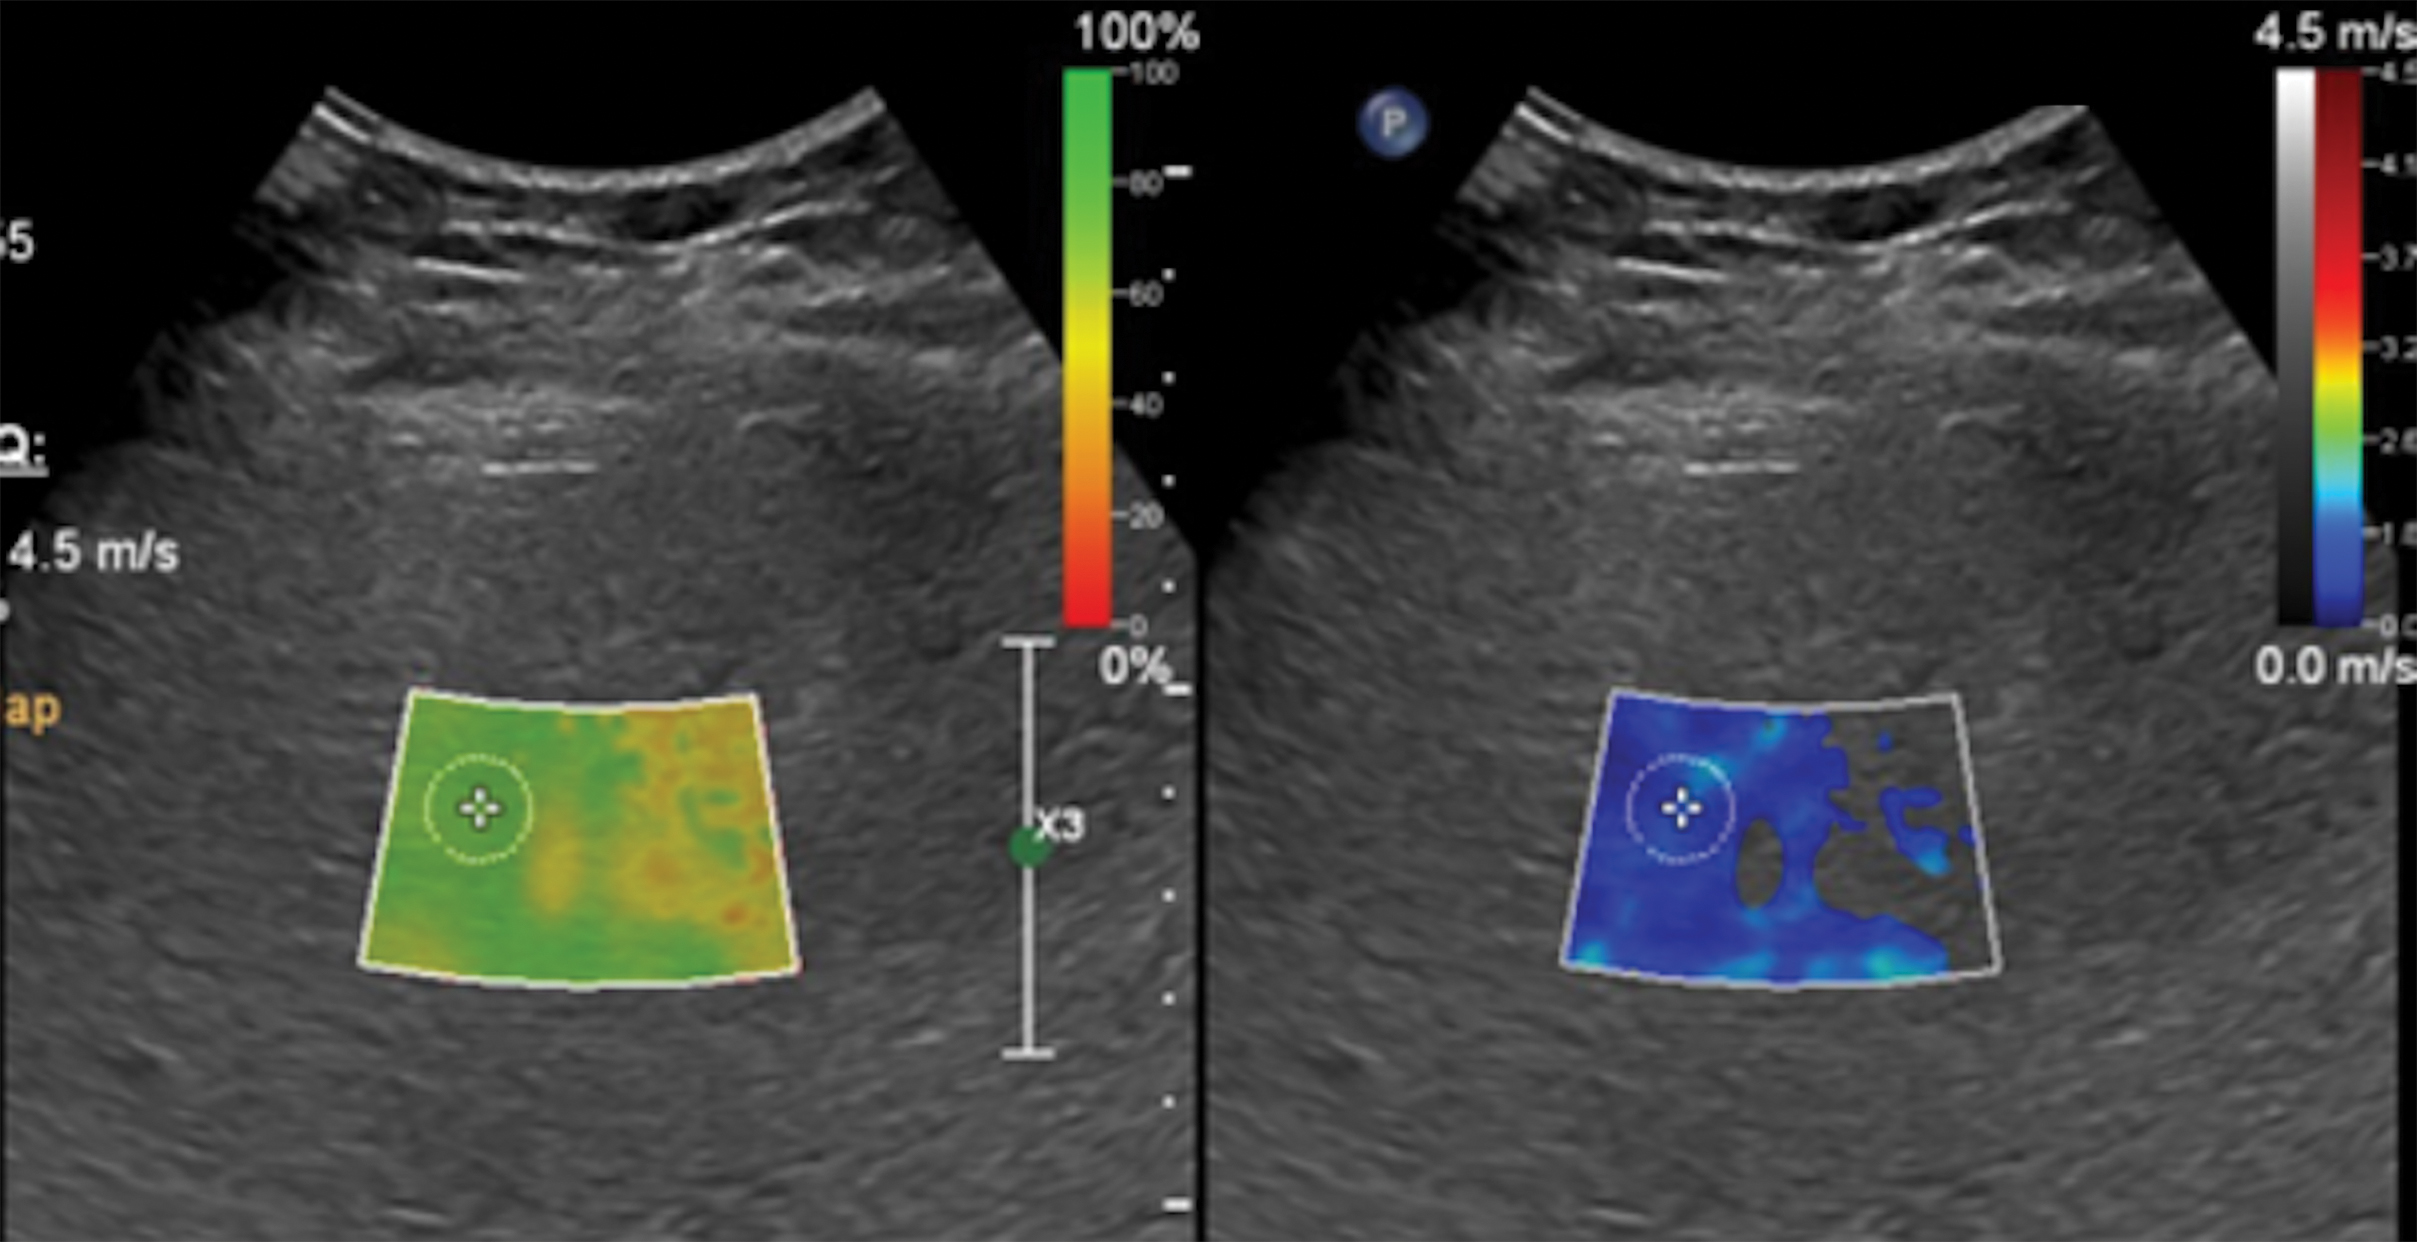
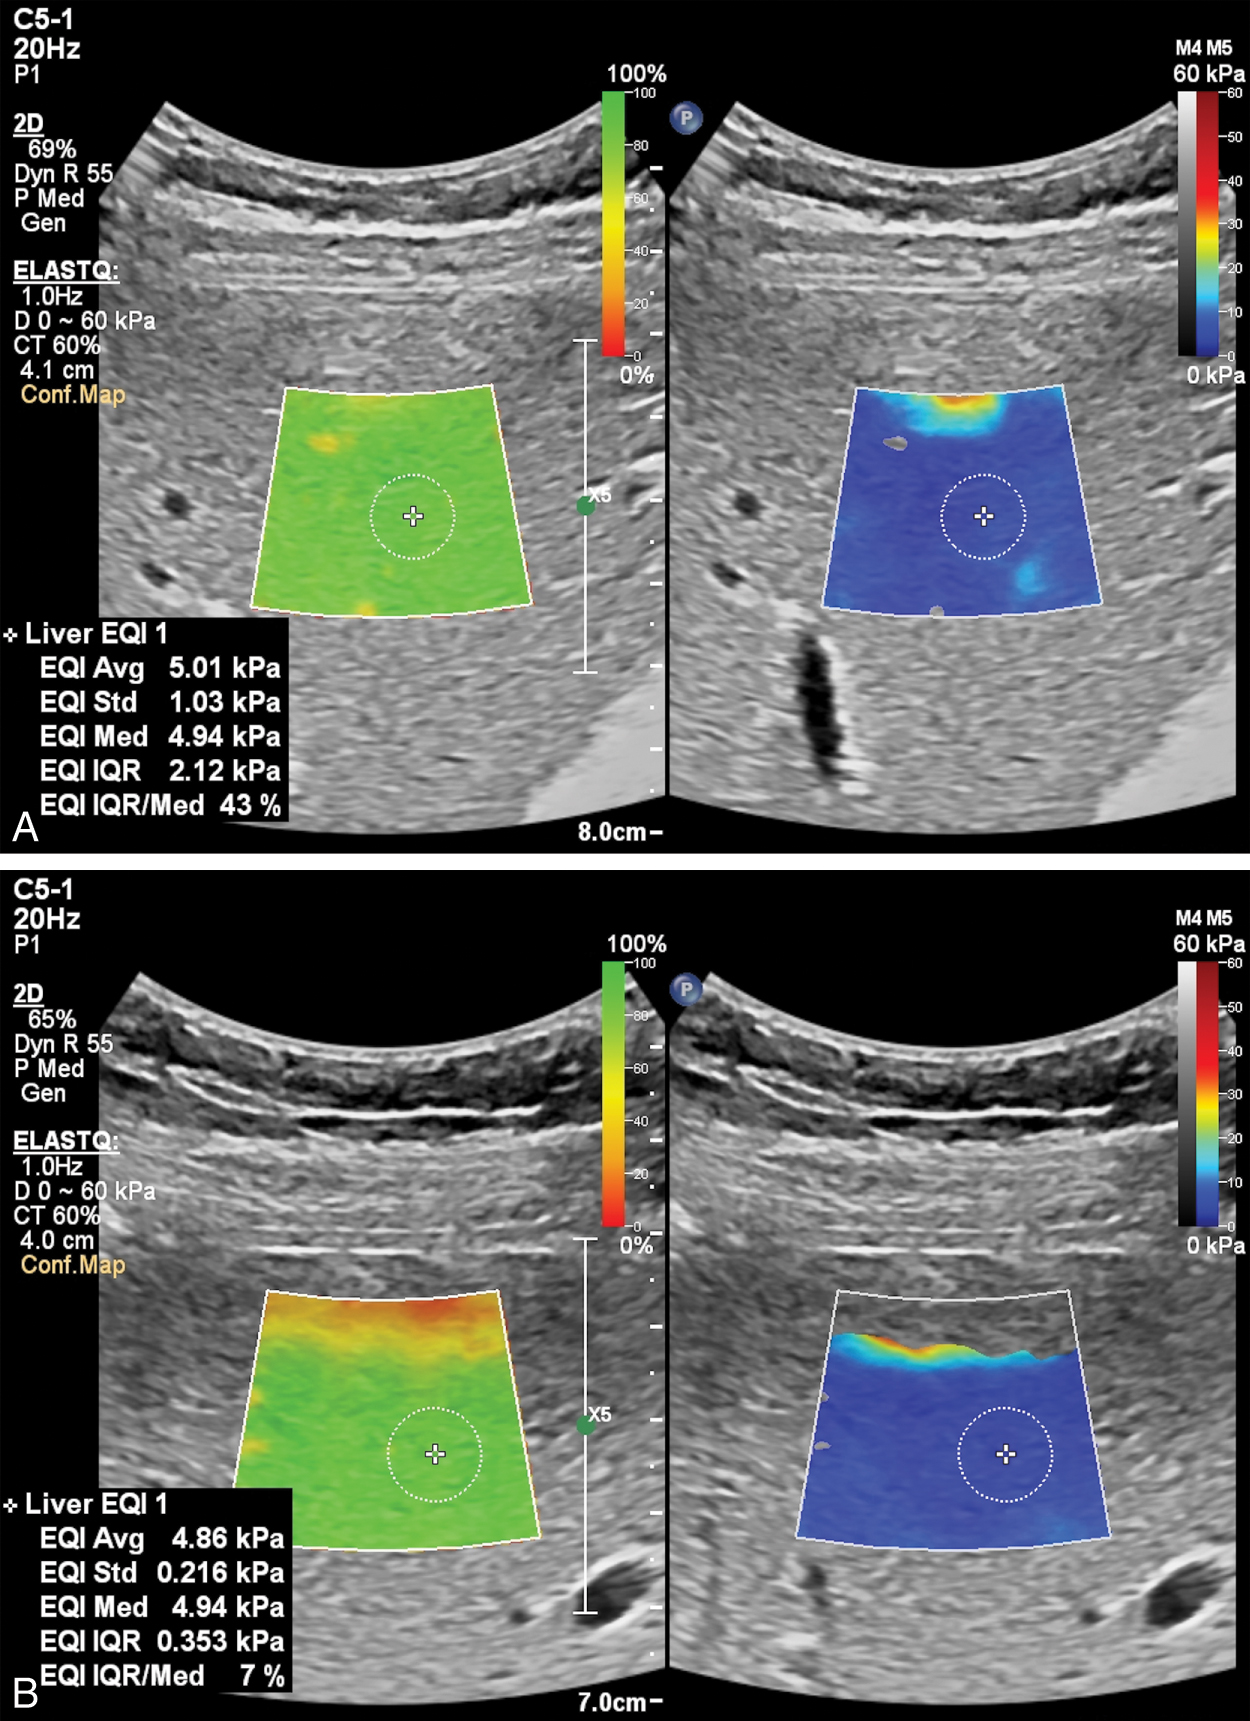
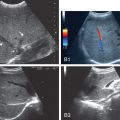
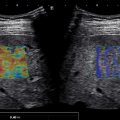
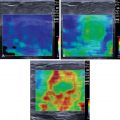
Both general ultrasound limitations and limitations of acoustic radiation force impulse (ARFI) techniques result in tissue stiffness variability estimations. The most common sources of artifacts in ARFI are a poor acoustic window ( Fig. 6.1 ), limited penetration ( Fig. 6.2 ), organ shadows ( Fig. 6.3 ), vessel pulsation ( Fig. 6.4 ), loss of signal ( Fig. 6.5 ), reverberations within the liver ( Figs. 6.6 and 6.7 ), and motion artifacts ( Fig. 6.8 ). Proper placement of the region of interest within the liver can reduce many potential artifacts. Additionally, ARFI is more susceptible to shear wave dispersion effects than fixed excitation frequency methods such as VCTE and magnetic resonance elastography (MRE); in a viscoelastic medium, shear wave velocity is dispersive, meaning velocities vary with frequency, and ARFI shear wave speed estimations can be biased based on the specific imaging system used.
Related posts:
 Liver shear wave elastography: Guidelines
 Liver stiffness beyond the staging of liver fibrosis
 Focal liver lesions in the setting of chronic liver disease
 Conventional ultrasound findings in chronic liver disease
 Staging liver fibrosis with shear wave elastography
 Artifacts in liver stiffness evaluation
Stay updated, free articles. Join our Telegram channel

Full access? Get Clinical Tree


