Abstract
Introduction
Intensive care unit-acquired weakness (ICUAW) is associated with unfavorable outcomes. The current diagnostic tools for ICUAW are invasive, yield delayed results, and lack precision. This study explored the potential of shear wave elastography (SWE), an innovative ultrasound technique, to evaluate the quality changes in the lower extremity muscles of ICU patients, potentially aiding the early detection of ICUAW.
Materials and Methods
We included adult patients diagnosed with ICUAW (average Medical Research Council score < 48) from December 2020 to October 2021. ICU patients were continuously monitored twice daily. Using ultrasonography, we measured the thickness (TH), cross-sectional area (CSA), pennation angle (PA), and SWE (SWE-values) modulus of the bilateral rectus femoris (RF) and vastus intermedius (VI). The diagnostic performance of each parameter was evaluated using sensitivity, specificity, and area under the receiver operating characteristic curve.
Results
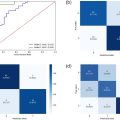
Ultrasound quantification assessments were performed in 47 patients, 24 with ICUAW and 23 without ICUAW. Notably, PA decreased (RF: 11.33%, VI: 10.51%), while muscle rigidity increased (RF: 22.39%, VI: 22.50%) in ICUAW patients compared with non-ICUAW patients. The sensitivity and specificity for PA in the RF were 79.17% and 91.30%, respectively, and those for PA in VI were 79.17% and 78.26%, respectively. The use of both combinations yielded 91.67% and 73.91% sensitivity and specificity, respectively. Employing the PA of RF and SWE-values of RF together, we observed a diagnostic prediction sensitivity of 91.67% and a specificity of 60.87%.
Conclusions
ICUAW patients exhibited increased rigidity of the lower extremity muscles during their hospital stay. Ultrasonic SWE emerged as a reliable and objective tool, offering significant diagnostic value for ICUAW.
Introduction
Intensive care unit-acquired weakness (ICUAW) is a muscle weakness observed in critically ill patients, attributable primarily to the critical illness itself rather than secondary causes [ ]. The morbidity of ICUAW is 70% in patients with systemic inflammatory response syndrome or severe sepsis and even reaches 100% in patients with multiple organ dysfunction. The consequences of ICUAW are profound; they often extend the need for mechanical ventilation, prolong ICU stays, elevate mortality rates, and result in over 50% of survivors experiencing physical or mental disabilities [ , ]. These outcomes not only strain patients and their families but also amplify healthcare costs. Moreover, early diagnosis is of paramount importance; it not only facilitates prompt intervention but also empowers ICU physicians to make informed and optimal treatment decisions, especially in cases of multiple organ dysfunction or associated conditions [ ]. The gold standard for ICUAW diagnosis is muscle biopsy, which can be further subdivided into critical illness myopathy (CIM), critical illness polyneuropathy (CIP), and critical illness myoneuropathy. However, owing to the lack of routine histology and electrophysiology assessments in clinical practice, along with the absence of significant differences in treatment approaches between CIP and CIM, subclassification of ICUAW may appear less relevant to clinicians managing this complication. Glycemic control, early mobilization, cautious steroid administration, and delayed parenteral nutrition are the primary strategies for mitigating the occurrence and severity of neuromuscular complications in patients admitted to the ICU [ ]. Given the significant implications of ICUAW, risk prediction is crucial for efficient allocation of healthcare resources.
Current diagnostic methods for ICUAW present certain limitations. While muscle samples offer valuable insights, their acquisition and interpretation demand specialized techniques. Moreover, muscle biopsies are not only costly but also invasive procedures. The official American Thoracic Society (ATS) clinical practice guideline suggests a Medical Research Council (MRC) score of <48 as the clinical benchmark for diagnosing ICUAW in adults [ ]. However, this approach requires patients to be cooperative and capable of independent mobility. Consequently, patients under deep sedation might experience diagnostic delays. Additionally, discrepancies in electromyography (EMG) and Nerve Conduction Study (NCS) outcome do not always mirror the extent of muscle function impairment. NCS can be influenced by surrounding tissue oedema and potential interference from ward equipment [ ]. Performing and interpreting EMG in the ICU setting can pose challenges, typically necessitating a minimum duration of 3 weeks of symptoms for an accurate diagnosis [ ]. Finally, owing to their high costs, radiation exposure, and associated transportation risks, both CT and MRI scans are unsuitable as routine screening tools for ICUAW [ , ].
Ultrasound elasticity is a reliable and valid imaging tool for the assessment of muscle mass. Ultrasound shear wave elastography (SWE) is used to quantify soft tissue stiffness by evaluating the speed at which ultrasound-induced shear waves travel [ , ]. In this method, the tissue elasticity (measured in kPa) is determined by the transverse wave speed (measured in m/s) generated by an ultrasound push [ ]. This provides insight into the relationship between elastic variations and tissue architecture [ ]. Given that shear waves move faster through stiffer tissues, both shear wave velocity (SWV) and SWE-values can act as markers for tissue elasticity [ , ]. The shear wave elasticity of the brachioradialis and biceps muscles in Parkinson’s disease patients was investigated in a study that revealed a correlation between SWV, joint stiffness, and disease progression. These findings suggest that ultrasonic elasticity measurements can serve as objective quantitative tools for disease monitoring [ ]. Studies conducted on athletes have demonstrated that the identification of reduced tendon stiffness using SWE can provide insights into the aetiology of current tendon pain and tendinopathy [ ].
Some studies have documented reductions in muscle thickness (TH), cross-sectional area (CSA), and Pennation angle (PA) among ICU-admitted patients [ ]. Increased muscle echogenicity has been observed in older adults with sarcopenia [ ]. However, the diagnostic potential of SWE in ICUAW remains unclear.
Our study hypothesized that patients with ICUAW exhibit increased muscle stiffness compared to non-ICUAW patients and that shifts in muscle ultrasound measurements could enhance the diagnostic accuracy of ICUAW. Although ultrasound and SWE measurements are also affected by tissue oedema, we investigated their diagnostic value. The research objective was to investigate the regularity of muscle alterations in ICUAW patients and assess the diagnostic significance of SWE-values for the rectus femoris (RF) and vastus intermedius (VI) in ICUAW.
Materials and methods
Ethical approval
This single-center, prospective, observational study was conducted in the ICU of the Third Affiliated Hospital of Southern Medical University. The local medical ethics review committee approved this study (ID: 2021.013) and waived the requirement for informed consent.
Inclusion and exclusion criteria
All patients were continuously evaluated after being admitted to ICU. Adult patients diagnosed with ICUAW (mean MRC score < 48) were considered for inclusion in the study from December 2020 to October 2021. To determine muscle strength, patients were instructed to perform specific movements such as opening or closing the eyes, sticking out the tongue, nodding the head, and raising the eyebrows, depending on their level of consciousness.
The exclusion criteria included patients aged < 18 and > 80 years, pregnancy, ICU stay < 3 days, spine injury, and severe lower limb trauma that prevented ultrasound exploration.
Study design
Patient characteristics (age, sex, admission diagnoses, comorbidities, and prescription medications) were collected upon admission to the ICU. Laboratory data (creatinine, hemoglobin, sodium, myoglobin, creatine kinase, and lactate dehydrogenase levels), vital signs (the mean systolic blood pressure, heart rate, and body temperature), illness severity (Acute Physiology Chronic Health Evaluation [APACHE] II score), and severity of organ dysfunction (Sequential Organ Failure Assessment [SOFA] score) were recorded.
At the time of hospital discharge, variables, including average hospitalization time in the ICU, average hospitalization time, and MRC score, were collected. The MRC muscle strength score was used to assess the muscle function of the upper (wrist flexion, forearm flexion, and shoulder abduction) and lower extremities (ankle dorsiflexion, knee extension, and hip flexion). The score for each movement ranges from 0 (no muscle contraction) to 5 (active movement against full resistance) [ ]. According to the clinical practice guidelines (2014 ATS), the reference standard of the ICUAW is that the average MRC muscle strength score of all tested muscles should be less than 48. Therefore, patients with an MRC score ≤ 48 were classified into the positive group (ICUAW) and those with an MRC score > 48 were included in the negative group (non-ICUAW). Muscle tests were conducted by an ICU doctor with more than 5 years of clinical experience.
Ultrasound examination
Ultrasound assessments were performed using a LOGIQ E9 (General Electric, USA) equipped with an 8–12 MHz high-frequency linear transducer. One sonographer (with 2 years of expertise in musculoskeletal ultrasound and having completed a month-long training course in ultrasound shear wave elasticity) conducted all ultrasound examinations.
For the procedure, patients were positioned supine with their lower limbs in a naturally relaxed position, exhibiting slight flexion of the hip and knee joints. The lower leg was externally rotated between 30–60° ( Fig. 1 ). The ultrasound settings were adjusted to a depth of 4 cm, gain of 40 dB, and focus targeted at the RF level. The ultrasound probe was positioned midway on the thigh, defined as the midpoint between the greater trochanter and base of the patella. This precise location was marked to ensure consistency in the imaging. For enhanced precision, bilateral measurements were averaged, and each muscle was evaluated at least three times.

Patient ultrasound data, encompassing both B-mode and SWE details, were recorded at 2-day intervals (e.g., D1, D3, and D5) until the patient’s death or ICU transfer (noted as Dout-of-ICU). To avoid baseline differences, we used the formula (Dout of ICU-D1)/D1 (%) to represent shifts in each muscle parameter. Two postgraduate medical students verified the entered values before exporting them to the statistician for analysis.
B-mode images
Muscle metrics were determined using real-time B-mode ultrasonography. Measurements included the muscle thickness of the rectus femoris (RF-TH), cross-sectional area of the rectus femoris (RF-CSA), pennation angle of the rectus femoris (RF-PA), muscle thickness of the vastus intermedius (VI-TH), and pennation angle of the vastus intermedius (VI-RF) ( Fig. 2 ). The PA is defined as the angle between the muscle fibers and tendon membrane and serves as an indicator of muscle strength. A larger PA implies a greater volume of muscle fibers available for contraction, thereby enabling the muscle to produce greater force.

Shear wave ultrasound elastography (SWE)
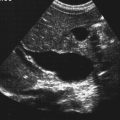
SWE offers a quantitative measurement of muscle elasticity and provides greater insight into the structural and functional characteristics of the muscles and tendons. To determine the SWE-values for the RF and VI, both longitudinal and cross-sectional images of the muscles were acquired, followed by an initial grayscale ultrasound scan. The shear wave mode was manually activated once the best image parallel to the selected structure was obtained. This process yielded a dual-screen display with an elastography image to the right and a B-mode image to the left. In shear wave mode, the region of interest (ROI) for elasticity measurements was defined as a rectangular area measuring 10 mm × 10 mm. The RF and VI were scanned along their longitudinal axes, and the ROI was positioned at the middle depth of the muscles. Subsequently, a 5 mm diameter Q-Box was designed to capture real-time SWE-values (KPa) ( Fig. 4 ).
SWE measurements were obtained by ensuring alignment perpendicular to the longitudinal axes of the RF and VI. It is essential to avoid exerting pressure on the muscles during the evaluation. The probe, which was generously coated with a water-soluble transmission gel, ensured sound acoustic contact without pressing the skin. Successful examination was marked by a color image occupying more than half of the designated ROI.
Statistical analysis
Data processing and statistical analysis were conducted using SPSS25.0 statistical analysis package, and the measurement data are expressed as mean and standard deviation. The first step was to test whether each index satisfied the normality and homogeneity of variance assumptions. Appropriate statistical methods were selected to examine potential statistical differences between the positive and negative groups. If both the normality and homogeneity of variance assumptions were satisfied, an independent sample t-test was utilized. In cases where the normality assumption was satisfied but not the assumption of homogeneity of variance, a Satterthwaite test was applied. The Mann–Whitney U-test was used in other cases. The second step involved plotting the receiver operating characteristic (ROC) curve and calculating the areas under the ROC curve for the indicators that exhibited differences between the positive and negative groups. Simultaneously, the optimal threshold was determined based on the Youden index to obtain diagnostic results for each indicator. Finally, kappa coefficients were used to assess the consistency of the diagnostic outcomes with the MRC scores. Statistical significance was set at p < 0.05.
Results
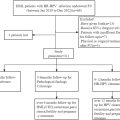
During the study period, 256 ICU patients were evaluated. Of these, 209 were excluded based on certain criteria, and ultrasound assessment was completed in 47 patients, as shown in Figure 3 . Of the assessed individuals, 24 (51.06%) were diagnosed with ICUAW, while 23 (48.94%) were classified as non-ICUAW.

Table 1 outlines the clinical characteristics of the patients. On Dout-of-ICU, the MRC score for the ICUAW group was considerably lower than that of the non-ICUAW group (32 vs. 54, p < 0.001). Most patients in the ICUAW group had acute neurological disease (29%) and sepsis (29%). Acute neurological disease were the main cause of ICU admission in the non-ICUAW group (22%). No significant difference was found in the average ICU stay duration between the two groups (7 vs. 5 days, p = 0.208).
| Non-ICUAW N = 23 | ICUAW N = 24 | p | |
|---|---|---|---|
| Age | 59 (21–77) | 56 (29–77) | 0.327 |
| Gender (male/ female) | 15/8 | 16/8 | 0.917 |
| The average hospitalisation time in the ICU (Days) | 5 (3–12) | 7 (3–15) | 0.208 |
| The average hospitalisation time (Days) | 20 (6–53) | 20 (3–39) | 0.966 |
| SOFA score | 8 (1–18) | 7 (0–16) | 0.677 |
| APACHE II score | 20 (9–36) | 18 (6–33) | 0.460 |
| MRC score | 54 (48–60) | 32 (20–42) | <0.001* |
| The mean systolic pressure (mmHg) | 126 (98–179) | 112 (70–157) | 0.033* |
| Heart rate (Bpm) | 87 (56–135) | 93 (64–152) | 0.383 |
| Temperature (°C) | 36.7 (36.2–38.0) | 37.6 (36.1–40.0) | <0.001* |
| Creatinine (umol/L) | 148 (28–444) | 120 (28–572) | 0.632 |
| Haemoglobin (g/L) | 92 (34–149) | 87 (32–124) | 0.578 |
| Sodium (mmol/L) | 139 (129–152) | 139 (133–153) | 0.982 |
| Myoglobin (ng/L) | 193 (21–1346) | 994 (21–15637) | 0.201 |
| Creatine kinase (IU/L) | 93 (11–372) | 482 (19–5247) | 0.157 |
| Lactate dehydrogenase levels (IU/L) | 337 (127–2487) | 420 (146–2210) | 0.624 |
| Admission diagnoses ( n [%]) | |||
| Acute neurological disease | 5 (22) | 7 (29) | |
| Respiratory system disease | 1 (4) | 1 (4) | |
| Cardiovascular system disease | 2 (9) | 0 (0) | |
| Urinary system disease | 4 (17) | 0 (0) | |
| Hematological system disease | 0 (0) | 1 (4) | |
| Digestive system disease | 4 (17) | 5 (21) | |
| Sepsis | 2 (9) | 7 (29) | |
| Trauma | 3 (13) | 2 (8) | |
| Cancer | 2 (9) | 1 (4) | |
| Concomitant disease ( n [%]) | |||
| Diabetes | 4 (17) | 6 (25) | |
| Pulmonary infection | 3 (13) | 3 (13) | |
| Respiratory failure | 3 (13) | 3 (13) | |
| Cardiac failure | 1 (4) | 2 (8) | |
| Rheumatic diseases | 3 (13) | 2 (8) | |
| Mental disease | 0 (0) | 2 (8) | |
| Myelodysplastic syndrome | 1 (4) | 0 (0) | |
| Hyperthyroidism | 2 (9) | 0 (0) | |
| Atherosclerosis of coronary artery | 4 (17) | 4 (17) | |
| Catagma | 2 (9) | 2 (8) |
Related posts:
 A Narrative Review of Image Processing Techniques Related to Prostate Ultrasound
 Efficacy and Safety of Focused Ultrasound Treatment for High-risk Human Papillomavirus Infection-related Cervical Intraepithelial Neoplasia Grade 2 in Nulligravidae Women: A Retrospective Study
 Development of a Deep Learning Model for Classification of Hepatic Steatosis from Clinical Standard Ultrasound
 Pediatric Mass
 Hydrosalpinx
Stay updated, free articles. Join our Telegram channel

Full access? Get Clinical Tree


