Key Points
- ▪
Cardiac CT is able to image aortic valve morphology and to depict aortic valve area by planimetry.
- ▪
CCT is able to depict the stenotic orifice of mitral stenosis and to determine by planimetry the severity of mitral stenosis, but the coexistence of atrial fibrillation with mitral valve disease is an impediment to doing so.
- ▪
The CCT description of regurgitant lesions and their severity is in a preliminary phase.
- ▪
CCT may contribute indirectly to the assessment of native valve regurgitant disease by quantifying ventricular volumes and ejection fraction.
- ▪
CCT determination of aortic root and ascending aortic detail may assist in defining the nature of aortic insufficiency and therefore in surgical planning.
- ▪
CCT is able to exclude, with high negative predictive value, the presence of coexistent coronary artery disease, with the caveat that atrial fibrillation complicating mitral valve disease is a potential impediment to image quality.
At the present time only preliminary data exist on the evaluation of cardiac valves by cardiac CT (CCT), although contemporary CCT, if cardiac gated, can yield excellent images of native valves. Valve disease, however, is subject to many of the factors that present significant technical limitations or usual exclusions to CCT. Atrial fibrillation, which often coexists with mitral value disease, is an example of such a factor.
One critical deficiency of CCT in the assessment of valves is its inability to assess the hemodynamic function or dysfunction of the valve or prosthesis, because CCT lacks physiologic assessment capability (such as flow velocity, volume, or pressure recording). The role of CCT may be to ascertain and quantify stenotic orifice areas. Quantification of (most, particularly mitral) regurgitant orifices is, for the foreseeable future, beyond the technical means of CCT technology, although structurally simpler regurgitant orifices, such as perforations of the aortic valve, appear to be displayed well by optimized thin oblique multiplanar reformatted images and thin-slab volumetric reconstructions using the blood pool inversion method.
Cine CT is the best means for assessing cardiac valves, and contrast enhancement improves image quality and diagnostic confidence and also improves measurement of aortic valve annulus diameter. The aortic and pulmonary valves, which exhibit one opening/closing motion per cardiac cycle and are smaller and simpler structures than the mitral and tricuspid valves, generally are well visualized. The mitral and tricuspid valves generally are visualized less completely and convincingly, as they exhibit two opening and closing motions per cardiac cycle, and they are much larger and more complex structures.
Valve-associated structures that have very high-speed or erratic motion, especially when they are small (such as flail leaflets and flail chordae, and many vegetations), cannot be seen as readily by CCT due to temporal resolution limitations. Calcification is a common confounder of valve lesion assessment and is almost invariably present in degenerative valve lesions such as aortic valve stenosis and older rheumatic valve lesions. Extensive submitral calcification (mitral annular calcification) or nearby mechanical (metallic) valve prostheses as well as pacemaker leads and implantable cardioverter defibrillators (ICDs) may all result in problematic artifacts to cardiac CT imaging. Atrial fibrillation is an unwelcome and frequently occurring complication of mitral valve disease.
Aortic Valve
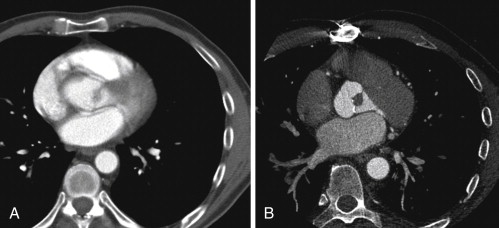
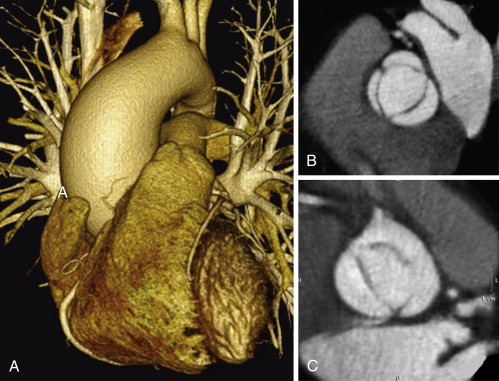
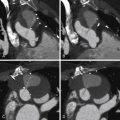
Aortic valve morphology appears to be well evaluated by CCT. Leaflet thickness, leaflet number, leaflet suspension, and calcification, as well as annular and aortic root architecture, can be determined.
Congenital Morphology
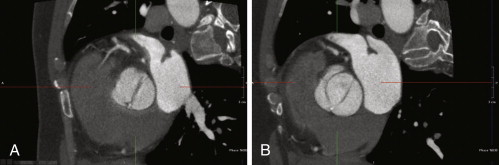
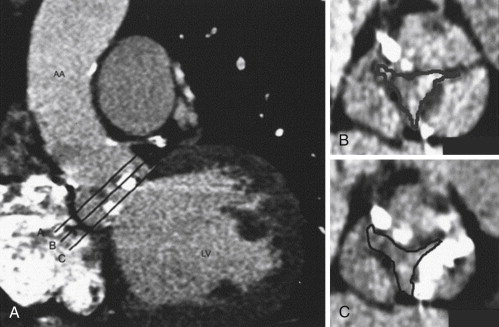
Bicuspid aortic valve morphology is readily apparent. In the cine mode, the leaflets of a normal trileaflet valve open symmetrically to a triangular orifice. A functionally bicuspid valve with a raphe will appear similar to a trileaflet valve in diastole, but in systole will open to an elliptical orifice. A normal aortic valve is 1 to 2 mm thick and is not calcified. Thin (<1 mm) slices are useful for aortic valve morphologic determinations. It is imperative to assess the valve in systole to distinguish a third commissure (normal) from a raphe (functionally bicuspid valve).
Congenitally quadricuspid aortic valves also are readily recognized by CCT, as is the commonly associated central regurgitant orifice.
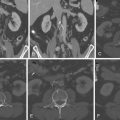
For images of aortic valve morphology, see Figures 16-1 to 16-4 and
Aortic Stenosis
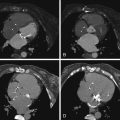
A stenotic aortic valve is apparent by cine CT because of its doming motion (if bicuspid), calcification, thickening, and reduced systolic orifice. The uncommon occurrence of atrial fibrillation in aortic stenosis (AS) reduces one challenge of the CCT assessment of AS.
Calcium Scoring of the Aortic Valve and Aortic Stenosis
Calcification is arbitrarily and variably defined, usually as greater than 130 HU. Severe calcification (score > 3700) is consistent with stenosis, but does not quantitate it or assess for the degree of concurrent aortic insufficiency. Studies suggest that the extent of valve calcification has overall reproducibility within 8%, correlates with extent of valve dysfunction (both gradient; r 2 = 0.77 and area r 2 = 0.73), has some prognostic value, and is equally well assessed radiologically on noncontrast and contrast images. However, calcium score is clinically not a surrogate for other traditional hemodynamic parameters of aortic stenosis and also may not be specific for aortic stenosis, as a calcific valve may also only be insufficient or may have little hemodynamic impairment. The real relevance of calcium for CCT is that when present in great excess in senile calcific degenerative AS, it impairs the planimetry of the orifice.
Aortic Valve Orifice Planimetry
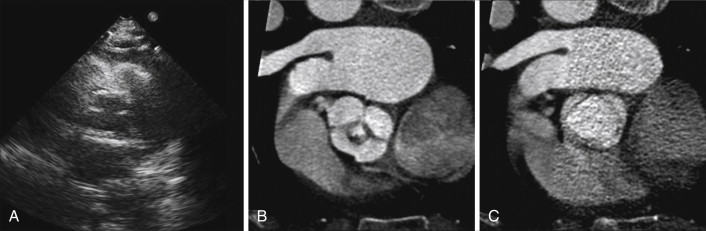
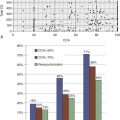
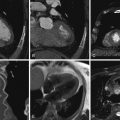
Small single-center series using 16-CT have established that it is feasible to use planimetry to determine the stenotic aortic valve area, with good correlation ( r = 0.89; P < .001) with transthoracic echocardiographic (TTE) estimates of aortic valve area. Planimetry of a valve always assumes that the orifice is planar and is subject to many of the vicissitudes of planimetry seen with transesophageal echocardiography (TEE) and in addition, to the partial volume averaging effects of valve calcium. As indicated, aortic valve calcification is a common and nearly inevitable concurrence in aortic stenosis. However, CCT planimetry of the aortic valve is robust when compared to TEE, because volumetric acquisition of the valve moving in four-dimensional imaging allows for greater assurance that the valve is imaged at the truly most stenotic plane.
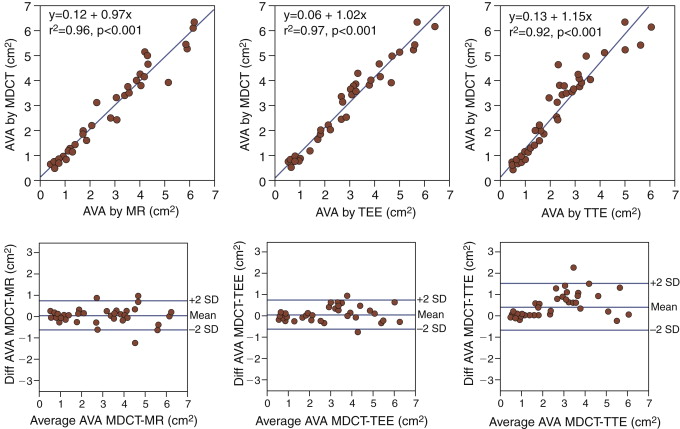
Another single-center series of 48 patients (40-slice CCT), mean age 62 ± 13 years, with and without AS, undergoing TTE, TEE, CCT, and cardiac MR (CMR) yielded high correlations by CCT with CMR ( Tables 16-1 and 16-2 ).
| SENSITIVITY (%) | SPECIFICITY (%) | ACCURACY (%) | NPV (%) | PPV (%) |
|---|---|---|---|---|
| 100 | 100 | 100 | 97 | 96 |
| CMR | TTE | TEE | |
|---|---|---|---|
| CCT AVA versus | r = 0.98, P < .01 | r = 0.96, P < .01 | r = 0.98, P < .01 |
For Bland-Altman plots of linear regression and limits of agreement between CCT-derived and echocardiography- or CMR-derived estimates of aortic valve area, see Figure 16-5 .
Another single-center small series using 64-CT showed good correlation with TEE.
The overall correlation of CCT and TEE measurements of aortic valve area (AVA) as determined by a meta-analysis is 0.99, P < .001.
Delineation of Left Ventricular Outflow Tract Anatomy
The delineation of subaortic geometry by CCT is highly feasible, describing the elliptical orifice shape and lesions such as muscular subaortic stenosis, although less has been established about the ability of CCT to assess subaortic membranes.
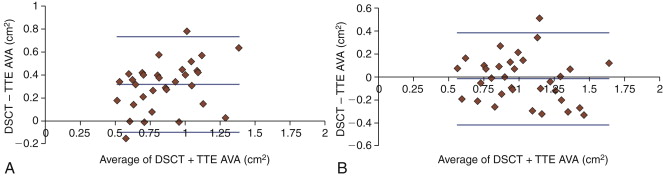
CCT determination by planimetry of the AVA tends to overestimate AVA when compared with TTE ( Fig. 16-6 ). The recognition that the left ventricular outflow tract (LVOT) has an elliptical rather than round cross-section likely underlies the reason for the difference between CCT and TTE measurements of AVA, because CCT determines true LVOT area, whereas TTE determination of the LVOT “diameter” from the parasternal long-axis view yields the lesser diameter (dimension).
For images of stenotic aortic valves imaged by CCT, aortic valve areas measured by CCT, and calcium volume correlation with aortic stenosis severity, see Figures 16-7 through 16-10 and

Related posts:
 Overview of the Process, Exclusions and Risks, and Preparation
 CTA Assessment of Saphenous Vein Grafts and Internal Thoracic (Mammary) Arteries
 Determination of Coronary Calcium
 Assessment of Left Ventricular Structural Abnormalities
 Cardiac and Paracardiac Masses
 Caval Anatomy: Variants and Lesions
Stay updated, free articles. Join our Telegram channel

Full access? Get Clinical Tree


