PET/MR is a promising multimodality imaging approach. Attenuation is by far the largest correction required for quantitative PET imaging. MR-based attenuation correction have been extensively pursued, especially for brain imaging, in the past several years. In this article, we review atlas and direct imaging MR-based PET attenuation correction methods. The technical principles behind these methods are detailed and the advantages and disadvantages of these methods are discussed.
Key points
- •
Atlas and direct imaging based methods are 2 major categories of MR-based PET/MR attenuation correction.
- •
Atlas-based methods are accurate and robustness in brain PET attenuation correction; however, atlas-based approach cannot account for intersubject variations and is time consuming.
- •
Direct imaging-based MR attenuation correction methods are rapid and can account for variations across patients.
- •
Direct imaging with segmentation only approaches have large attenuation correction errors owing to discrete linear attenuation coefficient linear attenuation coefficient values.
- •
Direct imaging with segmentation and MR-computed tomography conversion has similar PET attenuation correction accuracy as the atlas-based MR attenuation correction.
Introduction
Simultaneous PET and MR imaging offers unprecedented opportunities to synergize the physiologic and molecular imaging capability of PET and the excellent anatomic and functional imaging capability of MR. This instrument opens up many possibilities for investigation in oncology, Alzheimer’s disease, Parkinson’s disease, and epilepsy, which are discussed in David S. Lalush’s article, “ MR-Derived Improvements in PET Imaging ,” in this issue. Simultaneous PET/MR imaging is emerging as a potential clinical and research tool for the development of noninvasive imaging biomarkers.
In PET imaging, an annihilation of an emitted positron with an electron produces two 511-KeV photons that move in opposite directions. These photons travel through the tissue before reaching PET detectors. The absorption and scatter caused by the photon–tissue interaction leads to photon attenuation. The effect of photon attenuation on PET signal is described in the form of a monoexponential function as follows:
where I and I 0 are the nonattenuated and attenuated PET signals, respectively, μ and L represent the linear attenuation coefficient (LAC) and thickness of a tissue. Photon attenuation depends on the spatially varying electron density and tissue thickness. Photon attenuation can result in as high as 90% signal reduction in some regions. Therefore, attenuation is by far the largest correction required for quantitative PET imaging. Small errors in estimating the attenuation correction factors may lead to significant qualitative and quantitative errors in PET images (ie, bias and artifacts). PET attenuation correction methods require knowledge of the spatial distribution of tissue attenuation coefficients within the PET field of view. This information is represented in the form of an attenuation map (or the μ map) whose intensities represent the LAC values. In addition to tissue attenuation, some other sources of attenuation are from various hardware, such as patient table and radiofrequency coils that are placed within the PET field of view. A comprehensive review regarding hardware attenuation correction methods can be found in Paulus and Quick. In this review, we focus on methods to generate patient attenuation correction maps using MR imaging.
In standalone PET systems, attenuation maps are usually estimated from a transmission scan. An external long half-life radionuclide source such as 68 Ge/ 68 Ga that emits gamma photons at a similar energy level (511 KeV) is used to acquire a transmission scan. The attenuation maps can be estimated by dividing the reference scan (blank scan, I 0 ) with the transmission scans. Because the number of photons emitted by the external radionuclide source is relatively low, a considerable acquisition time (approximately 10–45 minutes) is needed just for an attenuation map with an adequate signal-to-noise ratio.
Since the introduction of the first commercial PET/computed tomography (CT) scanner in early 2001, combined PET/CT replaced PET-only scanners at a rapid pace. In combined PET/CT systems, a CT scan is used to provide the PET attenuation correction information. The attenuation of x-rays transmitted through a patient is the source of CT contrast, and also directly related to electron density. Because the higher energy (511 keV) gamma photons in PET have a lower probability of being attenuated than the lower energy x-ray photons (80–140 keV) in CT, a piecewise linear transformation has been used to transform the CT Hounsfield unit (HU) to PET LAC values. Compared with the PET transmission scans, CT images have higher signal-to-noise ratio and can be acquired much faster. However, it has been reported that CT-based attenuation correction led to PET quantification errors in bones. Nevertheless, CT-based PET attenuation correction has been widely accepted as the clinical standard.
Unlike PET/CT, MR-based attenuation correction (MRAC) in simultaneous PET/MR is very challenging. MR imaging provides information on proton density and MR relaxation rates. It does not provide direct information on electron density needed by PET attenuation correction. While PET/MR imaging is FDA approved for clinical use, MR imaging-based attenuation correction methods have not been well-accepted for clinical trials. Bone has a near-zero signal in conventional MR images owing to low spin density and a rapid T2 relaxation rate, and it causes the most photon attenuation per unit volume. In contrast, air space appears similarly as the bone in conventional MR images, although it does not cause photon attenuation. Therefore, the most difficult tasks of MR-based attenuation correction are to separate bone from other tissue and air, and assign correct LACs accordingly. It has been demonstrated that improperly accounting for bone leads to a large underestimation of PET signal, particularly in tissue near bone.
In the past several years, numerous approaches have been proposed to develop attenuation correction for PET/MR imaging. There is 1 class of method that relies primarily on PET emission data to directly estimate attenuation information through iterative joint estimation based on maximum likelihood. This class of method is dubbed as maximum likelihood reconstruction of attenuation and activity. More recently, PET time-of-flight information has been incorporated into the maximum likelihood reconstruction of attenuation and activity method to improve PET attenuation correction. MR imaging is not essential in the maximum likelihood reconstruction of attenuation and activity approaches. Regarding MR-based PET attenuation correction, there are 2 major categories of methods to generate CT like images for PET/MR imaging attenuation correction. The first category consists of an atlas-based approach. This typically relies on a precompiled atlas of paired MR and CT images and an algorithm to generate a pseudo-CT image from patient MR images. These pseudo-CTs are converted subsequently to PET attenuation maps through the same scaling operation used in PET/CT attenuation correction. The second category of MR-based attenuation correction consists of direct MR imaging using Dixon, ultrashort echo (UTE) or zero echo time (ZTE) without using complex imaging registration and processing procedures. In the latter approach, individual patient MR images are segmented into several tissue classes. Early efforts assigned a constant attenuation value to each tissue class. More recently, advanced methods have been proposed to derive conversion factors to convert MR signal/relaxation rates to CT HU for continuous LAC. In this review article, we focus on the MR-based PET attenuation correction methods. The advantages and disadvantages of these methods are discussed.
Atlas-based approaches
The atlas-based methods usually derive a computational relationship from a group of observed CT and MR imaging image pair using population data, which can be generalized for future deployment when only MR imaging is available. Atlas-based approaches usually involve 2 main steps. The first step is to align target patient MR images with atlas MR/CT images. The second step is to use the aligned atlas MR/CT images to synthesize a pseudo-CT for the target patient. Various methods have been proposed and these methods differ either in the image registration step or in the pseudo-CT generation step. Depending on how pseudo-CT were generated, we roughly categorize these methods into 3 subgroups: voxel-based, patch-based, and machine learning–based methods. We briefly introduce the technical aspects of these methods and summarize their performances.
Image Registration
In the atlas-based methods, image registration is usually used first to achieve alignment of the same anatomy from different subjects through transforming the anatomic geometry of the original acquired image. If an image alignment can be represented by a multiplication of the entire image volume with a matrix (including translating, rotating, stretching, and scaling), this image registration is classified as a linear transformation (affine registration). A rigid registration is a special case of an affine registration that only consists of translation and rotation transformation. Nonlinear registration (deformable registration) can improve registration accuracy by using flexible local transformation. Usually, linear registration is used for same subject multimodal image registration, whereas a nonlinear registration is used for atlas to subject image alignment where local geometry differences are expected.
Voxel-Based Pseudo-Computed Tomography Generation
Schreibmann and colleagues proposed a multistep approach to register atlas CT images directly toward the patient MR imaging without going through intermediate MR image registration. Their method used a 3-step CT–MR image registration, including (1) an initial approximate CT–MR matching using a rigid registration, (2) a B-spline registration to solve large deformation between atlas CT and individual patient MR, and (3) an optical flow deformable registration to refine BSpline registration. The aligned atlas CT signal voxel by voxel were then directly used for patient’s PET attenuation correction. The mean distance between the aligned atlas CT and the actually acquired CT was 1.26 and 2.15 mm, respectively, for the external contour and bone. The mean HUs difference across all voxels was less than 2 in 17 brain tumor patients. Owing to lack of PET/MR/CT trimodality data, PET attenuation correction accuracy was not evaluated in this study. Accurate image registration is crucial to this method. Because CT and MR images have very different image intensity and tissue contrast, an accurate deformable registration between atlas CT and patient MR might be challenging.
Burgos and colleagues used a B-spline transformation to register patient MR imaging to a group of atlas MR imaging/CT pairs. A local normalized correlation coefficient was used to assess similarity between the patient’s and an atlas subject’s MR images for each voxel. A ranking scheme was used on the voxel similarity measure to assign more weight to an atlas subject’s images better registered to the patient MR images. An estimate of the target subject’s CT was then obtained by a weighted averaging of all atlas CT images. This method can tolerate registration inaccuracy through this similarity based weighting. Relative absolute error was computed as the percent absolute PET signal difference between attenuation-corrected PET using the estimated CT and the actually acquired CT. This method achieved a relative absolute error of 2.87 + 0.90% in PET reconstruction.
Izquierdo-Garcia and associates used SPM8 to improve the registration accuracy via tissue segmentation. MR imaging images were first segmented into gray matter, white matter, cerebrospinal fluid, bone, soft tissue, and air with a Gaussian mixture model considering the prior spatial probabilities of each voxel belongs to different tissue types. This segmentation was performed through an imbedded processing pipeline in SPM for a tissue specific registration. A patient T1 was also followed through the same steps to be aligned to this template. Owing to the diffeomorphic nature of the registration, the CT template could be inversely warped into the subject’s native space for the estimated CT. The voxel- and region of interest–based comparisons yielded an error of 3.87 + 5.0% and 2.74% + 2.28% in reconstructed PET images, respectively.
Patch-Based Pseudo-Computed Tomography Generation
In the method proposed by Chen and colleagues, a nonlinear symmetric diffeomorphic registration algorithm was used to align patient’s T1-weighted MR images to atlas subject’s T1-weighted MR images and CT images. This method used an air distribution probability map obtained from all the atlas subjects’ CT images to assist air space segmentation from MR T1-weighted images. To estimate the patient’s tissue CT images, a patch-based method is used. Compared with a voxel-based method, a patch-based method allows for an incorporation of neighborhood information for a better description of the local intensity distribution. In this study, patches of 5 × 5 × 5 cubes located in the vicinity of the voxel were combined using weights derived from a sparse regression. Because the CT estimation was performed using neighborhood patches, the performance of this method is less dependent on the image registration accuracy. This method had an absolute percent error of 2.42 + 1.0% in the whole brain PET and 85.8% ± 12.9% of all voxels had a below 5% PET errors from 20 subjects. The limitation with this approach is that sparse regression is very computational intense and parallel acceleration is needed for prompt CT estimation.
Andreasen and colleagues used a patched-based method for pseudo-CT estimation using an affine registration. In this method, a patch-based database was formed for each voxel location and the k nearest neighbors. Patch similarity weighting was used to regress the CT value. This method outperformed a method that used deformable registration, multiatlas, and Gaussian mixture regression with dual echo ultrashort echo time images. This method delivered high dosimetric accuracy with an average deviation of less than 0.5% compared with target coverage in 5 patients.
In a patch-based approach proposed by Roy and colleagues, patches were matched between the reference and target MR images. The corresponding CT patches were then combined via Bayesian estimation. This approach did not require image registration. This approach assumed the patches following a mixture of 2 Gaussian distributions and maximized the probability of the observed subject patch through the expectation maximization algorithm. The reconstructed PET images with the synthesized CT was highly correlated with the reconstructed PET with the acquired CT (ρ = 0.99; R 2 = 0.99).
Torrado-Carvajal and colleagues implemented nonlocal patch-based CT estimation using GPUs (graphics processing units). It propagated MR patch–derived similarity to CT patches for weighted linear combinations. After nonlocal estimations, the estimated CT was regularized as a median within a local neighborhood. The standardized uptake value error was lower than 10% in most voxels in simulation. The reconstructed standardized uptake value was highly correlated with the gold standard (R 2 = 0.998) in simulation. In the only one clinical scan, the correlation is reduced to 0.8919.
Machine Learning–Based Pseudo-Computed Tomography Generation
Machine learning methods used training data to derive a relationship between CT HU and MR signal using features such as signal intensity and geometric metrics. These learned relationship can then be applied to patients to generate pseudo-CT. Machine learning methods including Gaussian process regression (GPR), support vector regression (SVR), and random forest have been proposed. The Gaussian process assumes that the random variables have a joint Gaussian distribution, which can be specified fully by its mean and covariance functions. GPR refers the inference of continuous values with a Gaussian process prior. GPR is a kernel-based method for a nonlinear regression problem interpreted in a Bayesian context of Gaussian process. To infer the unknown function, GPR calculates a prior from training samples for a posterior generalization. The learning of GPR is realized through determining covariance or kernel function parameters. SVR solves a constrained optimization problem. SVR can tolerate small errors between the predicted and true values within a small bound ε (or ε-insensitive SVR) while controlling the complexity of the regression function. Furthermore, a nonlinear regression can be transformed into a linear regression using a kernel function (such as a radial basis function) to map the problem into a higher dimensional space. Random forest is an ensemble learning methods, which grows a set of decision trees through partitioning the data orderly into either left or right branches (like a tree). The input to each tree is a set of bootstrapped samples of the original input data. The final estimation is performed via either averaging or majority voting of the outputs from each individual tree.
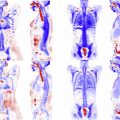
Hofmann and colleagues have developed a GPR for pseudo-CT estimation. The Gaussian process modeled a mean function and a kernel function for covariance of the Gaussian process. The authors used a multiply of 2 Gaussian functions considering both the similarity of the MR patches and the distance from an atlas patch to the voxel location where CT is being estimated. In this work, the authors estimated CT as the average of the surrounding patches after deformable image registration. This method was applied for brain PET attenuation correction in 3 patients. A mean percentage error of 3.2 ± 2.5% were obtained in manually defined regions of interest in the dorsal cortex, frontal cortex, lateral cortex, caudate nucleus, thalamus, and white matter. This method was later adapted for whole body PET/MR attenuation correction. The mean percent error was 7.7% ± 8.4% for the whole body PET/MR.
Johansson and colleagues used a Guassian mixture regression model with T2 and dual echo UTE images to estimate CT from the joint distribution of MR and CT. Two dual-echo UTE sequences were acquired with 10° and 60° flip angles. In addition, 3-dimensional T2-weighted images were also acquired. MR signal intensity at a voxel plus the mean and standard deviation from a 3 × 3 × 3 neighborhood around this voxel from UTE and T2-weighted MR images were jointly modeled with CT using Gaussian mixtures. To estimate a pseudo-CT, the conditional probability density given the MR information was maximized to estimate CT. PET attenuation correction was not performed in this study, only CT estimation accuracy was reported in a paper by Johansson and colleagues. The average error for estimated CT was 137 HU. This method was evaluated later by Larsson and colleagues for PET attenuation correction in 8 patients. The mean and standard deviation of the percent error in brain were −1.9% ± 4.1% with a range from −61% to 34%.
Support vector machine was used for CT prediction from Dixon-volume and UTE images. As in the conventional SVR-based approaches, a radial basis kernel function between the features was chosen in this study to be tuned for optimal performance. The features included mean, median, variance, and minimal and maximal values across a 3 × 3 × 3 window from 3-dimensional Dixon-VIBE fat, 3-dimensional Dixon-VIBE water, and difference volumes. When compared with PET reconstructed using the CT-based attenuation correction, the epsilon-insensitive SVR yielded an error of 2.4% and 2.16% in complete brain and regions close to the cortical bone.
Chan and colleagues have used random forest classifiers to achieve an accuracy in Dice similarity coefficients of 0.83 + 0.08 and 0.98 + 0.01 in air and bone segmentation, respectively. This method used both MR anatomic and PET images without attenuation correction, and it took advantage of gradient, texture (metrics quantifying the perceived textures of image), and context features (relationship between image information at different locations). An interesting finding was that features from the uncorrected PET could replace the contextual features from MR imaging without sacrificing the segmentation accuracy. This finding suggests that PET images without attenuation correction can be used as an input to a machine learning algorithm to further improve attenuation correction accuracy.
Huynh and colleagues used a structured random forest to predict CT values. The features included spatial location, pairwise differences, Haar-like features, and discrete consine transform coefficients, and the autocontext model. These features allowed the random forest–based learning method to account for the anatomic location, T1 intensity, T1 image intensity difference using voxel pairwise difference (at the voxel level), Haar-like features (at subregion level), and discrete consine transform coefficients (at the whole patch level), and the occurrence of CT intensities between different anatomic regions (autocontext model). The CT patch difference was computed as the summation of the squared difference between the principle component analysis coefficients of the CT patches. The final CT patch was averaged across all the voxels for a smoothed CT prediction. In the brain region, this method achieved an average mean absolute difference 99.9 ± 14.2 HU between the synthesized CT and actually acquired CT. Because PET data were not available, PET attenuation correction accuracy was not evaluated.
Summary
In summary, atlas-based attenuation correction methods can provide accurate CT estimations and PET attenuation maps in brain for patients with normal anatomy. Depending on how pseudo-CT images were generated, the atlas-based methods can be roughly classified into voxel-based, patch-based, and machine learning–based pseudo-CT generation subgroups in this review. The pros and cons of these methods are summarized in Table 1 . The basic premises of atlas-based attenuation correction approaches are that (1) each individual patient’s anatomy can be well-represented by the population data, and (2) the morphologic similarity of a patient’s MR images to the atlas images can result in CT HU similarity. Data with either abnormal anatomy and/or unusual tissue density (eg, bone density) that is very different from the population average may lead to large attenuation correction errors. Moreover, atlas-based methods usually involves complex computations, which may be time consuming. Thus far, atlas-based methods have been well tested in neuroimaging. Owing to difficulty in image registration, the atlas-based MR-based attenuation correction method has not been well-developed and used for whole body imaging. The following clinical usefulness discussion is only limited to neuroimaging applications. If a nonlinear registration can be performed fairly well, the voxel-based pseudo-CT generation method is recommended owing to its simplicity and speed. This class of method is more clinical flow friendly at a reasonable PET attenuation correction accuracy. In cases that nonlinear registration is challenging or high accuracy is needed for subtle signal abnormality detection, either a patch-based or a machine learning–based method should be considered at the expense of computational cost.
Related posts:


Stay updated, free articles. Join our Telegram channel

Full access? Get Clinical Tree


