Muscle and Tendon Injury
Muscle and tendon injuries may be categorized as acute and chronic. Acute injuries tend to take the form of direct impact injury, stretch injury during contraction (strain), or penetrating injury. Acute muscle injury can be clinically categorized as grade 1 (no appreciable fiber disruption), grade 2 (partial tear or moderate fiber disruption with compromised strength), and grade 3 (complete fiber disruption). At sonography, muscle contusion and hemorrhage acutely appear hyperechoic ( Fig. 2.1 ). Excessive and intense muscle activity may produce diffuse muscle hyperechogenicity if imaged acutely from transient muscle edema, termed delayed onset muscle soreness ( Fig. 2.2 ). Muscle tears will appear as an abnormal hypoechoic or mixed echogenicity area or muscle defect. One hallmark of full-thickness tear is muscle or tendon retraction, which is made more obvious with passive movement or active muscle contraction. Hemorrhage will later appear more hypoechoic ( Fig. 2.3 ), although a heterogeneous appearance with mixed echogenicity is common ( Fig. 2.4 ). As soft tissue hemorrhage resorbs, a hematoma will become smaller and more echogenic, beginning at the periphery ( Fig. 2.5 ). A residual anechoic fluid collection or seroma may remain ( Fig. 2.6 ). Hemorrhage located between the subcutaneous fat and the adjacent hip musculature can occur with trauma as a degloving-type injury, called the Morel-Lavallée lesion ( Fig. 2.7 ). Residual scar formation appears hyperechoic ( Fig. 2.8 ). Heterotopic ossification may remain and is hyperechoic with posterior acoustic shadowing ( Fig. 2.9 ). An area of damaged muscle may ossify, termed myositis ossificans ( Fig. 2.10 ), and ultrasound can show early mineralization before visualization on radiography. Often, computed tomography (CT) is needed to demonstrate the characteristic peripheral rim of mineralization characteristic of myositis ossificans, given shadowing seen on ultrasound. Prior trauma to muscle or its nerve supply can result in muscle atrophy, which causes increased echogenicity and decreased size of the affected muscle ( Fig. 2.11 ).


With direct impact injury, the belly of a muscle is typically involved with hematoma and variable fiber disruption ( Fig. 2.12 ). In contrast, stretching of a contracting muscle typically results in injury at the musculotendinous junction and is more common with muscles that span two joints, such as the hamstring muscles ( Fig. 2.13 ) and the medial head of the gastrocnemius ( Fig. 2.14 ). The specific type of muscle architecture should be considered when evaluating for myotendinous injury. For example, a muscle with a unipennate architecture (e.g., the medial head of the gastrocnemius) shows injury at the myotendinous junction located at its periphery ( Fig. 2.14 ). A muscle with circumpennate or bipennate architecture (e.g., the indirect head of the rectus femoris) may show injury at its distal musculotendinous junction or within the muscle belly as a central aponeurosis tear (see Fig. 6.65A ). Musculotendinous injury also demonstrates variable echogenicity from hemorrhage and fluid, depending on the age of the injury and the degree of fiber disruption. Passive joint movement or active muscle contraction can demonstrate retraction at the site of the injury that indicates full-thickness tear. Particularly in children, these types of acute tendon injuries may be associated with bone fragment avulsion at the tendon attachments, which appear hyperechoic with possible shadowing.


With penetrating injury or laceration, acute muscle and tendon injury may occur at any site. The obvious physical examination findings usually guide the ultrasound evaluation. Muscle and tendon injuries are again classified as partial-thickness or full-thickness tears. Dynamic imaging is helpful in this distinction because it makes retraction related to full-thickness tears more conspicuous. Gas introduced during the penetrating injury can make evaluation extremely difficult; air appears hyperechoic with heterogeneous posterior shadowing. In addition to muscle or tendon abnormality, penetrating injury may also produce bone and peripheral nerve injury (see Fig. 6.93B ).
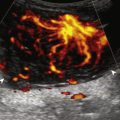
Chronic muscle and tendon injuries are usually the result of overuse, with tendon degeneration and possible tear. It has been shown that such involved tendons show eosinophilic, fibrillar, and mucoid degeneration but do not contain acute inflammatory cells; therefore, the term tendinosis is used rather than tendinitis . At sonography, tendinosis appears as hypoechoic enlargement of the involved tendon, but without tendon fiber disruption (see later chapters). Several tendons may commonly show increased blood flow on color or power Doppler imaging in the setting of tendinosis, such as the patellar tendon, Achilles tendon, and common extensor tendon of the elbow. This increase in blood flow is not due to inflammation but rather represents neovascularity. Tendinosis may progress to partial-thickness and full-thickness tendon tear. Chronic muscle and tendon injuries that result in tear can be associated with atrophy of the muscle, which appears hyperechoic and decreased in size. After surgery, misplaced hardware or screw-tip penetration beyond the bone cortex may cause excessive wear of an adjacent tendon ( Fig. 2.15 ). Ultrasound is helpful in this diagnosis because artifact from metal hardware does not obscure overlying soft tissues. In addition, dynamic imaging with joint movement or muscle contraction can determine whether a tendon is in contact with metal hardware with specific positions ( ).

Bone Injury
The normal osseous surfaces are smooth and echogenic with posterior shadowing and possibly reverberation when imaged perpendicular to the sound beam. The hallmark of an acute fracture is discontinuity of the bone cortex with possible step-off deformity ( Fig. 2.16 ). Adjacent mixed echogenicity hemorrhage may also be present. A stress fracture, for example involving a metatarsal, may initially appear as an abnormal focal hypoechoic area adjacent to bone, which may progress to fracture step-off deformity or hyperechoic callus formation (see Fig. 8.145 ). This is typically associated with point tenderness induced by pressure from the transducer. A patient also commonly indicates focal pain in the area. At the completion of any ultrasound examination a focused evaluation at location of symptoms often reveals underlying pathology that may not be otherwise evaluated.

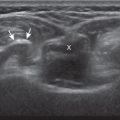
Other types of bone injuries involve avulsion at tendon and ligament attachments. In these situations, a small fragment of bone with variable shadowing is seen attached to the involved tendon or ligament (see Fig. 8.140 ). Asymmetrical widening and irregularity of an open growth plate with adjacent hypoechogenicity and point tenderness can indicate a physeal injury ( Fig. 2.17 ). While ultrasound is sensitive in the identification of abnormalities involving the surfaces of bone, the findings are often not specific for one diagnosis. When cortical irregularity is identified at ultrasound, true bone injury must be differentiated from other etiologies such as osteophytes. This differentiation is possible because osteophytes occur at margins of synovial joints usually without point tenderness, whereas a fracture shows a cortical step-off deformity. Correlation with radiography should always be considered to assist with this differentiation.

In many situations in which a fracture is identified at ultrasound, the fracture is unsuspected. The indication for the examination is often to evaluate a soft tissue or joint abnormality after a “negative” radiograph. This is not uncommon in the foot and ankle, where multiple overlapping osseous structures may make radiographic diagnosis of fracture difficult. The other situation is the greater tuberosity fracture of the proximal humerus, which can be overlooked at radiography because of suboptimal patient positioning or suboptimal radiographic technique (see Fig. 3.103 ). It has been shown that ultrasound is more effective than radiography in the diagnosis of rib fracture (see Fig. 2.16A ). As a fracture begins to heal, early hypoechoic callus becomes hyperechoic hard callus, which can eventually bridge the fracture gap or step-off deformity. This can also be applied to limb-lengthening procedures, in which ultrasound can detect new bone prior to being seen at radiography. Ultrasound has also been shown to be effective in diagnosis of tibial fracture nonunion with static interlocked nail placement; ultrasound can detect healing before radiography, whereas visualization of the hyperechoic nail indicates no overlying callus formation ( Fig. 2.18 ). Another advantage of ultrasound is in the evaluation of nonossified structures, such as the distal humeral epiphyses in children and the anterior costocartilage.

Infection
The imaging appearances of soft tissue infection are largely predicted by the route of infection spread. For example, in adults, infection commonly occurs through a puncture wound or skin ulcer. This produces infection of the soft tissues or cellulitis, which may have several appearances ( Fig. 2.19 ). Acutely, cellulitis appears as hyperechoic and thickened subcutaneous tissue. Later, hypoechoic or anechoic branching channels are visualized, with distortion of the soft tissues and possibly increased flow on color or power Doppler imaging. Such branching channels can coalesce as purulent fluid and can progress to frank abscess, where ultrasound-guided aspiration may be of benefit. However, ultrasound-guided aspiration may be less effective in the setting of methicillin-resistant Staphylococcus aureus infection. When evaluating for cellulitis, the findings of anechoic perifascial fluid and gas (appearing as hyperechoic foci with comet-tail artifact or dirty shadowing) at the deep fascia can indicate necrotizing fasciitis. The differential diagnosis for ultrasound findings of hyperechoic subcutaneous fat, as seen with acute cellulitis, includes fat necrosis ( Fig. 2.20 ); however, the latter condition is usually more focal, may be multiple, and is without physical examination findings of infection.


The ultrasound appearance of abscess is variable ( Fig. 2.21 ) but commonly appears as well-defined hypoechoic heterogeneous fluid collection with posterior through-transmission and peripheral hyperemia on color or power Doppler imaging. A thick hyperechoic and hyperemic wall may also be seen, as may soft tissue gas. Uncommonly, an abscess may be isoechoic or hyperechoic relative to the adjacent soft tissues ( Fig. 2.21D ). In this situation, in which it may be difficult to identify an abscess, increased through-transmission and swirling of echoes within the abscess with transducer pressure are helpful features to indicate the presence of a fluid component ( and ). Increasing the depth and field of view around a possible abscess will often make the increased through-transmission more conspicuous relative to the surrounding tissues.


Some infections occur after surgery and may be located immediately adjacent to metal hardware (see Fig. 2.21E ). Ultrasound is ideal for evaluation in this situation because the reverberation artifact from the hardware occurs deep to the metal and does not obscure the overlying soft tissues. Soft tissue infection may also involve a bursa, which can produce complex fluid and synovitis, and possibly gas, which appears hyperechoic with comet-tail artifact ( Fig. 2.22 ; ). Unlike a nonspecific abscess, a bursal fluid collection tends to be more defined and, more importantly, occurs where bursae reside. If an area of soft tissue infection is identified adjacent to bone, then osteomyelitis should be considered ( Fig. 2.23 ). In the presence of cortical irregularity resulting from erosions or destruction, osteomyelitis is likely, although confirmation with magnetic resonance imaging (MRI) is typically required to fully assess the extent of infection.


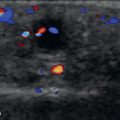
Another route of infection is hematogenous, which may manifest as a muscle abscess, septic arthritis, or osteomyelitis. This mode of infection is more common in children, intravenous drug abusers, or patients with sepsis. In the correct clinical scenario, septic arthritis is suspected when there is fluid distention of a joint recess, which may range from anechoic to hyperechoic, with possible hypoechoic or isoechoic synovial hypertrophy (see later in this chapter). The echogenicity of fluid or the presence of flow on color or power Doppler imaging cannot predict the presence of infection, and therefore ultrasound-guided percutaneous fluid aspiration should be considered if there is concern for infection. When distention of a joint recess is not anechoic, the possibility of complex fluid versus synovial hypertrophy must be considered. To help in this distinction, compressibility of the recess, redistribution of the contents with joint positions, and lack of internal flow on color Doppler imaging suggest complex fluid rather than synovial hypertrophy. It is often difficult to predict if fluid is amenable to aspiration in this setting so ultrasound-guided aspiration should always be considered if any joint recess distention is present when there is concern for infection, with possible lavage and aspiration if fluid is not initially aspirated. Joint aspiration can utilize ultrasound guidance to target the joint recess and avoid overlying cellulitis. If using fluoroscopy for guidance, ultrasound should be considered to evaluate the soft tissues for pathology thereby avoiding theoretical contamination of a sterile joint if a needle were passed through an abscess or infected bursa. When synovial hypertrophy related to a septic joint is present, discontinuity or irregularity of the adjacent bone cortex suggests erosions and possible osteomyelitis ( Fig. 2.24 ). Joint inflammation and synovitis from infection are indistinguishable from other inflammatory conditions, such as rheumatoid arthritis. In children, hematogenous spread of infection may also directly infect the bone. In this situation, a subperiosteal abscess may be identified because the periosteum is loosely adherent in children when compared with adults ( Fig. 2.25 ).


Arthritis
The foregoing descriptions relate to infection of soft tissues and bone. However, inflammation may have noninfective causes. Other inflammatory conditions, such as rheumatoid arthritis, can produce joint findings (effusion, synovial hypertrophy, and erosions), which can resemble infection. Often, the distribution of the abnormalities and the clinical history assist with the differential diagnosis. Infection more commonly causes abnormalities at one site, and this diagnosis must be excluded before considering single-site involvement of a systemic inflammatory arthritis. The following represents general concepts of some inflammatory conditions with additional examples and text found in later chapters.
Rheumatoid Arthritis
The characteristic features of rheumatoid arthritis at ultrasound include synovial hypertrophy and erosions. Ultrasound can be used for early diagnosis, assessment of response to therapy, and can guide injections or aspirations. Synovial hypertrophy appears as hypoechoic ( Figs. 2.26 and 2.27 ) or, less commonly, isoechoic or hyperechoic relative to subdermal fat, poorly compressible tissue within a joint or a joint recess. Synovial hypertrophy may also involve other synovial spaces, such as a bursa or tendon sheath ( Fig. 2.28 ). Flow may be seen on color or power Doppler imaging, depending on the inflammatory activity of the synovitis. When assessing for hyperemia of synovial hypertrophy, transducer pressure should be minimized to avoid occluding or dampening flow ( Fig. 2.29 ; ). Synovial hypertrophy may be seen in the dorsal recesses of the wrist, the volar and dorsal recesses of the metacarpophalangeal and interphalangeal joints of the hand, and the metatarsophalangeal and interphalangeal joints of the feet. In the diagnosis of synovial hypertrophy related to rheumatoid arthritis, both ultrasound and MRI perform similarly. However, minimal synovial hypertrophy is not specific for one disease and is often seen in normal asymptomatic wrists. Erosions appear as discontinuity of the bone cortex seen in two orthogonal planes as seen with ultrasound ( Fig. 2.30 ). Such erosions begin in the marginal regions of a joint, where the bone cortex is not covered with hyaline cartilage and is directly exposed to joint inflammation. Ultrasound is sensitive to bone cortex abnormalities but is not specific for erosions, with a reported false-positive rate of 29% for diagnosis of true erosions. The finding of synovial hypertrophy directly over a cortical irregularity also increases the likelihood that an erosion is present. Correlation with radiographic and clinical findings remains important, in addition to the distribution of imaging findings. For example, rheumatoid arthritis commonly involves the metacarpophalangeal joints of the hands (especially the second), the metatarsophalangeal joints of the feet (usually at least the fifth), and the wrist joints (especially the distal ulna). A rheumatoid nodule typically appears as a hypoechoic nodule at ultrasound ( Fig. 2.31 ).


Related posts:

Stay updated, free articles. Join our Telegram channel

Full access? Get Clinical Tree


