Chapter 1 Basic Principles of Ultrasound
Overview
Nature has long recognized and appreciated the perceptual gift of echolocation, which manifests in the biologic marvels of bats and whales, creatures that use echoes to map space in darkness and deep water, areas where sight is uninformative. The ability possessed by these creatures to experience the world directly through echolocation will always remain foreign to humans. We cannot replicate the vocal, auditory, and particularly the cortical adaptations required for this type of experience, so we must settle for a surrogate, which is the use of reflected sound energy to manufacture a visual representation of anatomic space. For an in-depth discussion of echolocation and other unique sensory experiences in nonhuman mammals, Howard Hughes’ award winning book Sensory Exotica is highly recommended.1
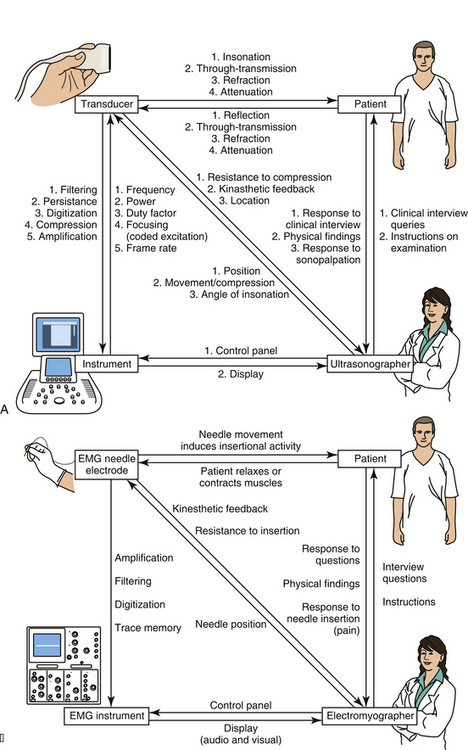
Almost everyone who is using this textbook will have already had some experience with ultrasound, but even for the experienced ultrasonographer, it is helpful to begin with a review of instrumentation as a means of explaining how an ultrasound image is created. The discussion begins with a description of how to get started generating images with an instrument, followed by discussions of the transducer and its elements, the behavior of sound and echoes in human tissue, and how the ultrasound instrument regulates the transducer and translates echoes into an image. In parallel with these descriptions are some brief comparisons of ultrasound with electrodiagnostic technology. Neuromuscular pathology is largely corroborated, not by other imaging modalities, but by electrodiagnostic findings, so an appreciation of this technology is of value. Further, many readers have considerable experience with electrodiagnosis, and this will help them appreciate the mechanics of ultrasound. There are also some parallel discussions on the nature of human perception and how that also determines display characteristics of ultrasound instrumentation (Fig. 1.1).
Getting Started: Obtaining an Image
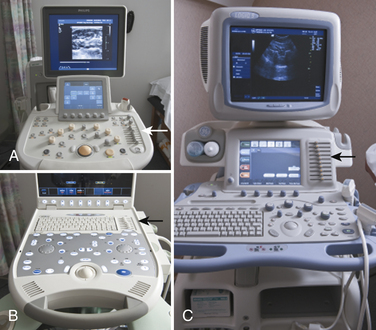
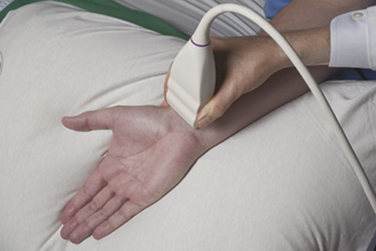
Ultrasound instruments have an impressive array of switches, dials, and buttons that can be daunting to the novice (Fig. 1.2). Even finding the on/off button to the instrument, which is invariably in a covert location to avoid inadvertent deactivation, adds to the challenge. Once the instrument is turned on, however, users quickly find that the instrument is quite intuitive and can be quickly put to use. The first step is to identify the active transducer on the instrument and then to coat it with coupling gel. It can then be placed over the wrist as shown in Figure 1.3. Note that every linear array transducer has a marking on one side, which corresponds to a marking on the display screen. The marking on the display should always be in the upper left corner of the screen, and the probe should be positioned such that the marker on the probe is pointed cephalad to the patient for sagittal imaging and to the ultrasonographer’s left side for cross-sectional imaging. This will produce images that are oriented in the same fashion as computed tomography (CT) or magnetic resonance imaging (MRI). However, it should be noted that this convention has not been routinely followed in neuromuscular imaging, so not all of the older images in this text are oriented in this fashion. In particular, sagittal imaging of the median nerve at the wrist frequently has been depicted in the opposite fashion in the literature, with the left side of the display screening showing the distal portion of the wrist, but that is an undesirable orientation, based on ultrasound convention, and should be avoided.2 See Box 1.1 for other general considerations when performing neuromuscular ultrasound.
Box 1.1 General Considerations for Neuromuscular Ultrasound
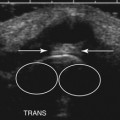
When imaging the wrist, the base of the palm should rest comfortably on the patient’s forearm or other supported structure. An image of the contents of the carpal tunnel, and possibly the radial and/or ulnar artery should appear. The width of the image corresponds to the footprint of a linear probe (Fig. 1.4) or the radial angles of the probe if it is curved (see Fig. 4.2 and Fig 4.14). The coupling gel, in addition to enhancing sound penetration, allows the probe to slide left or right or distal or proximal to find the optimal image of the tissue in the neighborhood of the initial contact of the probe. The probe can also, with slight pressure, be angled proximally or distally. In general, structures are viewed with the probe perpendicular to the skin surface, but angular adjustments are of considerable interest as is discussed later. No more pressure than necessary should be used to scan; excessive pressure may deform structures of interest and can be tiring to the ultrasonographer and uncomfortable for the patient (Fig. 1.5). To help others orient to an image, it can help to include a recognizable landmark as well (vascular bifurcation, bone edge, etc.).
Several simple adjustments can be made to change the display once the desired image is obtained. One knob on the ultrasound instrument panel adjusts the depth of the field of view.3 The depth should be sufficient to encompass the structure(s) of interest. The display screen is calibrated to indicate depth and serves as a useful reference in images for publication (see Fig. 1.4). The zoom feature of an instrument allows the user to focus in on the detail of interest, expanding it to encompass the screen with a slight improvement in resolution. Unlike MRI and CT, which are designed to automatically record standard body slices, ultrasound requires the operator to scan using multiple probe positions and angles and operating controls to capture the most informative two-dimensional (2D) images for documentation. Greater depth of field (low magnification) and zoom (higher magnification) are analogous to lens power on a microscope—lower magnification is useful for orientation and screening for abnormalities, and higher magnification is used to capture the essence of the pathologic change. If the pathology is diffuse, lower magnification (greater depth of field, as in the case of diffuse muscle pathology) may be preferred.
The brightness of the image can be controlled by the power and gain dials on the instrument.3 The power dial controls the amount of sound energy transmitted to the tissue and the gain dial the amplification of the sound echoes that return. These dials have similar but not identical functions and need to be set to optimally display the structures of interest. The dials have an analogy with photography: The power dial in this case controls the strength of the flash, and the gain dial in essence controls the film speed (with faster, e.g., more sensitive, film speeds being equivalent to increased gain). In electrodiagnosis, the power dial controls stimulus intensity4, and gain is used to display the amplitude of the nerve conduction study response. In both ultrasound and electrodiagnosis, excessive intensities do little to enhance the outcomes of the study.
The focal zone, typically indicated by horizontal marker(s) on the display screen, helps with resolution.3 The level of focal zones (which are horizontal) should encompass the structures of interest (Fig. 1.6). The freeze button on the instrument will stop the real-time action of the machine and display a single frame. Most instruments store (in an adjustable fashion) several seconds of data at any given time, so it is possible, once an image is frozen, to rewind slowly through multiple previous frames to capture the optimal image for storage. Of interest, the rewind and replay features of ultrasound instruments have been an industry standard for many years, yet this simple function has only recently become available on electromyography (EMG) instruments. Any frozen image can be saved for later viewing, and a variety of postprocessing capabilities for analysis and labeling are present on many instruments as well.
The Transducer
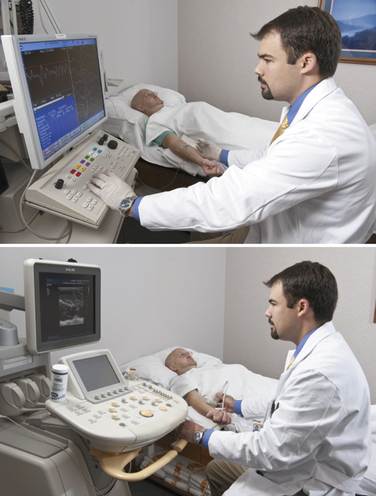
Piezoelectric elements convert electrical energy into a pulse of sound wave energy and then converts the resulting sound wave echoes back into electrical energy.3 An array of piezoelectrical elements creates the sound energy needed to generate echoes, and the electrical signals elicited by their return to the probe characterizes the remarkable function.of the ultrasound transducer—the device placed on the skin to deliver and receive sound pulses. It is helpful to contrast an ultrasound transducer with the contact elements used in electrodiagnosis. EMG and nerve conduction studies (NCS) electrodes are of much simpler construction because they record and carry electrical signals without the need of converting to a different type of energy. For nerve conduction studies, there is a pair of electrodes for delivering electrical energy and a pair for recording it.4 These electrodes consist of exposed metal in rings, disks, or needles (Fig. 1.7). Once electrical signals are obtained, either directly in electrodiagnostic instruments, or indirectly with an ultrasound transducer, the signals are filtered and amplified by the respective instrument to generate a display for interpretation. At this point, both instruments convert electrical energy into light energy to create an image. In electrodiagnosis the display is of a single point of constant intensity that varies in vertical displacement (amplitude) over time, whereas in ultrasound the image is a 2D sea of points that vary in brightness over time. In EMG there is conversion of the display into sound energy as well. Sound is typically part of the display in ultrasound only with Doppler blood flow studies. As would be expected from their more complex design elements, ultrasound transducers are significantly more expensive and more fragile than electrodiagnostic electrodes.
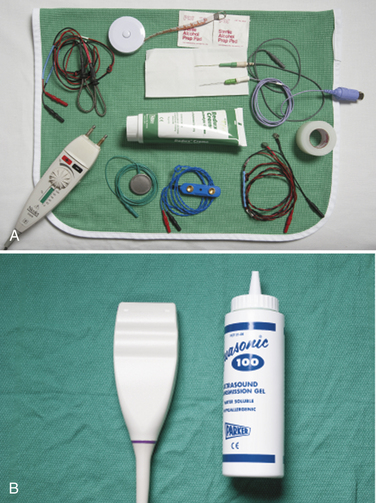
EMG textbooks often devote several pages to describing the unique features of EMG electrodes because subtle differences in structure can lead to minor, but argued over, differences in recording characteristics (see Fig. 1.7).4 With ultrasonography the function of the transducer is more complex than a simple recording electrode and intimately linked to the instrument, so ultrasonographers tend to fixate less on the predictable consequences of minor design variations and more on figuring out the best way to create an optimal image with the technology at hand. The following discussion of transducers serves to highlight their limitations and possibilities in evaluating patients with neuromuscular disease.
Compound Structure
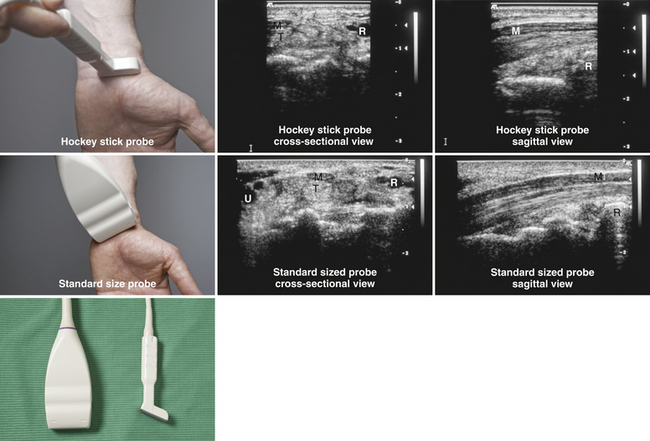
An ultrasound probe actually contains an array of multiple tiny component piezoelectric transducers each providing a single line of ultrasound data (Fig. 1.8). By seamlessly stitching together each of these lines of data, the display creates a 2D image in the same way that old television screens created images from parallel lines of display.3 Ultrasound transducers come in many shapes. When using ultrasound to study the heart it helps to have a curved surface so that when the probe is placed against the ribs, it is able to scan a larger tissue area through a narrow aperture.2 Internal probes for vaginal, rectal, and esophageal imaging have shapes that conform to the anatomic requirements of their use.3 At the greatest extreme, intravascular ultrasound probes can be used to examine arterial walls.5 All involve different arrays of transducers or a motorized transducer or set of transducers. For neuromuscular imaging, the most commonly used probe is a linear array probe because most imaging planes are compatible with this shape. A hockey stick probe, which is a linear probe with a smaller footprint and extended handle, is sometimes useful for imaging around bony surfaces, such as the medial epicondyle.
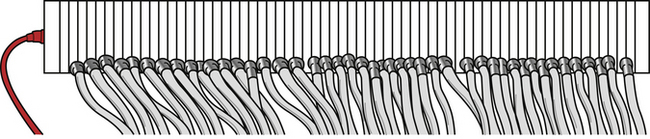
Fig. 1.8 A drawing of an ultrasound transducer that has had the impedance matching material and cover removed. Note the multiple transducer elements, each with its own electrical contact. The thickness of the ultrasound power cord (see Fig. 1.7) reflects the fact that most transducers need wiring for hundreds of elements.
Miniaturization with Piezoelectricity
The critical principle underlying ultrasound transducers is piezoelectricity, a property inherent in different types of special materials.3 This phenomenon was first described in quartz crystals. Whereas noncrystalline quartz contains a disordered arrangement of silicon dioxide molecules, quartz crystals have an orderly lattice that is determined by the electrostatic charges of the individual molecules, which incidentally have an asymmetric polar configuration. Application of a current across this lattice leads to absorption of energy, changes in electron orbits, and consequently shape changes in the underlying crystal (Fig. 1.9). This abrupt dimensional change creates a sound pulse. The application of mechanical stress to a quartz crystal, in a reverse fashion, causes an electrical current, making this material ideal for use in phonograph pickup needles or ultrasound transducers.
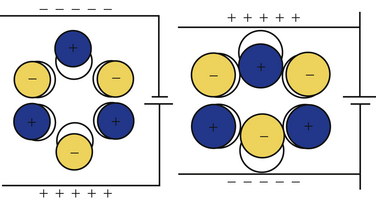
Currently, lead zirconate titanate,3 a piezoelectric ceramic, is used for ultrasound transducers. Although this chemical is not naturally piezoelectric, when it is heated to more than approximately 350° C in an electromagnetic field, the molecules can quickly be induced to assume a dipole-driven lattice that confers piezoelectric properties. When cooled, the application of a voltage across this material causes it to thicken or thin as the suspended molecules turn their dipoles toward or away from the electrostatic charge. This shape change, in a small wafer of material, generates the sound pulses used in modern ultrasound transducer probes. These small wafers can be arrayed in a linear fashion, each with its own separate wiring, to create the typical ultrasound transducer.
The Transducer Shell
The casing of the ultrasound probe holds a number of elements including the individual transducers, the wiring to these transducers, and several layers of material.3 Note that the cable that connects the transducer to the instrument is quite thick (see Fig. 1.4) because it contains both inputs and outputs to the hundreds of miniature transducers that make up a typical linear array transducer. Damping material is placed at the base of the transducer to help control the duration of the sound pulses emitted by the probe. Shorter sound pulses are associated with better resolution. Piano strings use dampers to enhance a staccato effect of a key strike; when these are raised by engaging the sostenuto pedal, the string vibration is prolonged, causing sounds and notes to slur together. As such, the damper material enhances the discrimination provided by pulsed sound.
Between the contact face of the probe and the underlying transducer array, matching layers are inserted.3 These help reduce the impedance mismatch of the transducer and the skin, a phenomenon further aided by the use of coupling gel. These steps enhance through-transmission of sound into the body, and without these steps more than 80% of the sound would be reflected back to the transducer at the skin surface. A more detailed discussion of acoustic impedance matching can be found elsewhere.6
Sound Pulse Technology
At its simplest, echolocation involves a single sound pulse, followed by an evaluation of the timing and intensity of any returning echoes.1 Bats use their vocal cords to emit short pulses of sound to create echoes. Humans, ill-equipped for this task, can shout into a deep well and infer from the delay of the sound return something about its depth, and by the quality of the sound something about the reflecting materials in the well. If there are smooth stone sides and a water reservoir at the bottom, a sharp crisp echo will return. If instead moss covers the walls and leaves coat the bottom, a muffled softer sound will be heard.
Ultrasound relies also on single sound pulses to create an echo trace.3 The sound is produced by the transducer element, the sound penetrates soft tissues, and as the sound passes through the body, tissue interfaces at different levels create multiple echoes of different intensities. At each interface, some sound is reflected and some is transmitted. The echoes return at different times to the transducer element, which converts them to a trace signal. The latencies of the echoes provide information about spatial relations (depth of the reflective surface), and the intensity of the echoes provides information about the types of reflecting surfaces.
Humans primarily use sight to map space, and this is why ultrasound data are displayed as an image. Most vision is based on a source that bathes a scene with a constant flow of light energy, such as the sun or a light bulb. This contrasts with ultrasound, which maps space with pulsed sound; its equivalent would be a fast-pulsing strobe light. An echo is a reflection of an entire sound pulse, so the shorter the pulse, the less likely an echo will return during the pulse itself, and the less likely that early and late components of sequential pulses will interfere with each other.3 Typically a B-mode ultrasound pulse is 2 to 3 cycles of sound energy in duration, and at 10 MHz, this takes about 0.2 to 0.3 μs. Of interest, bat calls are of much longer duration: 0.2 to 100 μs, but their calls cover much greater distances, perhaps 50 meters or more. Appropriately, call duration shortens, improving localization, as a bat approaches a target of culinary interest, such as a moth.
Ultrasound transducers emit many pulses of sound per second, which constitutes the pulse repetition frequency.3 It can be thought of as similar to the frame rate on a video camera, and it is of importance in determining the temporal resolution in an image. Duty factor is a term that calculates the percentage of time the transducer is actually emitting pulses, which is substantially shorter than the time it spends receiving echoes. The total energy emitted by a transducer correlates directly with the duty factor and determines certain physical effects such as tissue heating.
Sound: Fundamental Principles and Its Behavior in Tissue
Speed of Sound
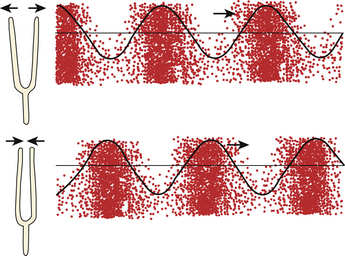
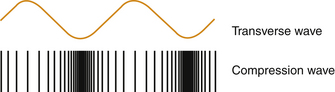
Sound is a traveling pressure wave. Unlike an ocean wave, in which the direction of the amplitude (vertical) is out of plane with the direction of travel (horizontal), sound waves consist of alternating compressions and rarefactions of molecules in the medium through which it travels (Fig. 1.10). Such changes can be measured by pressure, density, or particle vibration, all of which can be considered acoustic variables.3 As with any wave, sound has intrinsic detectable wavelengths, periods, and frequencies, all of which are interrelated. The speed of sound propagation, however, is not a property of the type of sound energy, but rather of the medium of transmission. Sound propagation speed is related to stiffness of a tissue, or more precisely, hardness. As such, it travels slowly in easily compressed gases, more rapidly in fluids and body tissues, and fastest in solids. An intuitive sense of sound propagation is readily derived from experience with a Slinky, a toy originally constructed of a wound coil of flexible metal (Fig. 1.11). Mechanical energy creates standing waves of alternating rarefactions and compressions of successive spirals of the coil; these waves travel faster if the coil is tightly wound with harder metal. Tightly wound Slinky toys travel down steps faster than less tightly wound and looser versions (e.g., plastic).
The variation of sound propagation in different materials is of significance both generally and clinically. An approaching train can be detected sooner by putting one’s ear to the rail than by listening through air for the sound it makes. On average, sound travels about four times faster through metal than through human soft tissue, which is minimally faster than through sea water, and in turn about four times faster than in air. The hardest substance known to man, diamond, also conducts sound the fastest at 12,000 m/s (Table 1.1).
Table 1.1 Speed of Sounds in Different Substances
| Material | Velocity (m/s) |
|---|---|
| Air | 331 |
| Fat | 1450 |
| Water (50° C) | 1540 |
| Human soft tissue | 1540 |
| Brain | 1541 |
| Liver | 1549 |
| Kidney | 1561 |
| Blood | 1570 |
| Muscle | 1585 |
| Lens of eye | 1620 |
| Tendon | 1650 |
| Ice | 3152 |
| Skull bone | 4080 |
| Brass | 4490 |
| Aluminum | 6400 |
| Diamond | 12,000 |
Ultrasound Range Finding
A key goal of ultrasound is an accurate representation of spatial characteristics of human tissues. To measure depth (range), ultrasound relies on the timing of the return echoes.3 As mentioned above, ultrasound makes a number of assumptions to calculate depth. It assumes that sound travels in a straight line from the transducer to the target and back, that enough echoes are reflected back to the transducer from relevant tissue structures to be captured and measured, and that the speed of sound in soft tissue is sufficiently consistent across tissues to generate an accurate measurement. In general these observations hold true, and particularly for the more superficial structures studied in neuromuscular ultrasound. In a fashion similar to an F-wave when performing electrodiagnostic studies,4 an echo reflects a round trip of sound from the transducer to the structure of interest, and back again to the transducer. All ultrasound instruments assume that sound travels through tissues at a constant rate of 1540 m/s, and images from echoes are constructed based on this calculation. It may be easier to understand this number expressed differently: for each centimeter of depth, the average round trip travel time for an echo in human soft tissue is 13 μs.3
The width on an ultrasound image represents the summed thickness of the individual transducer elements within a linear ultrasound probe (see Figs. 1.4 and 1.8).3 In some ways width measures in tissue may be slightly more accurate than depth measurements in that they do not assume constant sound speed in tissue. However, because width measures do not take refraction of sound into account, there can be distortion of width as sound passes through tissue layers of different sound transmission speeds, if these are oblique to the angle of insonation (see oblique echoes later).
For practical purposes, the variation of sound speed is rarely important. However, if someone is measuring the depth to the sacrum in two patients, one with minimal body fat and one with 7.5 cm of fat over the gluteus maximus (not unusual in obese patients as measured by EMG needle length), there would be a subtle effect. Ultrasound travels slower through fat than through the “average” human tissue, and as such, ultrasound tends to overestimate the thickness of a fat layer by about 6% (1541/1450), and underestimate the thickness of muscle by about 3% (1541/1585) (see Table 1.1).
It would be tempting to speculate that the speed of sound in nerves would be somewhat less than that of average human tissue because of its high fat content, but at this time this value is unknown. However, the speed of ultrasound in brain is 1541 m/s, and most nerves are sufficiently thin as to make any special adjustments for size moot. Special techniques, using ultrasound radiofrequency analysis for measuring body tissue and fat thickness may be of value for addressing questions of this type.7
Related posts:
Stay updated, free articles. Join our Telegram channel

Full access? Get Clinical Tree


