BENIGN AND MALIGNANT EPITHELIAL TUMORS: LESIONS OF CUTANEOUS (SKIN) ORIGIN
KEY POINTS
- Skin cancer is usually not life threatening but can be if more advanced lesions are not evaluated properly before definitive treatment plans are chosen.
- Imaging contributes most in these patients by showing the local extent of tumor, especially with regard to bone invasion, detecting and quantifying perineural spread, and to a lesser extent looking for regional lymph node spread.
The vast majority of all skin carcinoma occurs in the head and neck region. Sun exposure is the major etiologic factor. There is a lower incidence in dark-skinned races compared to those with lighter complexions.1,2 The rate of occurrence and aggressiveness of skin cancer increases in immune-compromised patients. Toxic exposures and hereditary disorders can also predispose patients to this risk.
The critical anatomy in evaluating skin cancer relates the skin to the subcutaneous fat and that deeper fat beneath the superficial musculoaponeurotic system (SMAS) of the face. The SMAS is the facial equivalent of the superficial fascia in the neck. The fat deep to the SMAS and its relationship to the neurovascular bundles of the face is critical knowledge for evaluating imaging studies of patients with advanced skin cancer. The relationships are particularly important with reference to the distal branches of the facial nerve and all three divisions of the trigeminal nerve, as discussed in Chapter 21. The more proximal course of V1, V2, and V3, as well as that of the facial nerve, must also be completely understood to assure the best medical decision making (Figs. 21.9, 21.10, 21.50–21.52, and 24.1–24.9).
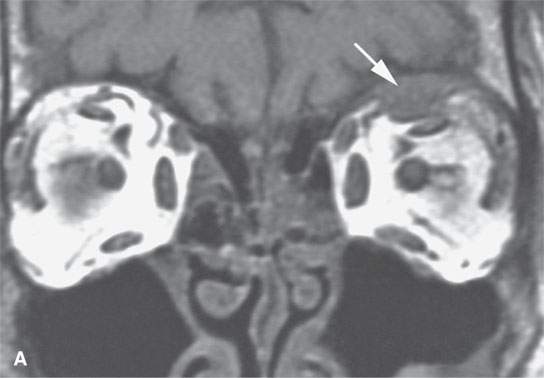
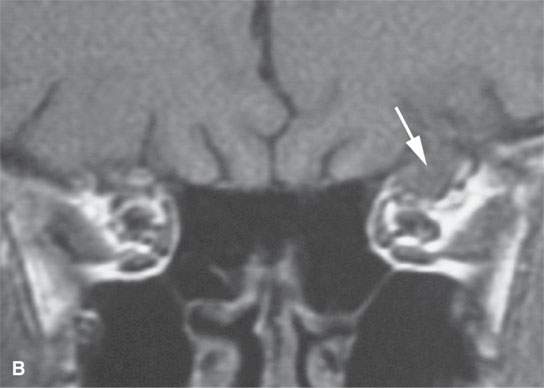
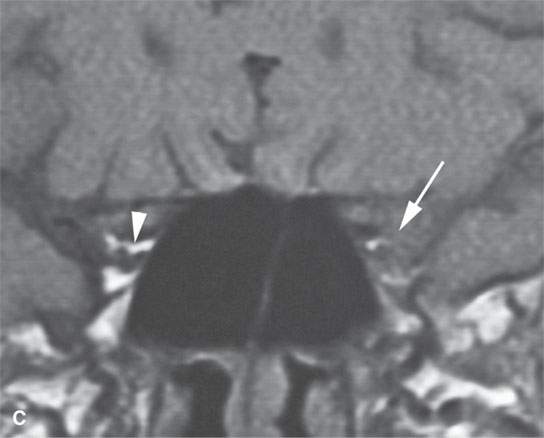
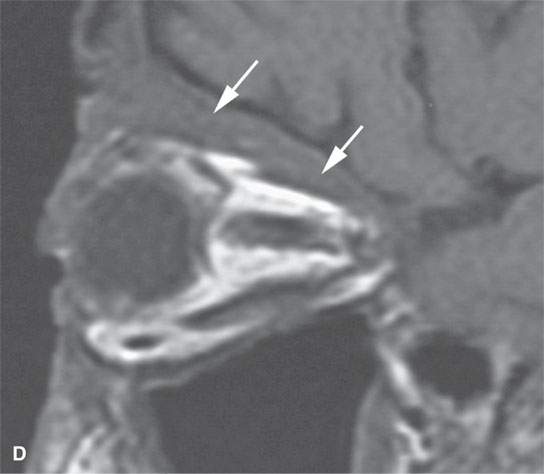
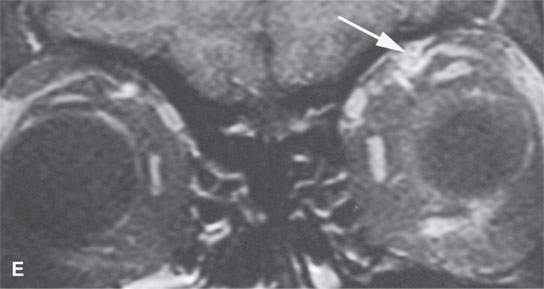
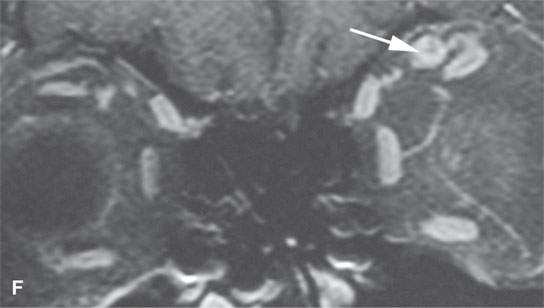
FIGURE 24.1. Magnetic resonance imaging of a patient with perineural spread of forehead squamous cell carcinoma along the first division of the trigeminal nerve to the orbital apex and superior orbital fissure. A–D: Non–contrast-enhanced T1-weighted (T1W) images show the typical location of such spread superior and medial in the orbit along the supratrochlear and supraorbital neurovascular bundles. D—F: Contrast-enhanced T1W fat-suppressed images.
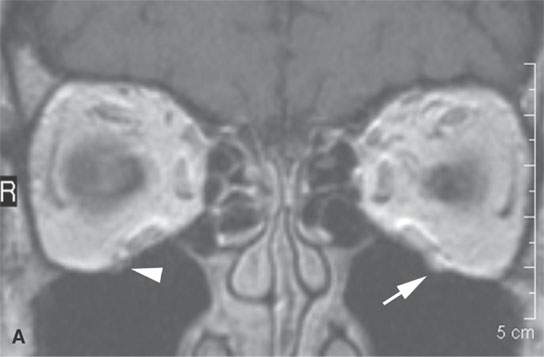
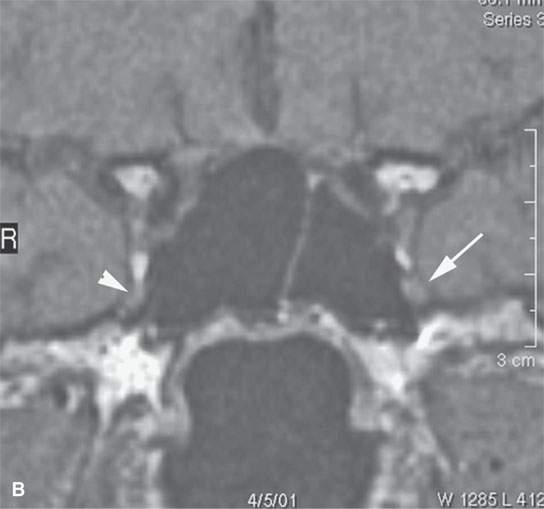
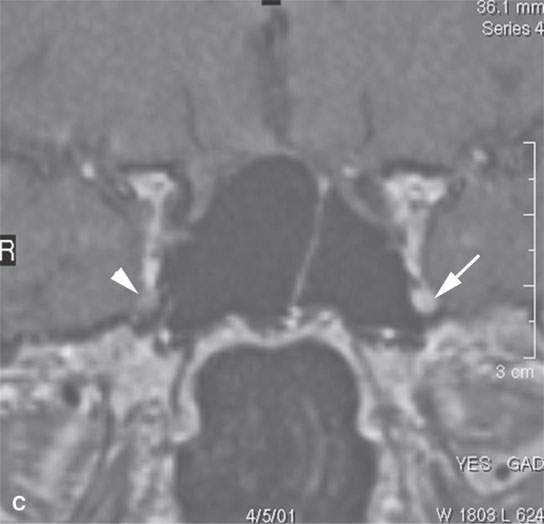
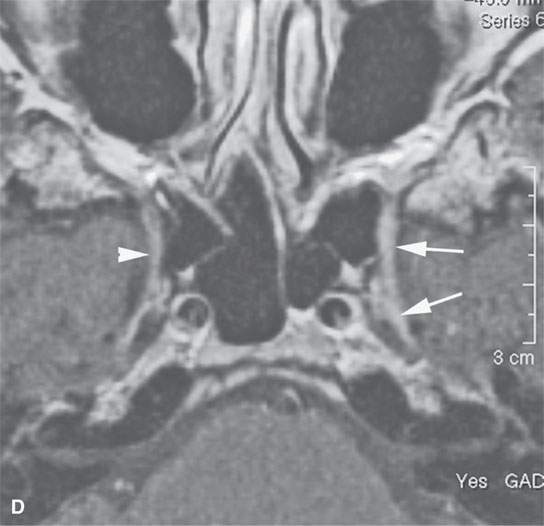
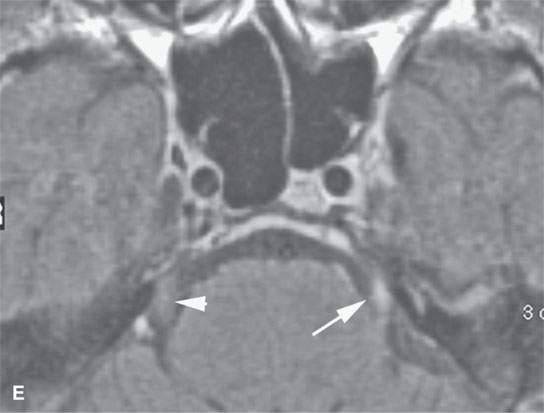
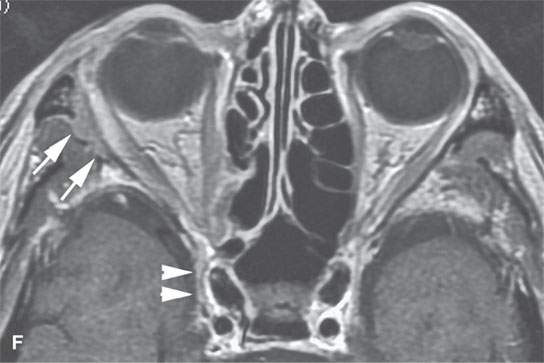
FIGURE 24.2. Contrast-enhanced T1-weighted (T1W) magnetic resonance imaging (MRI) of a patient with perineural spread of squamous cell carcinoma (SCCA) of the nasolabial fold region along the second division of the trigeminal nerve to the trigeminal nerve cisternal segment; the involved nerve is enlarged and enhances abnormally (arrows) compared to the normal nerve (arrowheads) in all of its segments (A–E). F: Contrast-enhanced T1W MRI of another patient with perineural spread of facial skin SCCA along the frontozygomatic branch of V2 (arrows) and the foramen rotundum (arrowheads).
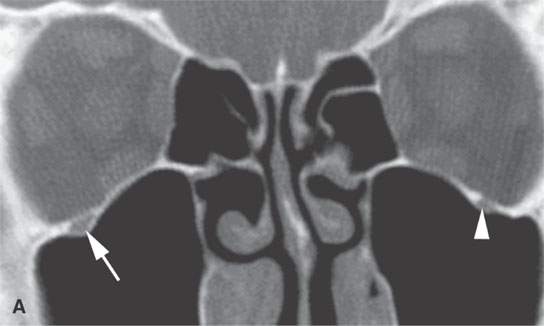
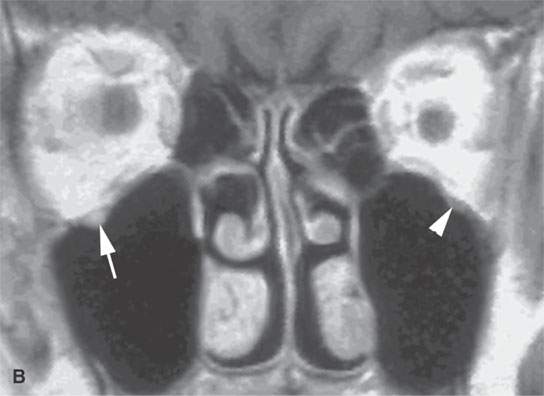
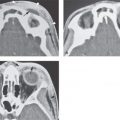
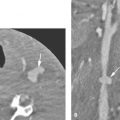
FIGURE 24.3. A patient with squamous cell carcinoma of the cheek spread along V2 and limited to the infraorbital canal. The disease was controlled with radiotherapy that spared the eye. A: Computed tomography showing the slightly enlarged bony infraorbital canal (arrow) compared to the normal side (arrowhead). B: Contrast-enhanced T1-weighte image showing V2 to be enlarged and abnormally enhancing (arrows) compared to the normal side (arrowheads).
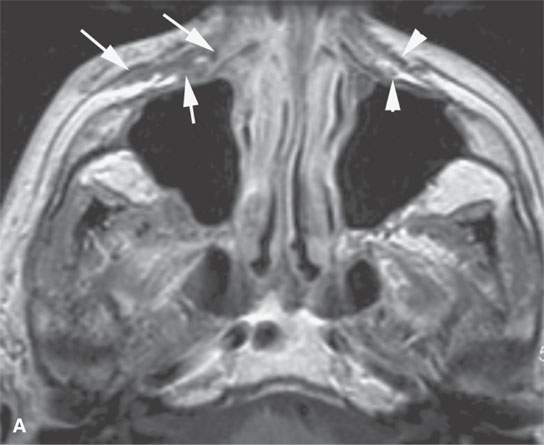
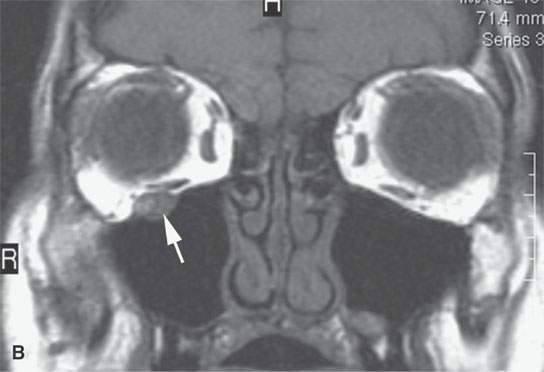
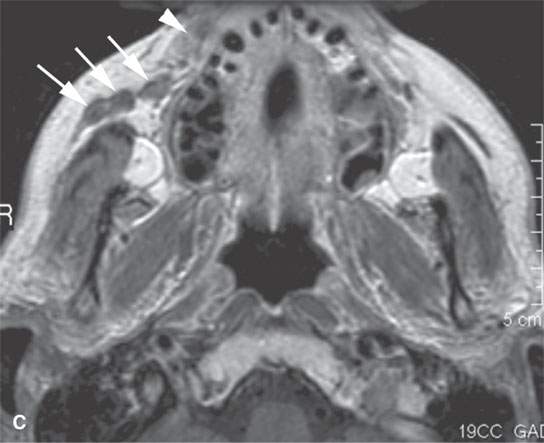
FIGURE 24.4. Contrast-enhanced T1-weighted images in a patient with squamous cell carcinoma spread of the cheek along V2 and the buccal branch of the facial nerve. A: There is thickening along and deep to the superficial musculoaponeurotic system (SMAS) (arrows) and enlargement of the distal branches of the infraorbital nerve deep to the SMAS (arrows) compared to the normal side (arrowheads). B: The infraorbital nerve is enlarged and enhances abnormally (arrow). C: There is thickening of the SMAS along the upper lip (arrowhead) and nodular enlargement of the distal branches of the buccal branch of the facial nerve (arrows) compared to the normal side.
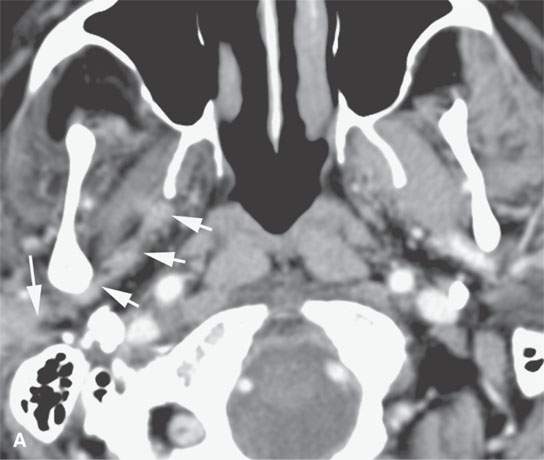
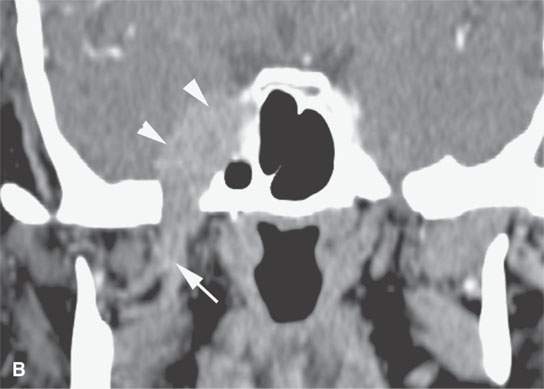
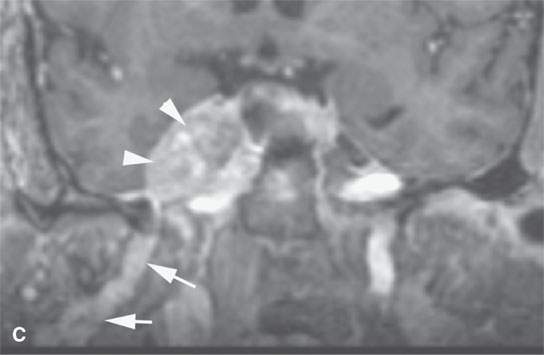
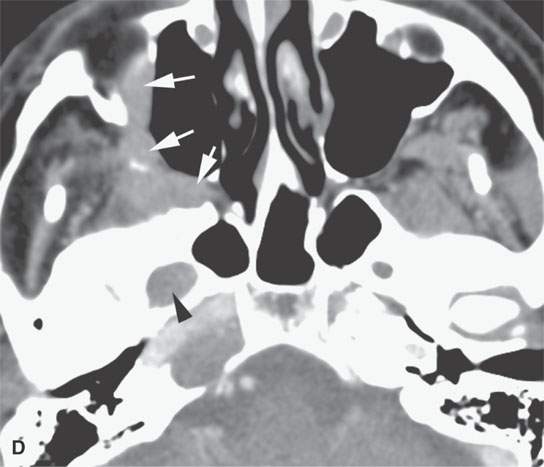
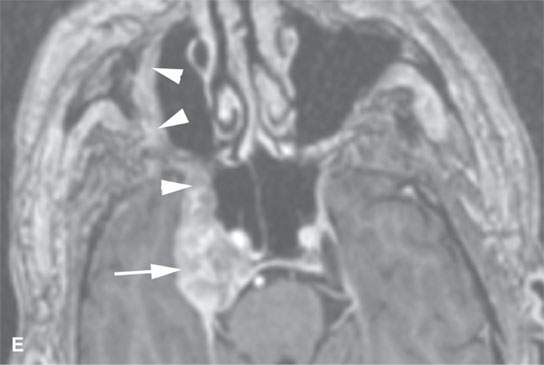
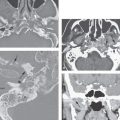
FIGURE 24.5. A patient with melanoma of the periauricular region spread along V3 to the trigeminal ganglion proximally. A: Contrast-enhanced computed tomography (CT) showing spread from the auriculotemporal nerve (arrow) to V3 (arrowheads). B: Continued spread from the main trunk of V3 in the masticator space (arrow) to the trigeminal cistern (arrowheads). C: Contrast-enhanced T1-weighted (T1W) magnetic resonance (MR) showing trigeminal cistern involvement (arrowheads) from V3 spread (arrows) to correlate with CT in (B). D: Anterograde spread from the trigeminal ganglion to the pterygopalatine fossa and infraorbital nerve (arrows) as well as foramen ovale enlargement (arrowhead). E: Contrast-enhanced T1W MR showing trigeminal cistern involvement (arrow) with anterograde V2 spread (arrowheads).
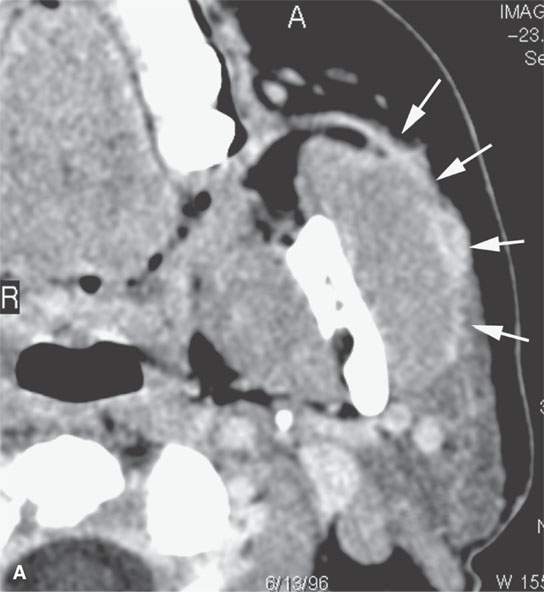
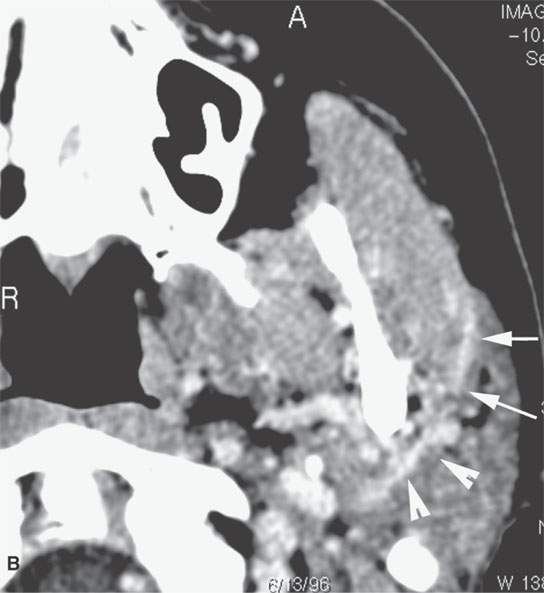
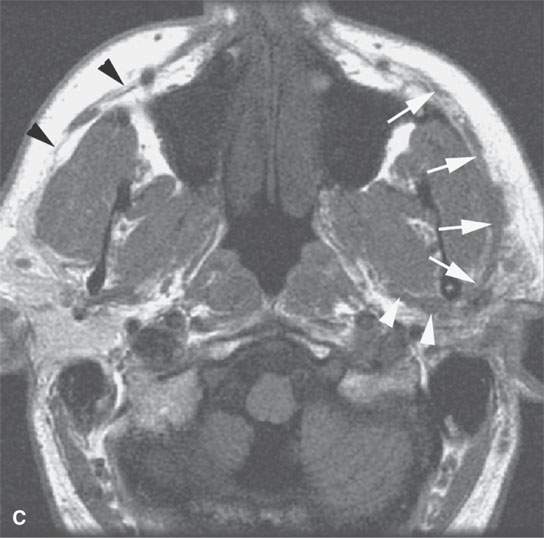
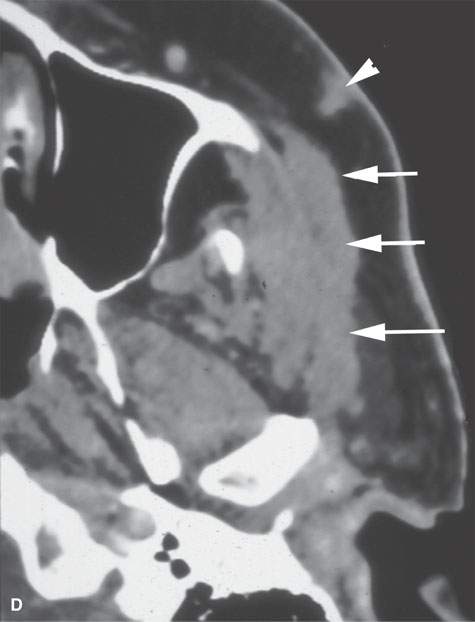
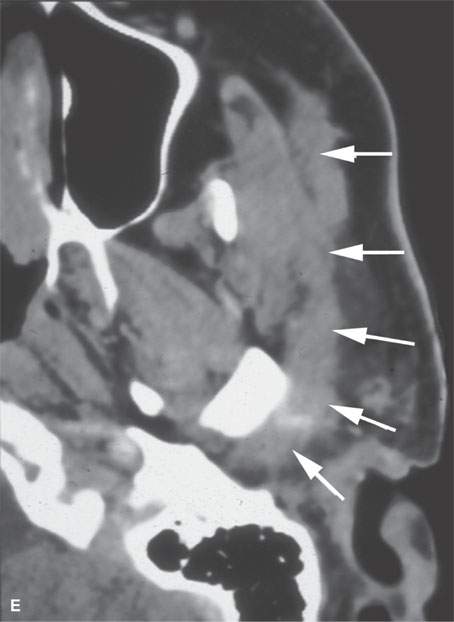
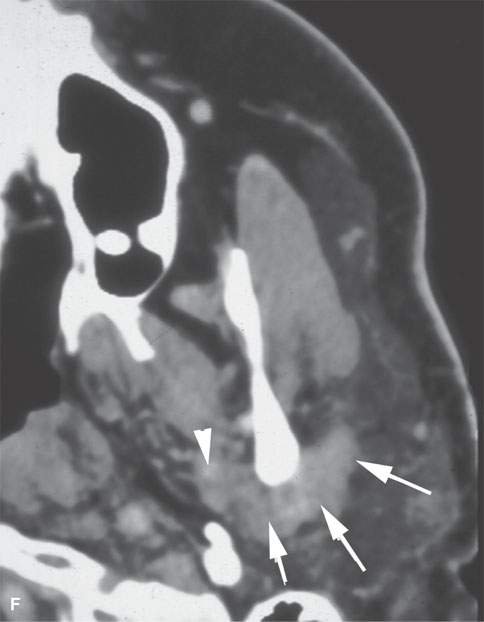
FIGURE 24.6. Patient with squamous cell carcinoma (SCCA) of the cheek with slow onset of peripheral facial nerve palsy. A, B: Contrast-enhanced computed tomography (CECT) showing tumor causing enlargement and an abnormal enhancement of the buccal division of the facial nerve back to the main trunk (arrows) in (A) with continuation (B) to the main trunk of the facial nerve (arrowheads). C: T1-weighted image for correlation with (A) and (B) and comparison of normal anatomy on the right where the SMAS is not denervated and infiltrated (black arrowheads). D–F: Patient who “picked off” a SCCA of the cheek and presented about 2 years later with slow onset of peripheral facial nerve palsy.CECT showing a subcutaneous nodule of residual tumor (D) with perineural tumor causing gross enlargement of the zygomatic division of the facial nerve back to the main trunk (arrows) in (D) with continuation (E) to the main trunk of the facial nerve (arrows) and in (F) growth along the auriculotemporal nerve to its junction with V3 in the masticator space (arrowheads).
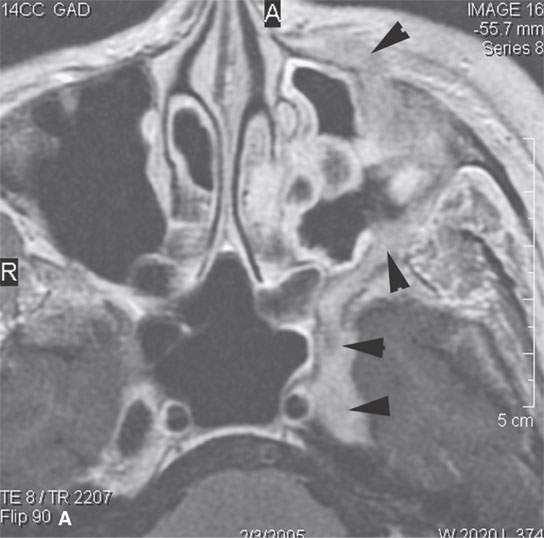
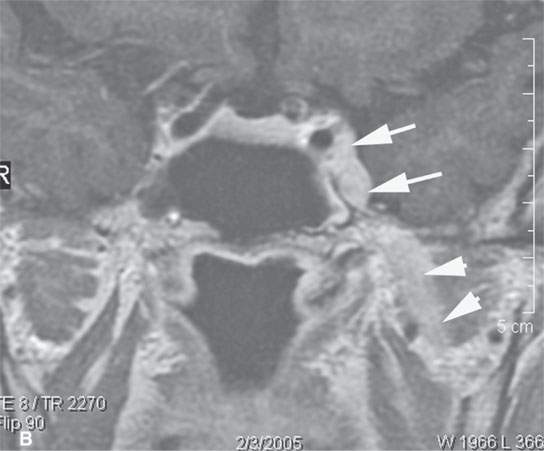
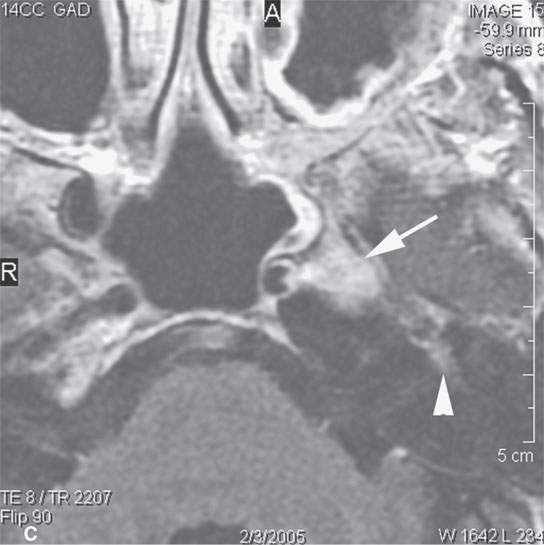
FIGURE 24.7. Contrast-enhanced T1-weighted magnetic resonance imaging of a patient with perineural spread of recurrent basal cell carcinoma of the nasolabial fold and cheek region along the second division of the trigeminal nerve to the trigeminal ganglion and cistern proximally, where it spreads to the first genu of the facial nerve via the petrosal nerve. The involved nerves are enlarged and enhance abnormally. A: Tumor infiltrates from the distal ramifications of the infraorbital nerve beneath the superficial musculoaponeurotic system to the trigeminal ganglion (arrowheadss). B: Tumor spreads anterograde from the ganglion and cistern (arrows) to V3 (arrowheads). C: Tumor spreads from the ganglion along the petrosal nerve (arrow) to the facial nerve anterior genu (arrowhead).
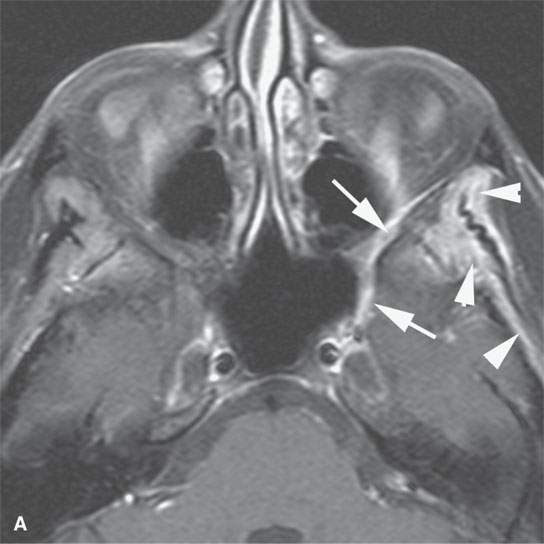
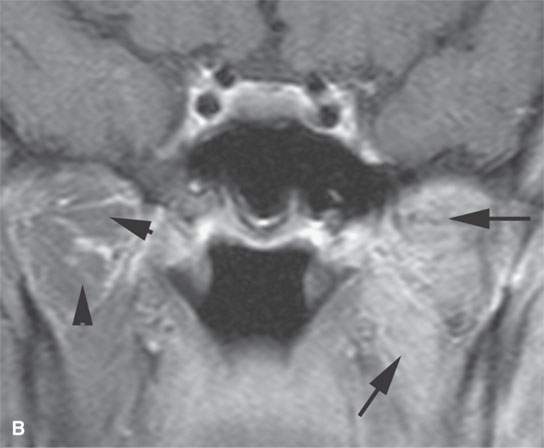
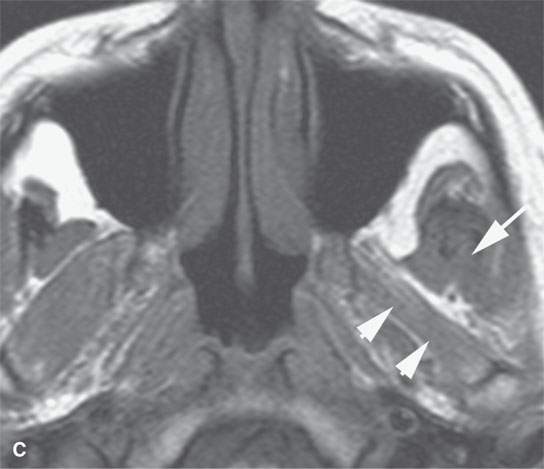
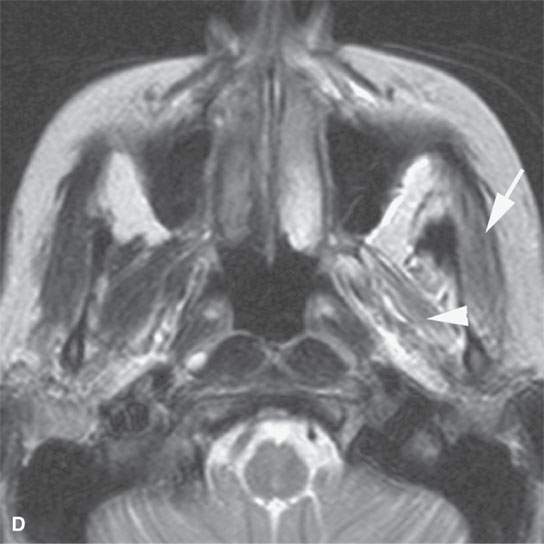
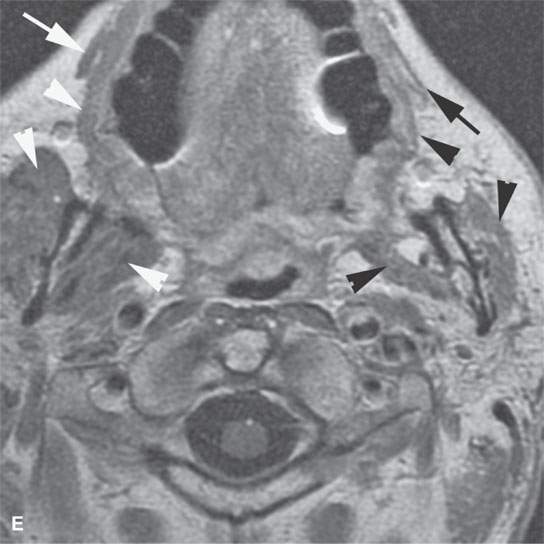
FIGURE 24.8. A patient with squamous cell carcinoma spread of the cheek along V2 illustrating secondary denervation atrophy of the muscles of mastication in a chronic active phase. A: Contrast-enhanced fat-suppressed T1-weighted (T1W) images showing the perineural V2 spread (arrows) and the enhancement of the denervated temporalis muscle. B: Contrast-enhanced fat-suppressed T1W images showing the enhancement of the denervated pterygoid muscles (arrows) compared to the normal muscle on the opposite side (arrowhead). C, D: Another patient showing more end-stage denervation atrophy, the pterygoid muscles (arrowheads) with diminished bulk, and some early fat replacement, while the temporalis muscle still appears somewhat swollen and edematous(arrow). E: T1-weighted contrast-enhanced MRI in a third patient showing the effects of both V3 and facial nerve perineural spread of cancer. The muscles of facial expression are atrophied on the left (black arrow) compared to the normal right side (white arrow) and the masseter and pterygoid muscle atrophic on the left (black arrowheads) compared to the normal right side (white arrowheads).
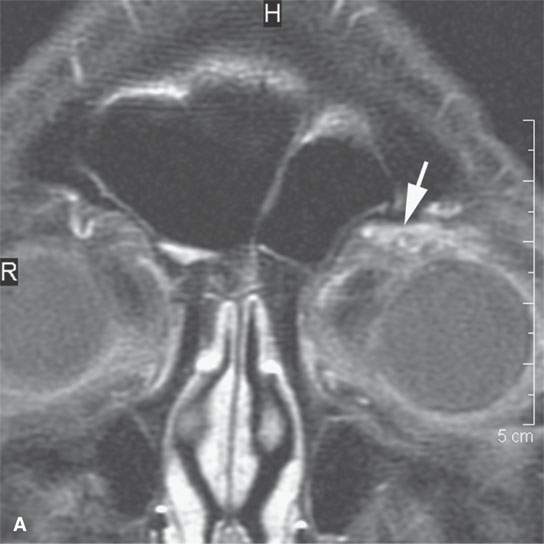
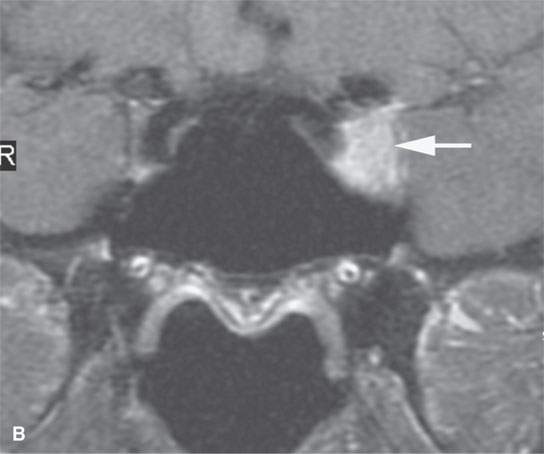
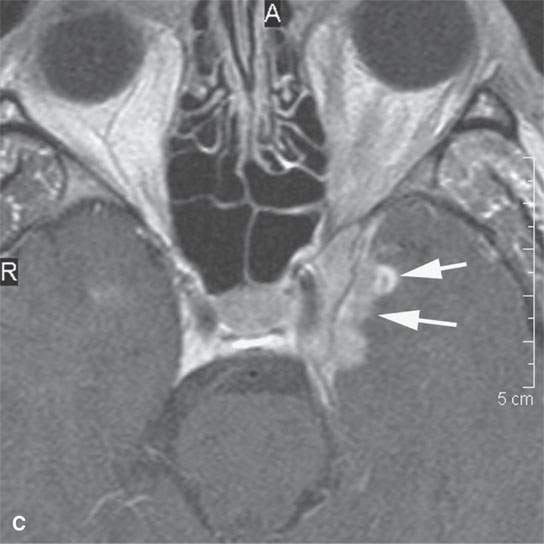
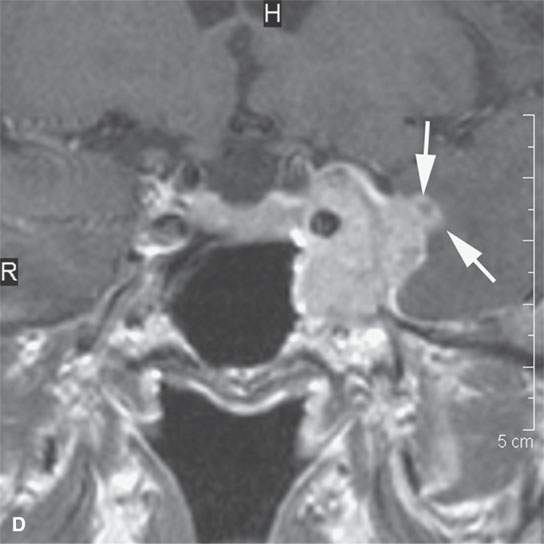
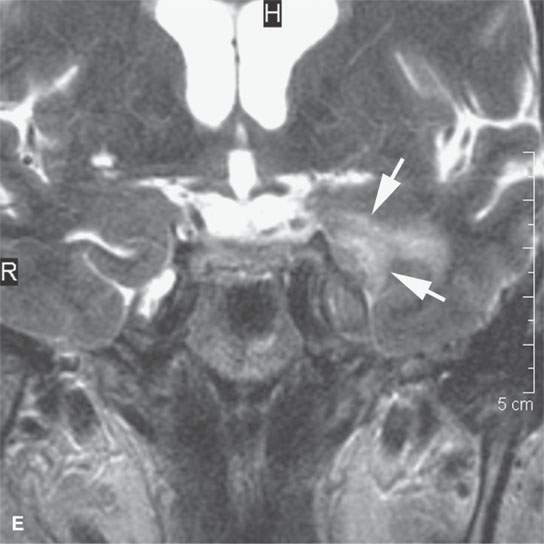
FIGURE 24.9. Magnetic resonance imaging of a patient with perineural spread of forehead squamous cell carcinoma along the first division of the trigeminal nerve to the trigeminal ganglion from which it invades adjacent brain Findings are indicated by arrows in each figure. A–D: Contrast-enhanced T1-weighted images show the typical location of such spread superior and medial in the orbit along the supratrochlear and supraorbital neurovascular bundles (A), disease at the orbital apex (B) and to the trigeminal ganglion and cistern (C, D), where it invades across the lateral dura of the cavernous sinus to invade the brain. E: The brain involvement is confirmed by the T2-weighted image showing brain edema.
The anatomy and physiology of lymphatic spread must also be completely understood to most effectively interpret images in patients with skin cancer (Figs. 24.10–24.14). The most superficial lymphatics in the skin are the valveless capillary channels of the dermis. Deeper dermal lymphatic trunks and subcutaneous trunks have valves. The primary lymph nodes for carcinomas of the scalp and face are levels 1A, 1B, 5, those of the parotid region, and the mastoid, occipital and posterior neck nodes, as discussed in Chapters 149 and 157. The less well known facial nodes are also at significant risk. Subsequent drainage of level 1 nodes to level 2 put levels 2, 3, and 4 at secondary risk.
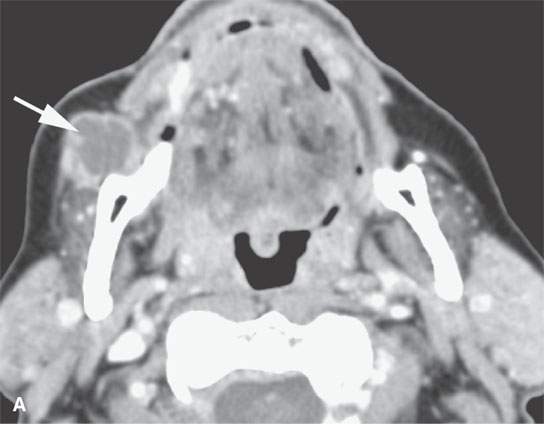
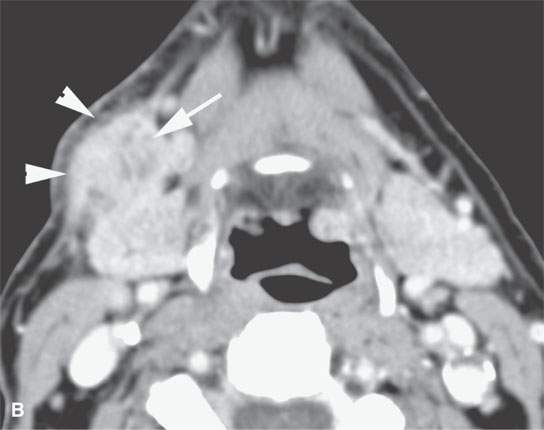
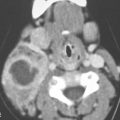
FIGURE 24.10. Contrast-enhanced computed tomography of a patient with squamous cell carcinoma of the cheek with metastatic mandibular node in the facial group (arrow in A) and more typical nodal involvement of a level 1B node (arrow in B) with extranodal spread across the superficial musculoaponeurotic system very likely involving the related mandibular division of the facial nerve.
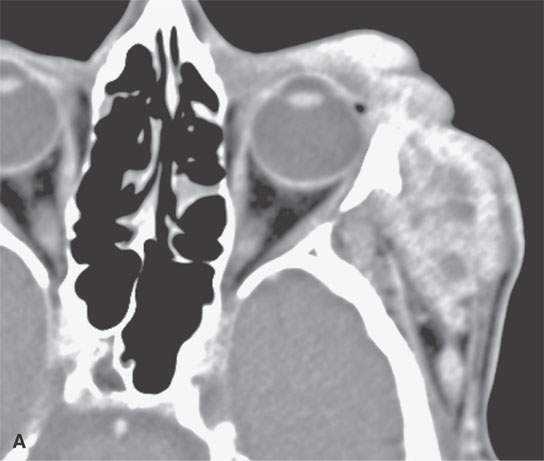
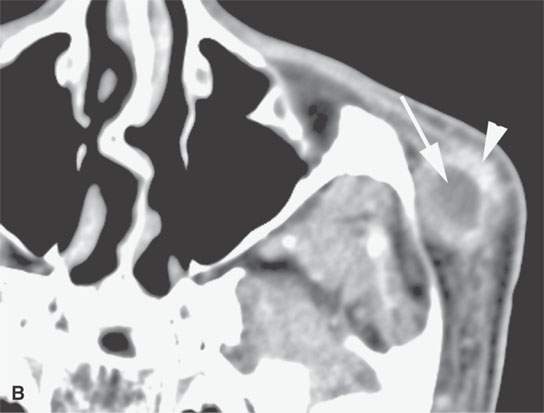
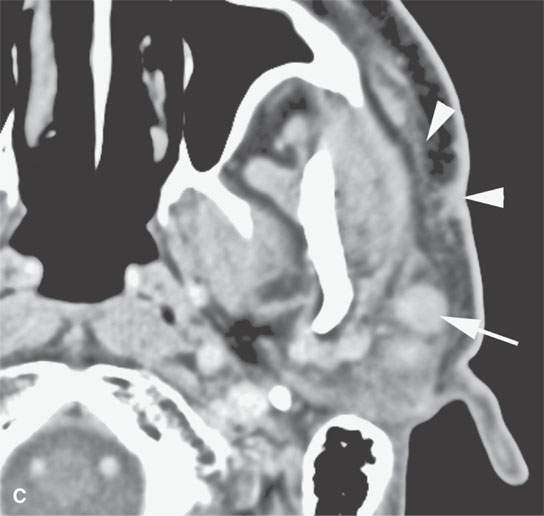
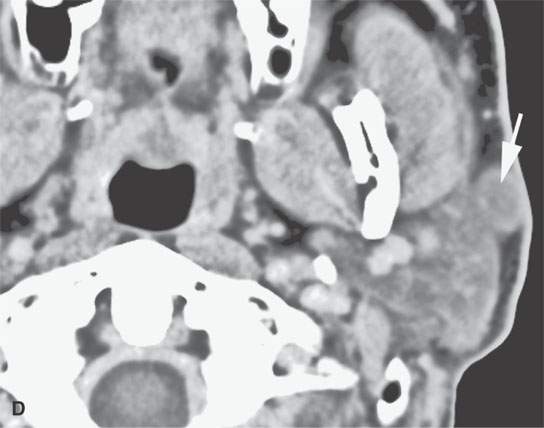
FIGURE 24.11. Contrast-enhanced computed tomography of a patient with extensively recurrent squamous cell carcinoma of the periorbital region (A) and in (B) a metastatic zygomatic node (arrow) of the facial group with early extranodal spread (arrowhead). C: There is also spread in the subcutaneous fat and along the superficial musculoaponeurotic system SMAS (arrowheads) suggestive of lymphatic obstruction with metastatic parotid nodes (arrows) both within (C) and outside (D) the gland.
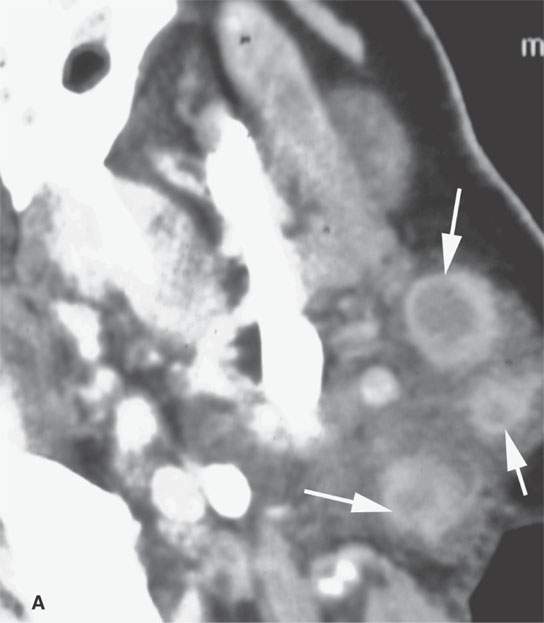
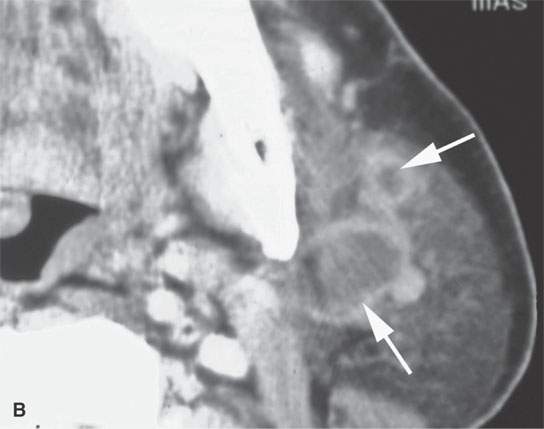
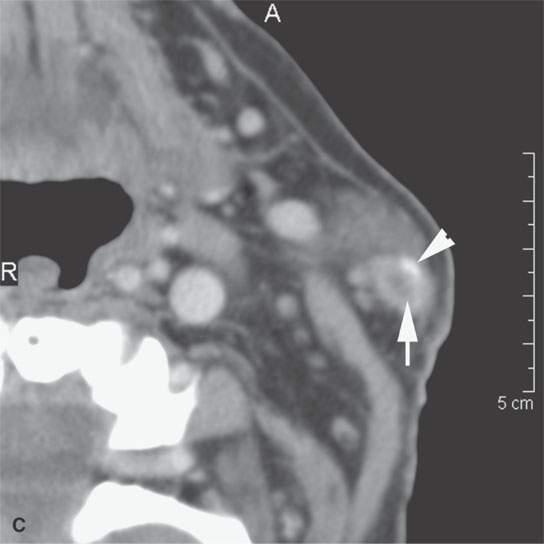
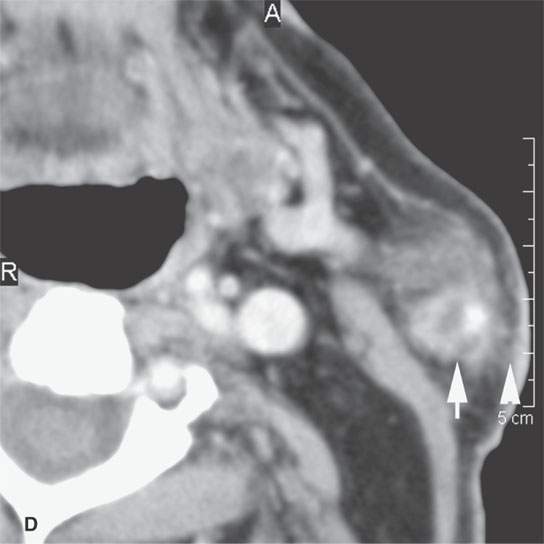
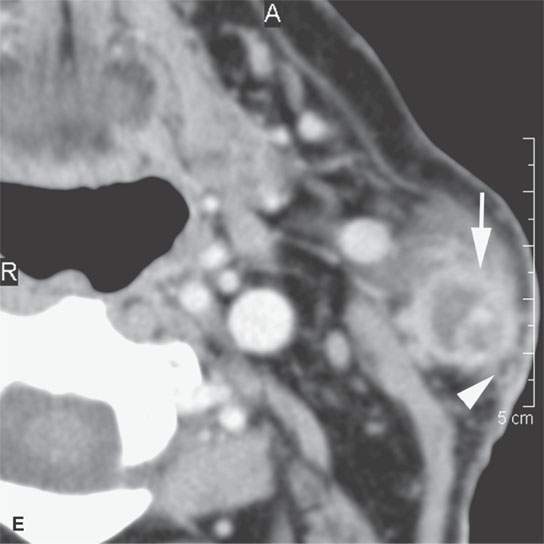
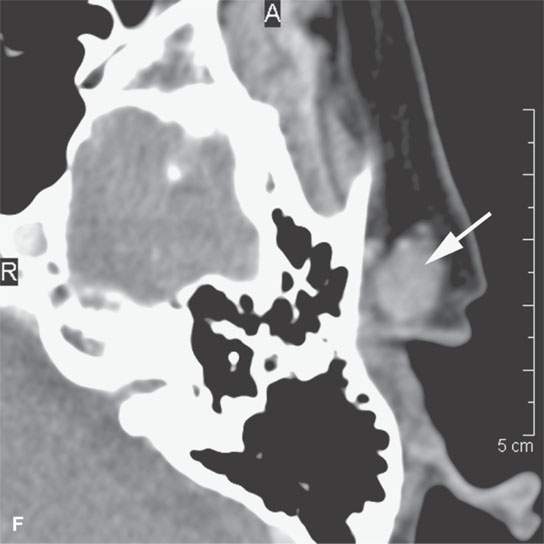
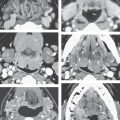
FIGURE 24.12. Contrast-enhanced computed tomography of a patient with squamous cell carcinoma of the temple region in a typical distribution of intra- and periparotid nodes (arrows) within the gland (A, B), at the tail of the gland (C, D), and in the pretragal region (E). Most of the nodes show focal metastatic defects (arrows) and evidence of extranodal spread (arrowheads).
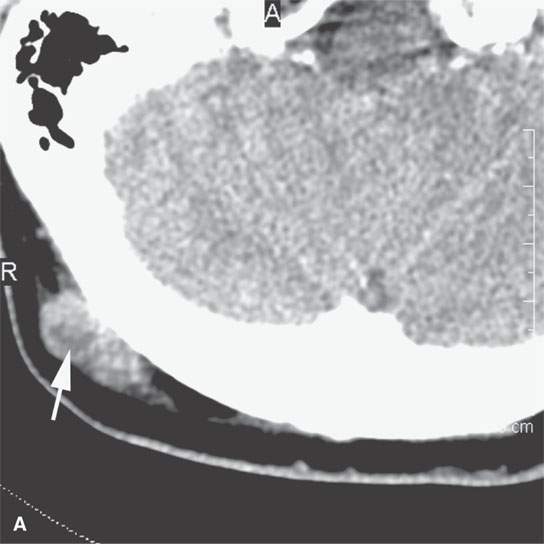
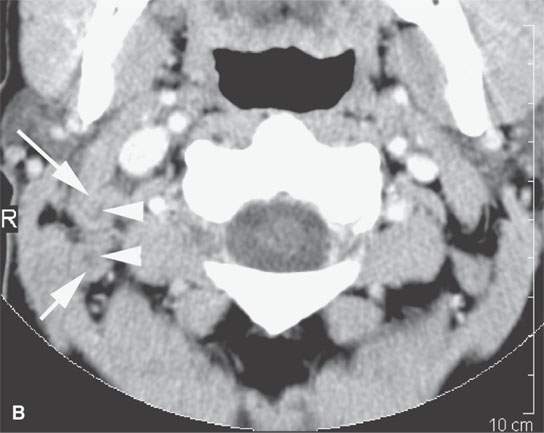

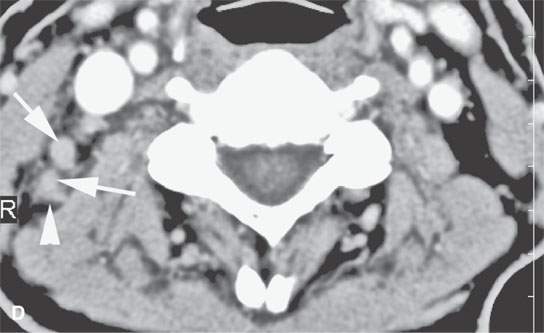
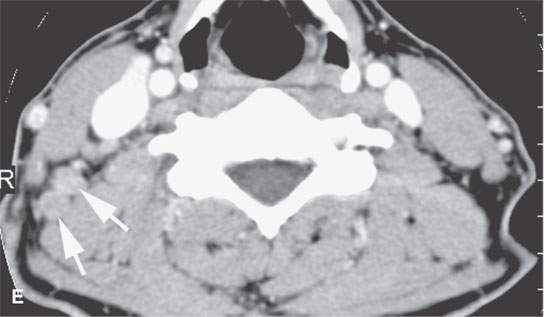
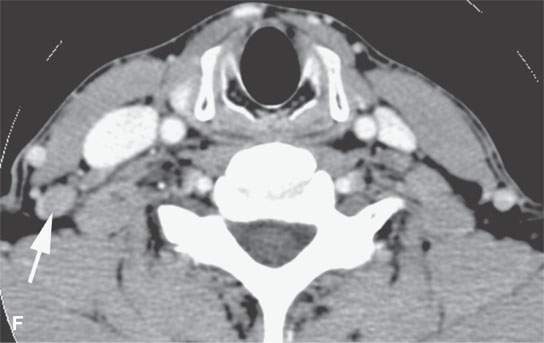
FIGURE 24.13. Contrast-enhanced computed tomography of a patient with squamous cell carcinoma of the posterior scalp region in a typical distribution for such a skin cancer. A: Posterior neck node (arrow) with an obvious focus of metastatic disease. B–F: Multiple abnormal nodes (arrows) clustering and some with focal (arrowheads) defects predominantly in the posterior triangle, including levels 2B, 3, 5A, and 5B.When this pattern is seen, a skin primary should be considered the most likely etiology. When a known primary is studied, the posterior neck group must be fully evaluated.
Related posts:
 Preseptal Compartment: Acute and Chronic Infections and Noninfectious Inflammatory Conditions
 Necrotizing (“Malignant”) Otitis Externa
 Cervicothoracic Junction: Brachial Plexus Trauma
 Oropharynx: Introduction
 Branchial Apparatus Developmental Anomalies
 Mandible and Maxilla: Odontogenic Tumors and Cysts
Stay updated, free articles. Join our Telegram channel

Full access? Get Clinical Tree


