Ruchi Kabra, Caroline Micallef, H. Rolf Jäger
Benign and Malignant Intracranial Tumours in Adults
Radiological Investigations in Intracranial Tumours
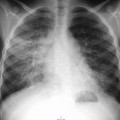
Plain radiographic findings in brain tumours are of historical interest and may show signs of raised intracranial pressure (such as erosion of the lamina dura of the dorsum sellae, or a ‘J-shaped’ sella), tumour calcification or enlargement of middle meningeal artery grooves in meningiomas.
Magnetic resonance imaging (MRI) is the preferred investigation for patients with suspected intracranial tumours. It provides a better soft-tissue differentiation and tumour delineation than CT and advanced MR imaging techniques, such as diffusion-weighted (DWI) and perfusion-weighted (PWI) imaging and MR spectroscopy (MRS), allow the assessment of physiological and metabolic processes.
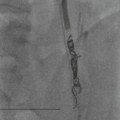
Intra-arterial angiography for brain tumours is now mostly performed in conjunction with preoperative or palliative tumour embolisations.
Computed Tomography
Most clinically symptomatic brain tumours are detectable on CT, by virtue of mass effect and/or altered attenuation. Intra-axial tumours are usually of low attenuation on non-enhanced CT images. Primary intracranial lymphoma is usually iso- to slightly hyperdense to the brain parenchyma. High attenuation areas within a tumour indicate tumour calcification or recent intratumoural haemorrhage. Tumours frequently exhibiting these two features are listed in Table 61-1.
Bone-window settings can reveal bone erosion or hyperostosis, associated with extra-axial tumours.
Contrast enhancement improves the visualisation of strongly enhancing mass lesions such as meningiomas, schwannomas, metastases and certain types of glial tumours.
CT perfusion has emerged as a technique to assess the relative cerebral blood volume (rCBV) and permeability changes in brain tumours.1 The newer 320-detector row CT system provides full brain coverage.2 CT perfusion has the advantage of a direct relationship between the CT attenuation coefficient and contrast material concentration in tissue.
Magnetic Resonance Imaging
Structural MRI
The MRI protocol for structural tumour imaging should include T2-weighted, fluid-attenuated recovery (FLAIR) sequence and T1-weighted images before and after injection of a gadolinium-based contrast medium.
Most tumours appear hypointense on T1 and hyperintense on T2 and FLAIR images. The latter provide a particularly good contrast between normal brain tissue and glial tumours and show signal loss in cystic tumour components.3 Highly cellular tumours such as lymphomas and primitive neuroectodermal tumours have decreased water content and therefore appear relatively hypointense on T2 images. Intratumoural haemorrhage or calcification is also hypointense on T2 images and becomes more conspicuous on T2* or susceptibility-weighted images (SWI) where magnetic susceptibility effects are stronger. Hyperintensities on T1 images can be due to haemorrhage, calcification, melanin (in metastatic melanomas) or fat.
Enhancement with gadolinium is seen in vascular extra-axial tumours such as meningiomas, and in intra-axial tumours which disrupt the blood–brain barrier. This is generally a feature of high-grade intra-axial tumours, but can also be present in certain low-grade tumours, such as pilocytic astrocytomas and WHO grade II oligodendrogliomas. The visibility of contrast enhancement on MR can be improved by doubling or tripling the gadolinium dose,4 or by using high relaxivity gadolinium compounds.5 Post-contrast FLAIR sequences are useful to assess leptomeningeal disease.
MR images may be acquired in an intraoperative setting where an MR imaging facility is available in an operating theatre environment. With tumours, in particular, images may be acquired during surgery, thus guiding the extent of lesion resection in near real time while preserving eloquent regions of the brain.
Advanced Physiological and Molecular Imaging Methods
DWI, PWI, MRS, functional MRI (fMRI) and positron emission tomography (PET) provide additional information about brain tumours which can be useful in specific clinical settings.
MR Perfusion Imaging
There are three main methods of PWI:
DSC is currently the most widely used perfusion technique in brain tumours. rCBV measurements derived from DSC correlate closely with angiographic and histological markers of tumour vascularity and the expression of vascular endothelial growth factor (VGEF).6 It provides an indirect measure of tumour neovascularity and high-grade glial tumours tend to have higher rCBV values than low-grade tumours.7 Leakiness of contrast agent into the extravascular space due to disruption of the blood–brain barrier can lead to inaccuracies of the rCBV calculations in DSC PWI, especially in high-grade tumours. Several mathematical models have been developed to correct for this problem which can also be minimised by administering an extra gadolinium dose prior to DSC PWI (‘preloading dose’).8
In DCE PWI, T1-weighted images are acquired beyond the duration of the first pass of the gadolinium bolus, typically for about 5 min. The shape of the time–signal intensity curve is influenced by tissue perfusion, vascular permeability and the extravascular-extracellular space. Several mathematical models can be used to quantify contrast leakage into the extravascular space as a measure of microvascular permeability. The most frequently used parameter is the transfer coefficient Ktrans which is influenced by endothelial permeability, vascular surface area and flow. DCE images can also be analysed using a model-free approach by looking at the slope of the time–signal intensity curve.9
ASL uses labelling of endogenous hydrogen to measure cerebral blood flow (rCBF).10 As hydrogen is freely diffusible and crosses the blood–brain barrier immediately, it is not possible to measure tissue blood volume in the same way as with DSC PWI where the tracer (gadolinium) stays (or is assumed to stay) predominantly in the intravascular compartment. Studies of brain tumours have demonstrated, however, a good correlation between rCBF measurements obtained with ASL and rCBV measurements derived from DSC PWI11 and the clinical use of ASL techniques in neuro-oncology is likely to increase.
MR Diffusion Imaging
DWI measures Brownian motion of water molecules within tissue. The apparent diffusion coefficient (ADC) describes the overall water diffusibility in tissue and is an indicator of disruption of tissue microstructure, cellular density and matrix composition in tumours. ADC measurements correlate inversely with the histological cell count of gliomas12 and positively with the presence of hydrophilic substances in the tumour matrix.13
There is increasing evidence that DWI using multiple (low and high) b values is helpful in brain tumours.14
Diffusion tensor imaging (DTI) provides additional information about the direction of water diffusion.15 The tendency of water to move in some directions more than others is called anisotropy and can be quantified using parameters such as fractional anisotropy (FA). Compact white matter tracts show normally a high degree of anisotropy that can be lost if they are infiltrated by tumour cells which destroy the ultrastructural boundaries formed by myelin sheaths.
Post-processing of DTI allows the depiction of important white matter tracts and their connections (tractography), which can be displayed in direction-encoded colour images. Tractography is useful in the preoperative assessment of brain tumours and helps to differentiate between displacement and infiltration of white matter tracts.16
MR Spectroscopy
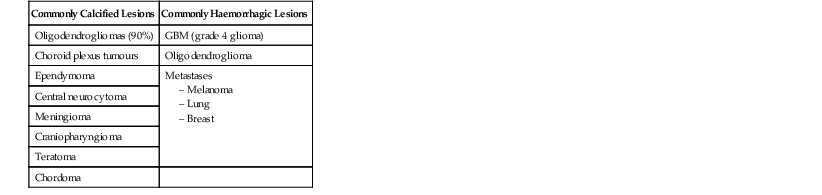
MRS analyses the biochemistry of a brain tumour and provides semiquantitative information about major metabolites.17,18 A common pattern in brain tumours is a decrease in N-acetylaspartate (NAA), a neuron-specific marker, and creatine (Cr), and an increase in choline (Cho), lactate (Lac) and lipids (L) (Fig. 61-1). The concentration of Cho is a reflection of the turnover of cell membranes (due to accelerated synthesis and destruction) and is more elevated in regions with a high neoplastic activity. Lactate (Lac) is the end product of non-oxidative glycolysis and a marker of hypoxia in tumour tissue. This is of interest, as tumour hypoxia is now recognised as a major promoter of tumour angiogenesis and invasion. Lac is probably associated with viable but hypoxic tissue, whereas mobile lipids is thought to reflect tissue necrosis with breakdown of cell membranes.
The choice of echo time (TE) is an important technical consideration for performing MRS. It can be short (20–40 ms), intermediate (135–144 ms) or long (270–288 ms). MRS with a short TE has the advantage of demonstrating additional metabolites which may improve tumour characterisation, such as myo-inositol, glutamate/glutamine (Glx) and lipids, but is hampered by baseline distortion and artefactual NAA peaks. Intermediate echo times have a better defined baseline and quantification of NAA and Cho is more accurate and reproducible. Long echo times lead to a decrease of signal to noise.
MRS is presently a sensitive but not very specific technique. Single voxel spectroscopy provides good-quality spectra but is prone to sampling errors. Chemical shift imaging (CSI) is technically more demanding but provides 2D or 3D spectra and larger area coverage. With 3T MRI systems it is now possible to obtain a 16 × 16 × 16 array of spectra with a voxel size of 1 cm3 in 5–10 min.19
fMRI
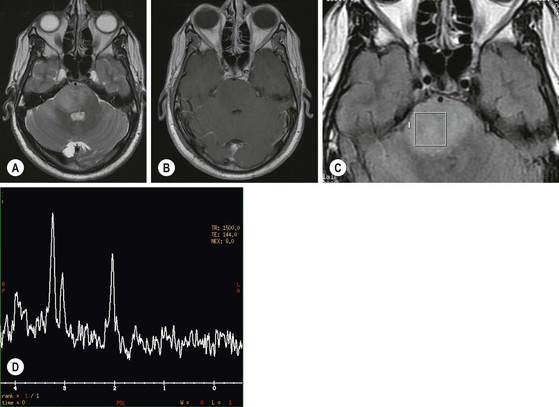
Blood oxygen level-dependent (BOLD) imaging detects changes in regional cerebral blood flow during various forms of brain activity. Paradigms using motor tasks, language and speech productions and memory are able to show activation of relevant cortical areas. The main use of fMRI in tumour imaging is the preoperative localisation of eloquent cortical regions which may have been displaced, distorted or compressed by the tumour18 and identifying any evidence of functional reorganisation. This can improve the safety of surgery and allow for a more radical resection. The BOLD effect is an indirect measure of neuronal activity that may be influenced by numerous physiological factors as well as the MR relaxation properties of soft tissue such that activation within a tumour may reflect angiogenesis rather than eloquent function and susceptibility effects from blood products, for instance, may mask areas of brain activation. Other important caveats include the inability of discriminating between indispensable and expandable brain regions and accurate assessment of the distance between a lesion and an area of functional activity. To this effect, other non-BOLD techniques such as arterial spin labelling (ASL) are being developed and may reduce these pitfalls in the futures.
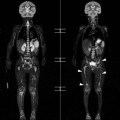
When possible an indicated fMRI should be combined with MR tractrography in order to minimise intra-operative injury to white matter tracts connected to eloquent cortical areas (Fig. 61-2).
Positron-Emission Tomography (PET)
The most widely used PET tracer in oncological imaging is fluorodeoxyglucose [18F] (FDG), which provides a measure of glucose metabolism that correlates closely with the proliferative activity of tumours. Its limitation in neuro-oncoly is the high physiological baseline glucose metabolism of the brain., which may result in a poor lesion to background contrast. New PET radiopharmaceuticals, for brain tumour imaging20 include amino acid analogues such as [11C]methionine (MET) and [18F]fluoroethyl-l-tyrosine (FET), nucleoside analalogues such as [18F]fluorothymidine (FLT) and hypoxia markers such as [18F]fluoromisonidazole (F-MISO). Radioactively labelled choline, [11C]choline (CHO) or [18F]choline, can be used to assess membrane cell turnover and 68Ga-DOTATOC shows a high uptake in meningiomas.21
PET imaging is currently mostly used in combination with computed tomography (PET/CT), but the availability of PET/MRI systems is likely to increase in future, allowing simultaneous acquisition and registration of high-resolution MR sequences and molecular information from PET.
Classification of Intracranial Tumours
There are several ways of classifying brain tumours: primary versus secondary intra-axial (arising from the brain parenchyma) versus extra-axial (arising from tissues covering the brian, such as the dura), and various regional classifications (supratentorial, infratentorial, intraventricular, pineal region and sellar region tumours).
The World Health Organisation (WHO) classification of intracranial tumours is a universally accepted histological classification of brain tumours. It was extensively revised in 1993 with the incorporation of immunohistochemistry into diagnostic pathology and updated in 2000, when genetic profiles were added, stratifying neoplasms by their overall biological potential.22,23 The latest revision is from 2007 with the introduction of eight new entities and three new variants to the previous classification.24 The WHO classification no longer relies on standard pathological features alone but includes information from immunochemistry and molecular tumour profiling. An outline of this classification is given in Table 61-2.
TABLE 61-2
Abbreviated WHO Classification of Brain Tumours
| 1 | Tumours of Neuroepithelial Tissue |
| 1.1 | Astrocytic tumours |
| 1.2 | Oligodendroglial tumours |
| 1.3 | Oligoastrocytic tumours |
| 1.4 | Ependymal tumours |
| 1.5 | Choroid plexus tumours |
| 1.6 | Other neuroepithelial tumours |
| 1.7 | Neuronal and mixed neuronal-glial tumours |
| 1.8 | Pineal region tumours |
| 1.9 | Embryonal tumours |
| 2 | Tumours of Cranial and Paraspinal Nerves |
| 2.1 | Schwannoma |
| 2.2 | Neurofibroma |
| 3 | Tumours of the Meninges |
| 3.1 | Meningioma |
| 3.2 | Mesenchymal tumours |
| 3.3 | Haemangioblastoma |
| 4 | Lymphoma and Haematopoietic Tumours |
| 5 | Germ Cell Tumours |
| 5.1 | Germinoma |
| 5.2 | Teratoma |
| 5.3 | Choriocarcinoma |
| 5.4 | Other germ cell tumours |
| 6 | Cysts and Tumour-Like Conditions |
| 6.1 | Rathke’s cleft cyst |
| 6.2 | Epidermoid cyst |
| 6.3 | Dermoid cyst |
| 6.4 | Colloid cyst |
| 7 | Tumours of the Sellar Region |
| 7.1 | Pituitary adenoma |
| 7.2 | Craniopharyngioma |
| 7.3 | Others |
| 8 | Local Extension from Regional Tumours |
| 9 | Metastases |
Intra-axial tumours, which conform largely to the tissue types 1, 4, 5 and 9, will be discussed first, followed by extra-axial tumours corresponding to the tissue types 2, 3, 6, 7 and 8.
Intra-Axial Tumours
Neuroepithelial Tumours
Neuroepithelial tumours account for 50–60% of all primary brain tumours and represent a broad spectrum of neoplasms arising from or sharing morphological properties of neuroepithelial cells. They include glial neoplasms, choroid plexus tumours, tumours with predominant neuronal phenotype (ganglioglioma, dysembryoplastic neuroepithelial tumour and neurocytoma), pineal tumours and embryonal tumours (neuroectodermal tumours, medulloblastoma).
Gliomas
Gliomas are the commonest neuroepithelial tumours and may originate from astrocytic or oligodendrocytic cell lines. Assessment of the DNA profile and gene expression in tumours plays an increasing role in the characterisation of gliomas and has prognostic implications.25
Presently the most relevant molecular and gene abnormalities are isocitrate dehydrogenase (IDH1 or IDH2) mutation, 1p and 19q chromosomal translocation, methylation status of the DNA repair gene 0-6-methylguanine-DNA-methyltransferase (MGMT) and overexpression of the epidermal growth factor receptor (EGFR).
Astrocytic Tumours
Astrocytomas account for approximately 75% of glial neoplasms and range from the benign pilocytic astrocytomas (WHO grade I) to glioblastoma (WHO grade IV), the most malignant astrocytic tumour, and show a distinct age distribution: pilocytic astrocytomas (WHO grade 1) occur mainly in children and young adults; infiltrative low-grade astrocytomas (WHO grade II) are most frequent in the third decade of life; anaplastic astrocytomas (WHO grade III) have a peak incidence around 40 years; and glioblastoma (WHO grade IV) usually occurs after 40 years.
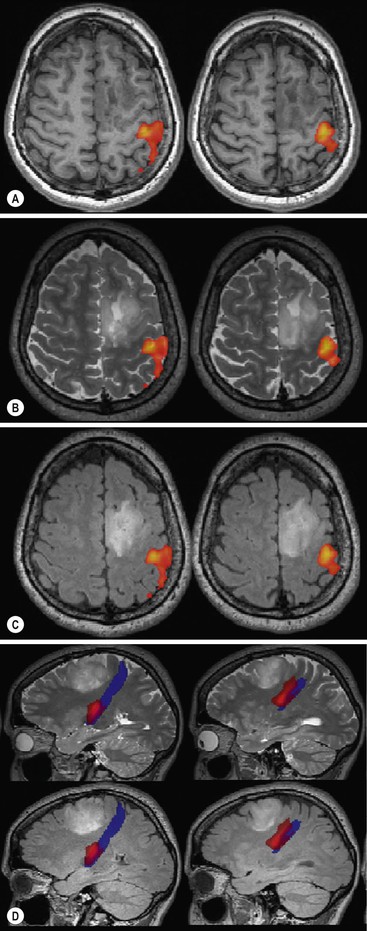
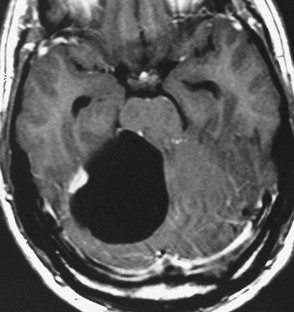
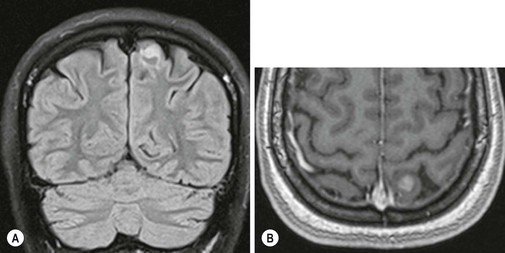
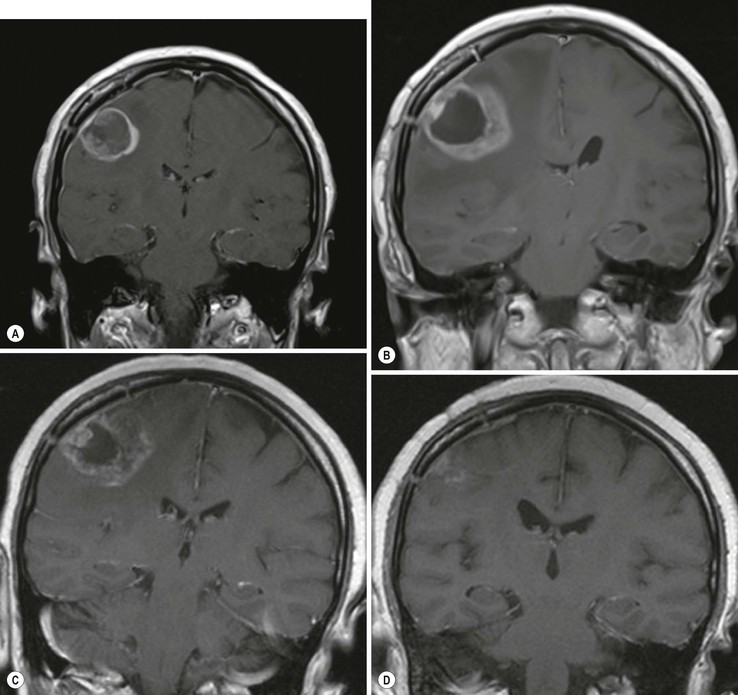
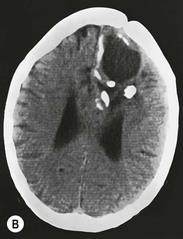
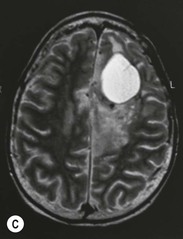
Pilocytic astrocytomas are non-invasive, well-circumscribed, potentially resectable neoplasms which are classified as WHO grade I. They have a low proliferative potential, do not show any IDH mutations and have a predilection for the posterior fossa (Fig. 61-3) and optic nerve/chiasm in children and young adults. Cerebral pilocytic astrocytomas are much less common and usually seen in an older age group (Fig. 61-4). Pilocytic astrocytomas have usually a cystic component and show enhancement, which can be nodular or ring-like. Infratentorial pilocytic astrocytomas in adults are frequently mistaken for haemangioblastomas, which have a similar appearance and represent the commonest primary intra-axial tumour below the tentorium cerebelli in adults, associated in about 20% with von Hippel–Lindau disease. There is evidence that DSC perfusion imaging may help distinguish between the two, as haemangioblastomas have a considerably higher rCBV than pilocytic astrocytomas.26
Diffuse astrocytomas (WHO grade II) are infiltrating low-grade tumours which occur typically in the cerebral hemispheres of young adults, involving cortex and white matter with less well-defined borders than pilocytic astrocytomas. WHO grade II astrocytomas have a low mitotic activity but show a propensity to progress to a higher histological grade, usually within 3–10 years. They frequently show IDH1 and IDH2 mutations, which have a favourable impact on overall survival.27 WHO grade II astrocytomas appear iso- or hypodense on CT and show areas of calcification in up to 20%. MRI is better in defining the extent of the low-grade gliomas (Fig. 61-5). They are hyperintense on T2 images and FLAIR images and hypo/isointense on T1 images and show no contrast enhancement as opposed to pilocytic (WHO grade I) and anaplastic (WHO grade III) astrocytomas.
Anaplastic astrocytomas (WHO grade III) are high-grade gliomas with an increased mitotic activity and raised immunohistochemical proliferation indices. The majority of anaplastic astrocytomas show contrast enhancement but up to a third may be non-enhancing.28 Infiltration of the peritumoural tissues is more extensive than in grade II lesions.29,30
Pleomorphic xanthoastrocytoma (PXA) is a rare, relatively benign low-grade tumour arising near the surface of the brain, with a predilection for the temporal lobe, and presents usually with epilepsy in children and young adults. The tumour is usually well circumscribed, may enhance strongly and has a cystic component in over 50%. Despite its fat content, it is T1 hypointense and T2 hyperintense on MRI. It can occasionally transform to a more aggressive anaplastic WHO grade III tumour.
Glioblastoma (WHO grade IV) has the worst prognosis but is unfortunately also the commonest primary intracranial neoplasm in adults,31 showing poorly differentiated, often highly pleomorphic glial tumour cells with florid microvascular proliferation and necrosis. About 90% of glioblastomas arise de novo (primary glioblastoma) and 10% are from malignant transformation of lower-grade astrocytomas (secondary glioblastoma). The two groups have different genetic characteristics: primary glioblastomas, which occurs in a slightly older age group, show EGFR overexpression and secondary glioblastomas show IDH mutations like the lower-grade gliomas from which they arise. Methylation of the DNA repair gene MGMT is associated with a better response to temozolomide and better prognosis in glioblastomas.
The MRI appearances of glioblastomas are heterogeneous, showing a mixture of solid tumour portions, central necrosis and surrounding oedema. The solid portion is usually T1 hypo and T2/FLAIR hyperintense but to a lesser degree than the areas of central necrosis and surrounding oedema, which have signal intensities similar to CSF on T2 images. The oedema is usually infiltrated by strands of tumour cells, which cannot be detected on standard MR images. The solid portion of the glioblastomas may show complete or partial or enhancement with contrast (Fig. 61-6). The extent of enhancement of the solid tumour seems to correspond to different molecular profiles and appears to have an influence on patient survival.32,33
The standard treatment for glioblastoma (GBM) consists of surgery (with a variable extent of resection depending on tumour location and the patient’s clinical status), followed by a combination of radiotherapy and chemotherapy with temozolomide. Second-line treatment includes anti-angiogenesis drugs and other experimental drugs. The assessment of tumour response and progression in GBM had traditionally been based on measurements of enhancing tumour portions known as Macdonald criteria.34 With the advent of combined chemoradiation as standard therapy and antiangiogentic drugs as second-line treatment, new phenomena such a pseudoprogression and pseudoresponse have to be taken into account and have made an assessment solely based on assessment of enhancing tumour portion unreliable.35,36 The Response Assessment in Neuro-Oncology (RANO) Working Group has therefore published recommendations for updated response criteria for high-grade gliomas.37
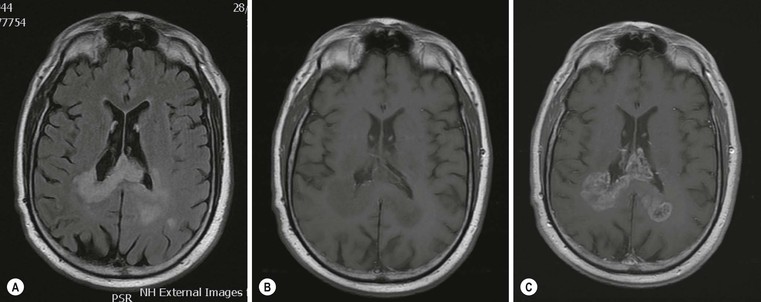
Pseudoprogression is due to an inflammatory reaction, which results in a temporary increase of contrast enhancement and oedema, usually within 12 weeks of chemoradiation, and subsides subsequently without additional treatment (Fig. 61-7). Pseudoprogression is more frequently observed in patients with methylation of the DNA repair gene MGMT, and is associated with a better prognosis (longer overall survival). There are certain histological similarities between the inflammatory response in pseudoprogression and classical radiation necrosis which is a delayed complication of radiation treatment occurring 6–12 months after treatment. Advanced MR imaging such as DSC and DCE perfusion imaging shows promise in differentiating theses two conditions from true tumour progression.
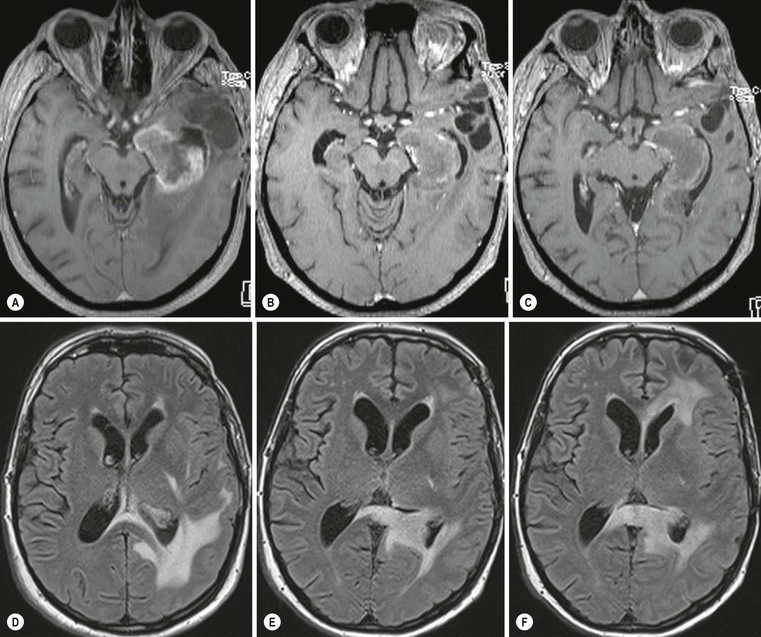
Pseudoresponse is characterised by a decrease of enhancement and oedema following the administration of antiangiogenic drugs without improved survival.37,38 In pseudoresponse the tumour progresses by infiltrative patterns without neoangiogenesis, resulting in an increase of non-enhancing T2/FLAIR hyperintense tumour portions (Fig. 61-8).
Antiangiogenic treatment can also be associated with non-enhancing areas of markedly decreased ADC, which appears to correspond to an atypical gelatinous necrotic tissue rather than tumour and are associated with improved outcome.39
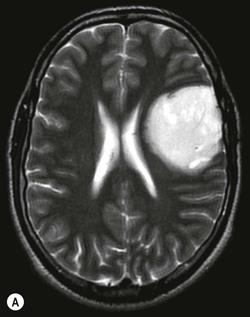
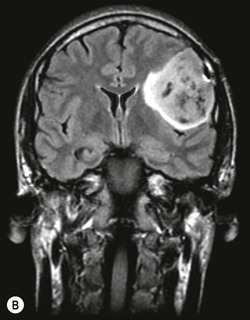
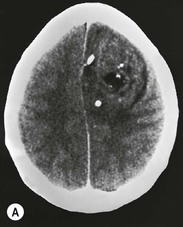
Oligodendrogliomas account for 10–15% of all gliomas and occur predominantly in adults. They are diffusely infiltrating neoplasms, which are found almost exclusively in the cerebral hemispheres, most commonly in the frontal lobes, and typically involving subcortical white matter and cortex (Fig. 61-9). The WHO classification distinguishes between WHO grade II (well-differentiated low-grade) and WHO grade III (anaplastic high-grade) oligodendrogliomas. The former are slowly-growing tumours with rounded homogeneous nuclei; the latter have increased tumour cell density, mitotic activity, microvascular proliferation and necrosis. Both low- and high-grade oligodendral tumours express proangiogenic mitogens and may contain regions of increased vascular density with finely branching capillaries that have a ‘chicken wire’ appearance. This contributes to their appearance on contrast-enhanced MRI and MRP. Up to 90% of oligodendrogliomas contain visible calcification on CT, which can be central, peripheral or ribbon-like (Fig. 61-9).40 On MRI, intratumoural calcification appears typically T2 hypo- and T1 hyperintense and causes marked signal loss on T2* or SWI images. Intratumoural haemorrhage, which occurs uncommonly in oligodendrogliomas, may have a similar appearance. Contrast enhancement is variable and often heterogeneous. Unlike in astrocytomas, contrast enhancement is not a reliable indicator of tumour grade it oligodendrogliomas: it occurs in about 20% of WHO grade II tumours and in over 70% of WHO grade III oligodendrogliomas.41 Low-grade oligodendrogliomas may also have an elevated rCBV on PWI.42
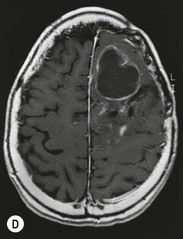
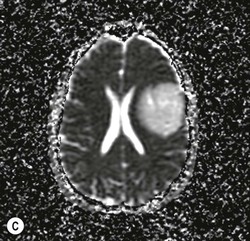
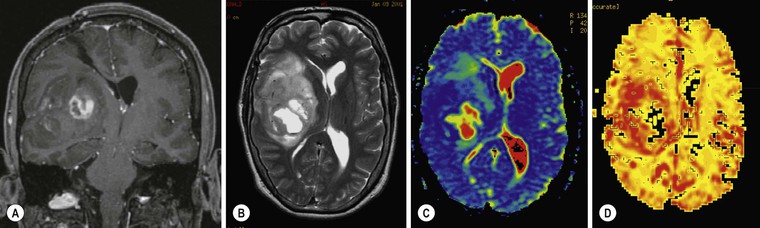
Allelic loss on the chromosomes 1p and 19q is present in 80% of oligodendrogliomas and is associated with better response to chemotherapy. Oligodendrogliomas with 1p/19q loss appear to have a significantly higher rCBV than those with intact 1p and 19q43 (Fig. 61-10). Conventional MR images may provide a further clue to the oligodendroglioma genotype: tumours with intact 1p/19q show more homogeneous signal on T1- and T2-weighted (T1W, T2W) images and have sharper borders than the tumours with chromosome deletions.44,45
MRS of low-grade tumours with oligodendral elements shows increased levels of myo-inositol/glycine as well as glutamine and glutamate.17
The Role of Advanced Physiological MR Imaging in Glial Tumours
The use of PWI, DWI and MRS as an adjunct to structural imaging can improve the prediction of the histological tumour type and grade, tumour infiltration of surrounding tissue, treatment response and patient survival. These techniques are also helpful for differentiating treatment-related complications from tumour progression. Low-grade (WHO grade II) oligodendrogliomas tend to have higher rCBV values and lower ADC values than WHO grade II astrocytomas.46 This can be explained by increased vascular density and higher cellular density in low-grade oligodendrogliomas and differences in tumour matrix composition.
Several studies have shown the use of PWI to distinguish low-grade from high-grade glial tumours. The formation of new blood vessel (angiogenesis) represents an important aspect of tumour progression and growth in glial tumours, and is reflected in the much higher rCBV values of WHO grade III and IV tumours compared to WHO grade II tumours. PWI significantly increases the sensitivity and positive predictive value of conventional MR imaging in glioma grading with a sensitivity of 95% for distinguishing low-grade from high-grade gliomas when an rCBV threshold of 1.75 is used.47
Combining minimum ADC with maximum rCBV measurements further improves the accuracy of glioma grading, particularly the distinction between WHO grade II and III tumours.48 For oligodendrogliomas ADC values were better than rCBV values in distinguishing between WHO grade II and III tumours.41
DWI appears also useful to identify the MGMT promotor methylation status in glioblastomas. Tumours with methylated MGMT, which have a better prognosis, demonstrated a significantly higher minimum ADC.49
In MRS, glial tumours are characterised by an increase in Cho and decrease in NAA, which can be expressed in a choline to NAA index (CNI). Low-grade tumours have generally a lower CNI than high-grade tumours; WHO grade IV tumours show additionally an increase in lipid and lactate as markers of hypoxia and necrosis.19
Infiltration of peritumoural regions in gliomas can also be assessed with physiology-based MR techniques.16,19 The peritumoural regions of high-grade gliomas show a more marked decrease in ADC, fractional anisotropy and NAA and increase in CBV compared to low-grade tumours. This is a reflection of the more invasive nature of these tumours, which destroy ultrastructural boundaries with a consequent decrease in ADC and FA; and replace normal brain tissue, resulting in a drop of NAA. Metastases, on the other hand, are surrounded by ‘pure’ vasogenic oedema, which contains no infiltrating tumour cells. The peritumoural regions in metastases show therefore no increase in rCBV or decrease in FA.
Physiological and molecular MR imaging have also a role in predicting patient survival and treatment response.
Measurements on baseline rCBV in gliomas are strongly predictive of patient outcome50
Related posts:
Stay updated, free articles. Join our Telegram channel

Full access? Get Clinical Tree


