BENIGN AND MALIGNANT MESENCHYMAL TUMORS: MUSCLE AND OTHER CELL LINE ORIGINS
KEY POINTS
- Benign and malignant tumors of muscle and other mesenchymal origin usually do not distinguish themselves from other malignancies based on appearance alone.
- Sarcomas may have an indolent looking margin especially on MRI that belies their true nature.
- Synovial cell sarcomas do not arise in joints.
RHABDOMYOSARCOMA
Clinical Perspective and Pathology
Rhabdomyosarcoma is the most common lesion of striated muscle cell origin arising in the head and neck region.1 The head and neck, in general, is the most common site of origin of these tumors. In children, it is the most common soft tissue malignancy of the head and neck occurring predominantly in patients between 2 and 12 years of age.2,3 It is unusual to see a rhabdomyosarcoma in those <1 year of age; thus, it becomes extremely important not to mistake infantile torticollis or fibromatosis colli (Chapter 37) for rhabdomyosarcoma.
Rhabdomyosarcoma variants recapitulate the embryogenesis of skeletal muscle that progresses through small round cell and spindle cell phases to become a mature, multinucleated muscle fiber. The least differentiated of these tumors, embryonal rhabdomyosarcoma, is composed of small, round cells and in the past may be mistaken histopathologically for lymphoma, melanoma, and fibrosarcoma, among others.1–4 Immunohistochemical studies have, however, eliminated most of the ambiguity in the diagnosis of “small round cell” and “spindle cell” lesions.
About one third of rhabdomyosarcomas arise in the orbit and periorbital soft tissues (Fig. 35.1). The neck and deep facial structures (Figs. 35.2–35.6), nasopharynx, tongue and soft palate, middle ear, and mastoid region (Fig. 35.7) each account for roughly 10% to 12% of the remainder. The remaining one third are scattered among the sinuses, nasal cavity, mandible, oral cavity (Fig. 35.2), floor of the mouth (Fig. 35.3), salivary glands, larynx, and hypopharynx.
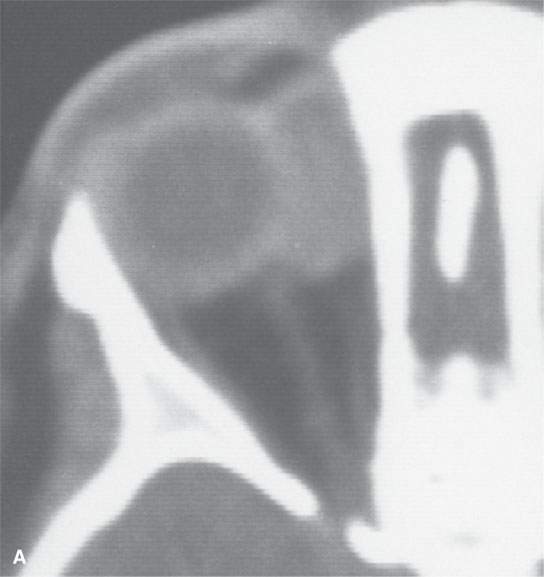
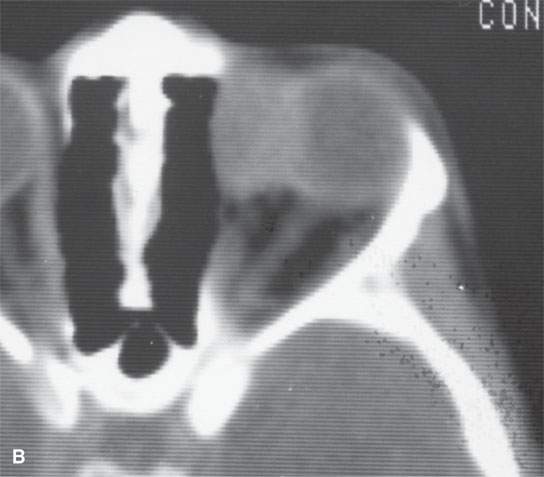
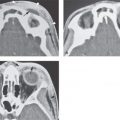
FIGURE 35.1. Two patients with orbital rhabdomyosarcoma sarcomas. A: Contrast-enhanced computed tomography (CT) study shows a well-circumscribed mass. Differentiation from other even benign orbital lesions on the basis of this study is impossible. The clue in the clinical history was rapid enlargement. B: A second patient with CT study of an orbital rhabdomyosarcoma. The margins are slightly less sharp than in (A). Again, the only clue to probable etiology was the history of rapidly developing orbital symptoms.
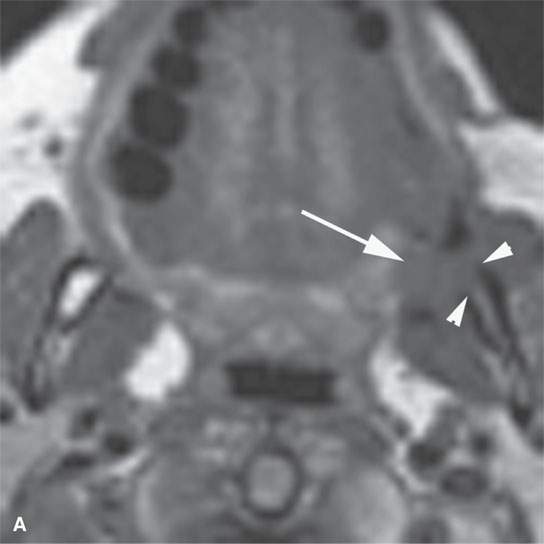
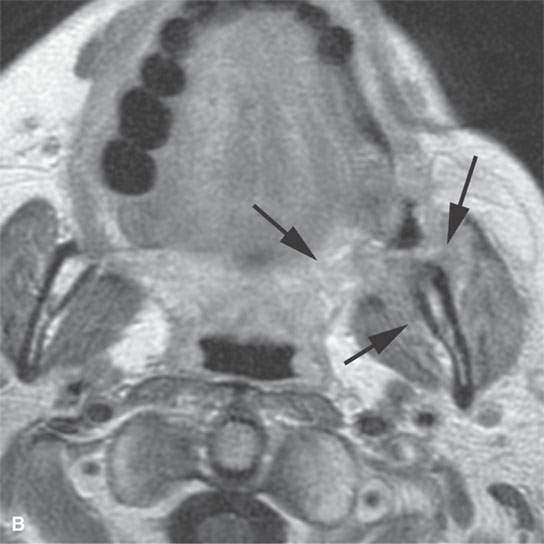
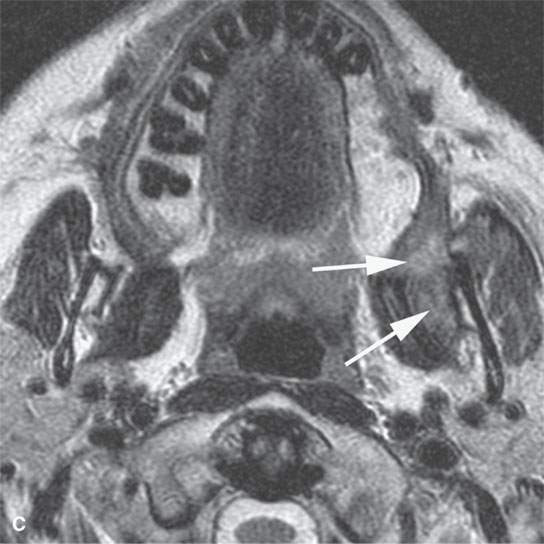
FIGURE 35.2. Magnetic resonance imaging study of a patient with rhabdomyosarcoma arising at the region of the upper gingivobuccal sulcus and buccal space. A: Non–contrast-enhanced T1-weighted (T1W) image shows the mass to be isointense to skeletal muscle (arrow). There is a suggestion of erosion of the cortical bone along the ascending ramus of the mandible (arrowheads). B: Contrast-enhancedT1W image at nearly the same level seen in (A). The mass extends from the junction of the soft palate and anterior tonsillar pillar to lie mainly within the buccal and masticator spaces (arrows). It enhances mildly and appears slightly brighter than the other skeletal muscles visible on this image. C: T2-weighted image showing the mass extending from the buccinator muscle to the masticator space between the medial pterygoid muscle and the mandible (arrows). The mass is slightly brighter than normal skeletal muscle.
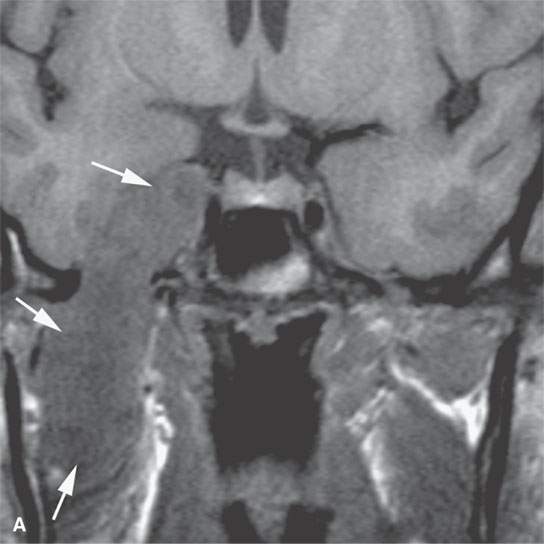
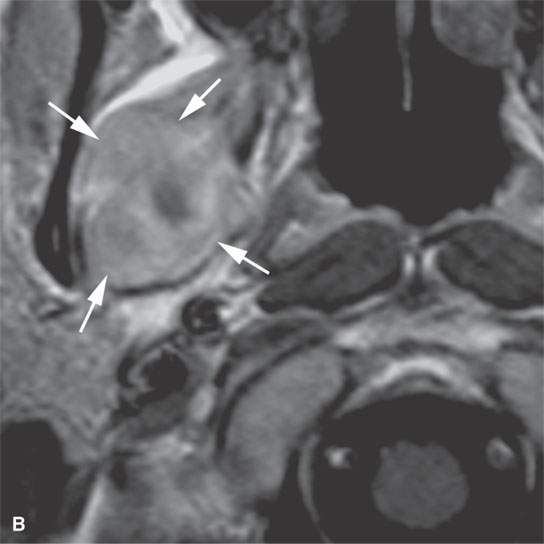
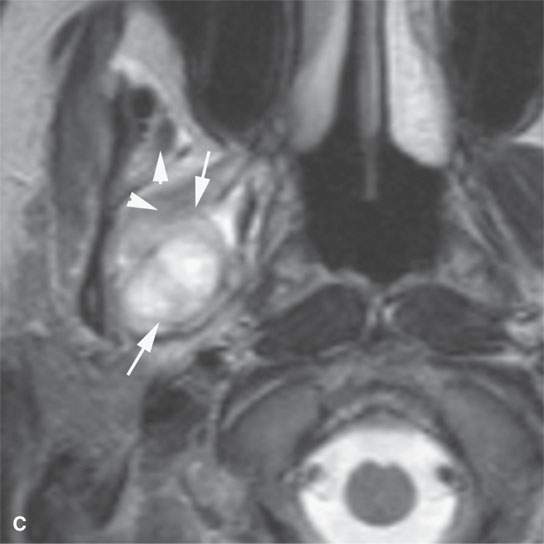
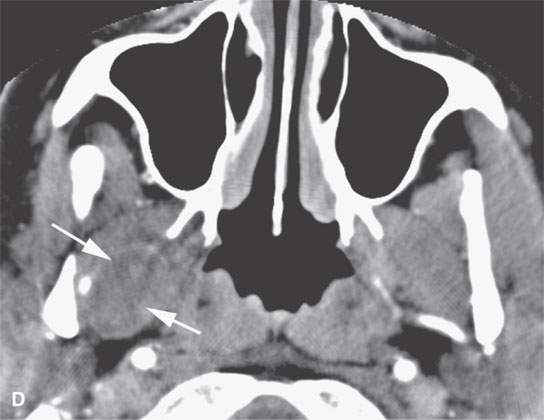
FIGURE 35.3. Magnetic resonance imaging (MRI) study of a rhabdomyosarcoma arising in the floor of the mouth and spreading within the masticator space along the third division of the trigeminal nerve. A: Non–contrast-enhanced T1-weighted (T1W) images show the mass to be variable in signal intensity, somewhere in the range of skeletal muscle. Its extent following V3 through the skull base and into the trigeminal cistern is shown by the arrows. B: Contrast-enhancedT1W axial image shows the mass to be inhomogeneously but generally enhancing and constrained by the fascia of the masticator space (arrows). C: T2-weighted images show the mass to be obviously brighter than surrounding normal skeletal muscle (arrows). Note that the pterygoid and temporalis muscles show evidence of denervation (arrowheads) due to involvement of V3. D: Contrast-enhanced computed tomography study showing the mass to not enhance very much on this relatively early somewhat arterial phase injection (arrows). The mass is slightly less dense than normal skeletal muscle. More enhancement was noticed, similar to that on the MRI study in (B), on delayed images.
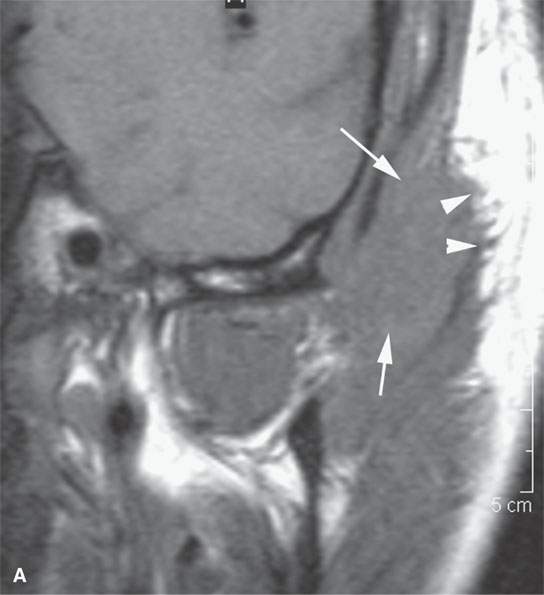
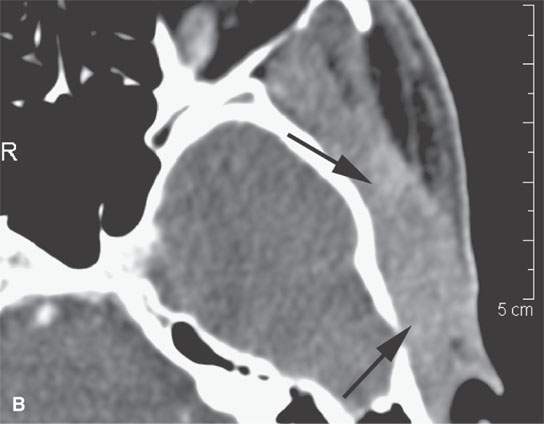
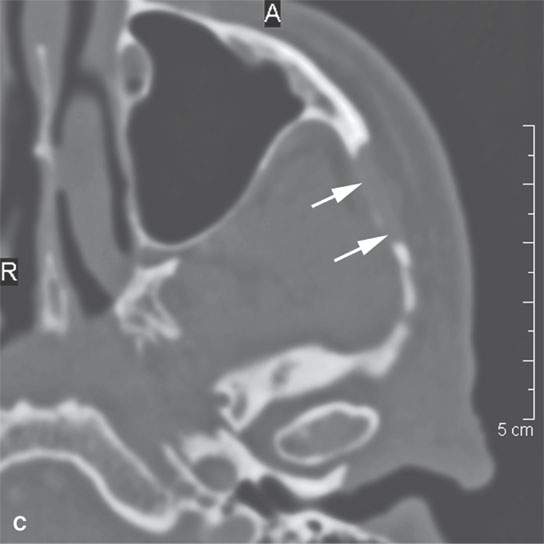
FIGURE 35.4. Computed tomography (CT) and magnetic resonance imaging (MRI) studies on a patient with rhabdomyosarcoma of the upper masticator space. A: The mass was discovered on a MRI study done for temporomandibular joint dysfunction. Only non–contrast-enhanced T1-weighted images are available. They show the mass to be isointense to skeletal muscle (arrows) with infiltrative margins (arrowheads). B: Contrast-enhanced CT shows the mass to infiltrate the temporalis muscle full thickness to the overlying outer table of the calvarium (arrows). It enhances minimally. C: Bone windows showing destruction of the zygomatic arch (arrows).
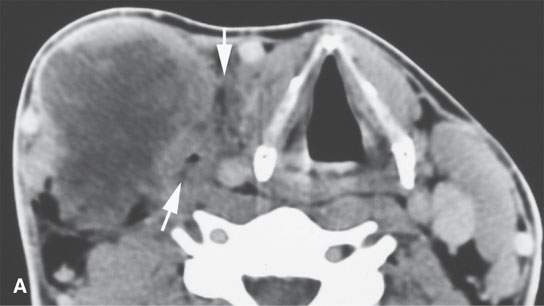
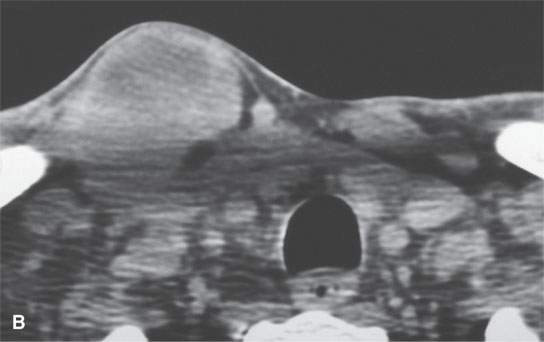
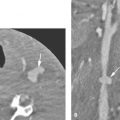
FIGURE 35.5. An adult patient presenting with a lateral neck mass. Contrast-enhanced computed tomography was done. The mass on these two images obviously arises in the sternocleidomastoid muscle. A, B: The mass is of relatively low density compared to normal skeletal muscle with little enhancement. The mass shows aggressive invasion of the fat within the lateral compartment of the neck (arrows).
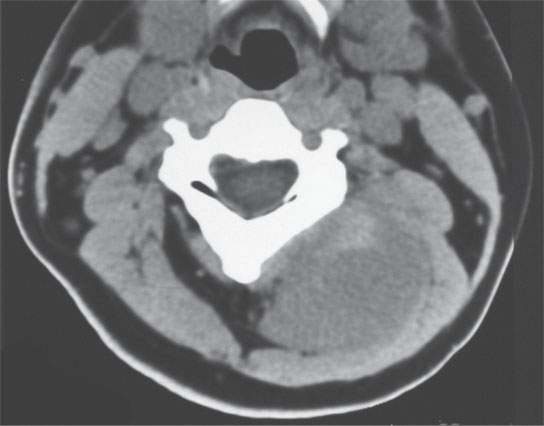
FIGURE 35.6. A child presenting with a posterior compartment neck mass. Non–contrast-enhanced computed tomography study shows it to be generally of lesser density than surrounding skeletal musculature. Biopsy revealed rhabdomyosarcoma.
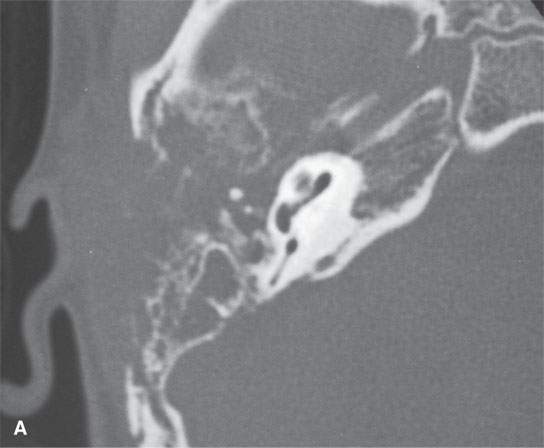
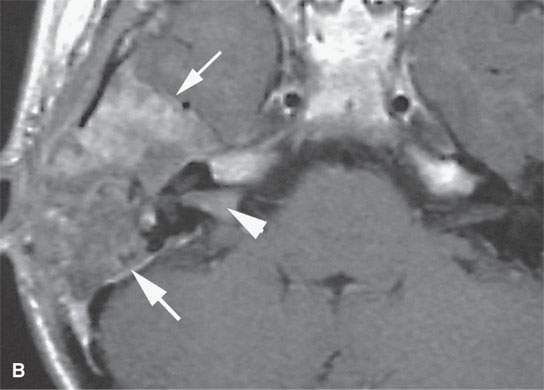
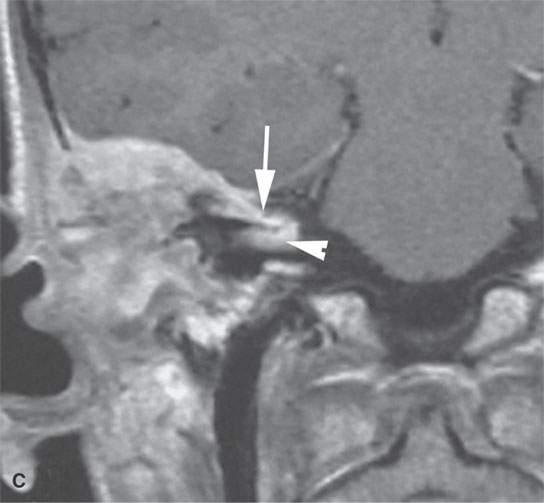
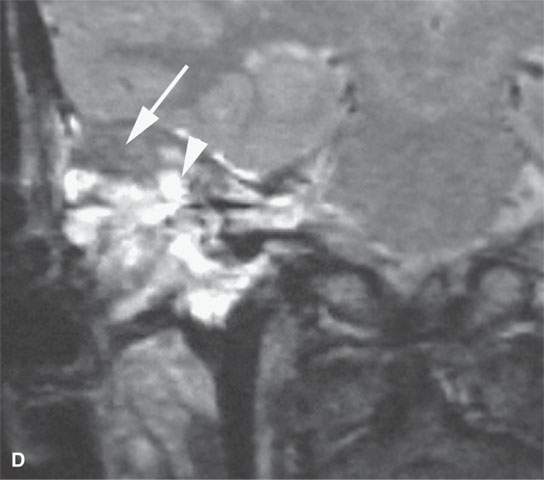
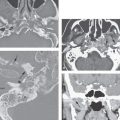
FIGURE 35.7. A child with rapidly progressive pain and mass in the periauricular region developing hearing loss and facial nerve palsy. Biopsy showed rhabdomyosarcoma. A: Computed tomography study showing extensive destruction of the mastoid portion of the temporal bone. B: Contrast-enhanced T1-weighted (T1W) image shows extensive tumor of variable enhancement involving the mastoid portion of the temporal bone in places constrained by the dura of the posterior and middle cranial fossa (arrows) and with spread into the internal auditory canal (arrowhead). C: Coronal T1W images showing tumor spreading along the dura of the temporal bone (arrow) and into the internal auditory canal, possibly both intra- and extradural (arrowhead). D: T2-weighted image to correlate with (C) shows zones of darker signal intensity roughly equivalent to brain (arrow) and brighter zones likely related to tumoral necrosis or other regressive changes (arrowhead). The brighter zones could also just represent mixed cellularity of the stromal and tumoral cell elements.
Rhabdomyosarcomas are generally mildly vascular well-circumscribed lesions with multilobular margins as seen on computed tomography (CT) and magnetic resonance imaging (MRI).4,5 The well-circumscribed margins as typically represented on MRI are deceptive in these malignancies.
Rhabdomyosarcomas are currently treated, with ever-improving success, by a combination of chemotherapy and radiation therapy.1,2 Over the last 10 to 15 years, surgery has been relegated to an adjunctive role in most cases.
Imaging Appearance
These highly cellular lesions appear much brighter than muscle on T2-weighted MRI and may even be hyperintense to fat4,5 (Figs. 35.1 and 35.2). They are about muscle equivalent on T1-weighted images. The tumor cells are frequently accompanied by a loose stroma that may contribute to the tendency for the lesions to be bright on T2-weighted images. Even though these tumors are brighter than muscle on T2-weighted images, they will not, as a rule, approach the signal intensity seen in typical inflammatory polyps. Rhabdomyosarcomas arising on mucosal surfaces may mimic inflammatory polyps or other polypoid mucosal masses (Fig. 35.8) on physical examination. When this occurs in the nasal cavity and nasopharynx, imaging evidence of deep infiltration suggesting malignancy or an enhancement pattern suggestive of polyps or normal lymphoid tissue suggesting the benign alternative may help in making this differentiation. The latter findings are easier to appreciate on contrast-enhanced magnetic resonance (CEMR) than on contrast-enhanced computed tomography (CECT). Enlarged vessels may be present and lead to the mistaken impression of the lesion being a juvenile angiofibroma or hemangiopericytoma. The aggressive growth pattern into surrounding soft tissues and clinical features should make the differential diagnosis straightforward in almost all cases. On non–contrast-enhanced CT, they are about muscle slightly hypodense to about equivalent to muscle density (Fig. 35.6) and may show mild to marked enhancement (Fig. 35.7). Necrosis is a common regressive change in larger tumors (Figs. 35.3 and 35.7).
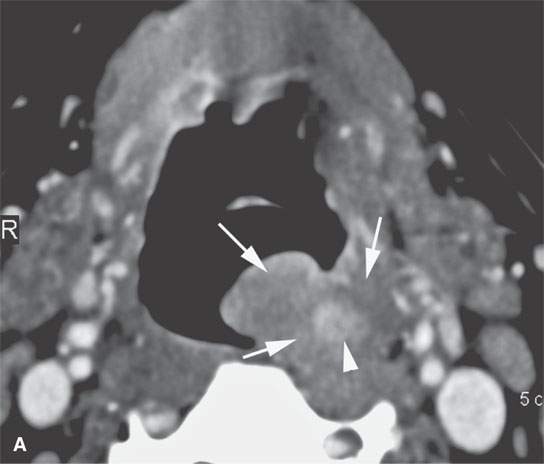
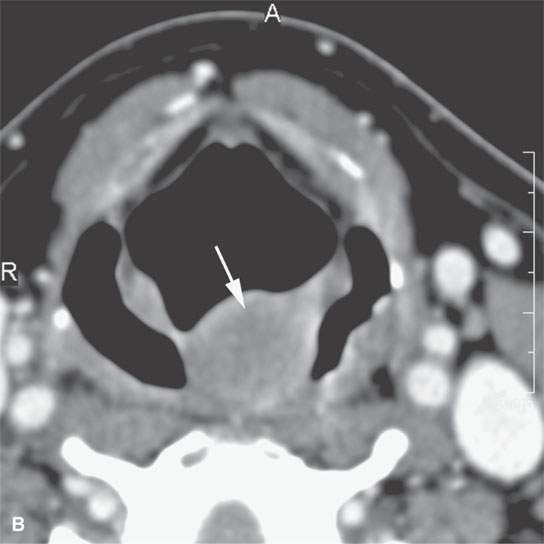
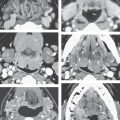
FIGURE 35.8. Contrast-enhanced computed tomography of a patient with a polypoid mass along the low oropharyngeal and upper hypopharyngeal wall subsequently proven to be a low-grade rhabdomyosarcoma. A: The exophytic component of the mass and much of the remaining mass is nonenhancing and roughly muscle equivalent in density or slightly less so (arrows). There is a more central portion of the tumor that enhances (arrowhead). If this lesion were in the nasal cavity, it should be apparent that it could mimic a more benign polypoid process. B: The exophytic component of the mass is about the same density of muscle and protrudes into the airway much as an inflammatory polyp might in the nasopharynx or nasal cavity. This was part of this low-grade rhabdomyosarcoma (arrow).
Stay updated, free articles. Join our Telegram channel

Full access? Get Clinical Tree


