BENIGN AND MALIGNANT TUMORS: GENERAL ISSUES, GROWTH PATTERNS, AND TREATMENT-RELATED CHANGES
KEY POINTS
- Growth patterns of benign and malignant neoplasms
- Perineural spread of malignancies
- Computed tomography, magnetic resonance imaging, and ultrasound appearance of benign and malignant neoplasms
- General patterns of postradiotherapy and postsurgical changes following treatment for malignancies
- Principles of posttreatment surveillance including fluorine-18 2-fluoro-2-deoxy-D-glucose positron emission tomography
The classification used here is intended to aid the reader in forming a general understanding of the benign and malignant neoplasms that affect the extracranial head and neck. Some neoplasms occur exclusively in the head and neck region, such as juvenile angiofibroma, but most others are seen elsewhere in the body. In some neoplastic processes, such as lymphoma, the head and neck involvement may represent only a small component of the disease. This chapter and those that follow in this section (Chapters 22–43) take a pathoanatomic and pathologic point of view. Each tumor type is considered in terms of its occurrence at various head and neck sites and in particular the effect of a neoplasm’s spread pattern, natural history, and cellular structure on its computed tomography (CT), magnetic resonance (MR), and ultrasound (US) appearance and its physiology as reflected on metabolic imaging studies such as fluorine-18 2-fluoro-2-deoxy-D-glucose positron emission tomography (FDG-PET). Other sections and chapters emphasize the clinical and imaging implications of a particular type of tumor at a specific anatomic location.
GENERAL ISSUES
CT and MR and, to a lesser extent, US and radionuclide studies currently play a central role for any multidisciplinary team that is called upon to manage head and neck neoplasms. The value of an imaging study in helping to care for the patients of surgeons, radiation oncologists, medical oncologists, and others on the health care team is directly proportional to the skill and interest of the diagnostic imager. If the decision making is a shared responsibility performed in an open forum, such as a Head and Neck Tumor Board, patients can be fully informed of their treatment options and prognosis before a perhaps less optimal path is chosen. This ability to adequately inform is, in large part, due to the extraordinary amount of information concerning the extent of disease available with current medical imaging technology and the exceptional accuracy of pathologic diagnosis compared to that available just three decades ago.
Knowledge continues to evolve about the specific value and limitations of imaging studies in head and neck neoplasms. It is the task of the interdisciplinary team and especially diagnostic radiologists to refine their use in the safest and most efficient manner. However, newer imaging approaches must respect the more than 50 to 60 years of clinical experience in treating these disorders and augment those lessons learned rather than ignore or, worse, undo them.
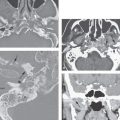
The most basic contribution of imaging is its ability to find disease spreading beyond the limits of the physical examination of the head and neck, including more advanced endoscopic and physiologic testing procedures. This manifests itself in several ways. Spread beneath intact mucosa is not visible to the endoscopist, and imaging can lead to the initial diagnosis of a mucosally not apparent primary cancer (Figs. 21.1–21.4).1,2 Deep spread in a mucosally apparent tumor is often palpable but still usually difficult to assess objectively even with good bimanual palpation combined with inspection and history; however, experienced examiners can often anticipate involvement of many of the areas that are subsequently proven to be abnormal on imaging studies, principally CT and magnetic resonance imaging (MRI) (Figs. 21.5 and 21.6). Some locales are simply inaccessible for palpation, such as the skull base, pterygopalatine fossa, infratemporal fossa, orbits, and brain (Fig. 21.7). Critical management decisions frequently hinge on imaging findings alone (Fig. 21.7) and/or confirmation by imaging-guided biopsy (Fig. 21.8).
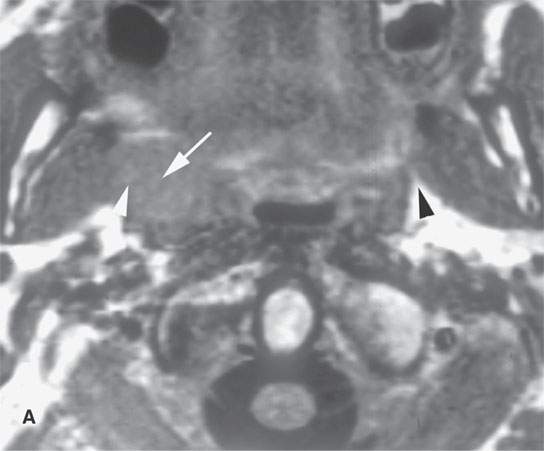
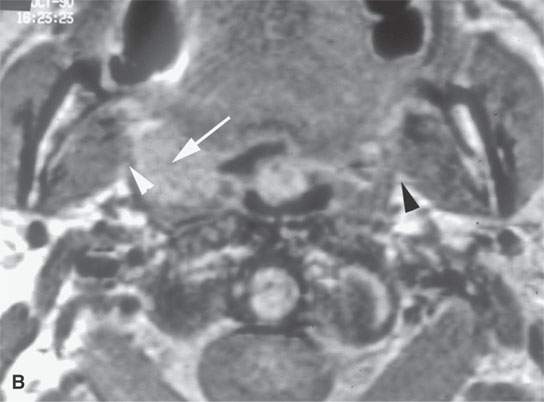
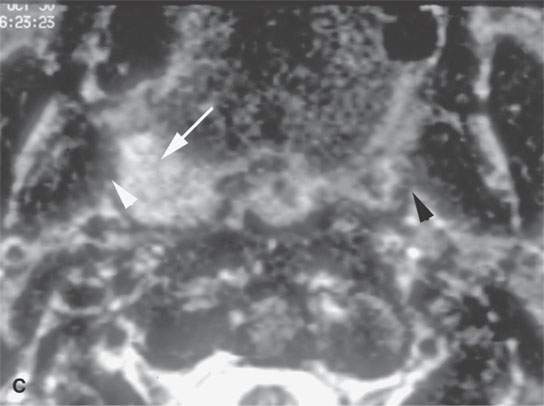
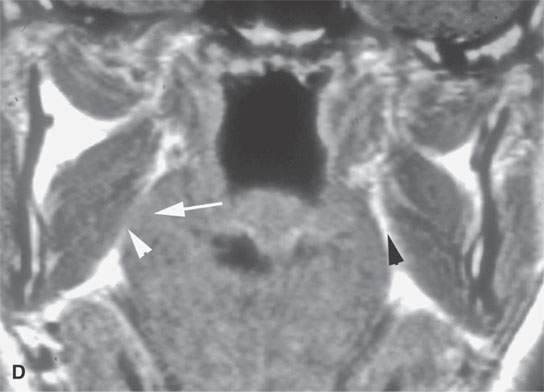
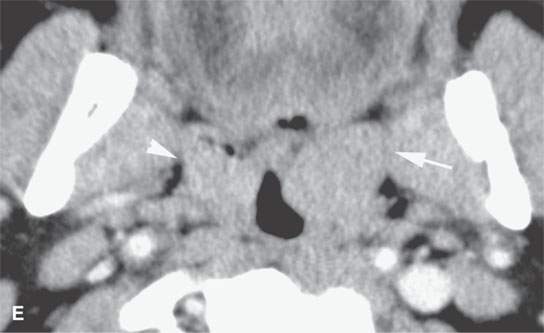
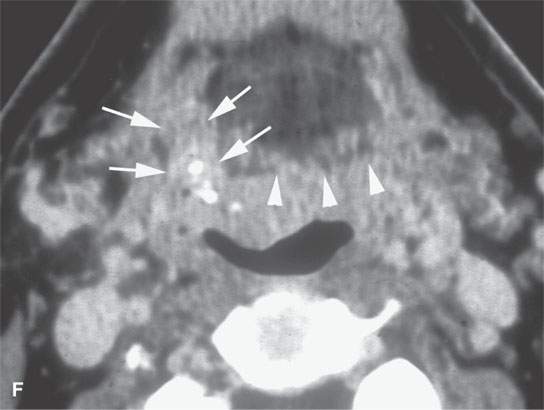
FIGURE 21.1. Three patients with submucosal cancers not visible to the endoscopist. A–D: Magnetic resonance imaging of a patient presenting with right-sided otalgia and no visible mucosal lesion—all pulse sequences show the enlarged right palatine tonsil (arrows) with obliteration of parapharyngeal fat on the right (white arrowheads) compared to the left (black arrowheads). E: Contrast-enhanced computed tomography (CT) of a patient with left level 2 neck node needle biopsy showing squamous cell carcinoma (SCCA). The CT shows a prominent left tonsil with subtle encroachment on the parapharyngeal fat (arrow) compared to the normal side (arrowhead). F: Contrast-enhanced CT of a patient with right-sided otalgia and a right level 2 neck node needle biopsy showing SCCA. The submucosal tongue base cancer penetrates (arrows) the tongue base to a far greater degree than the normal carpet of lingual tonsillar and other glandular tissue (arrowheads).
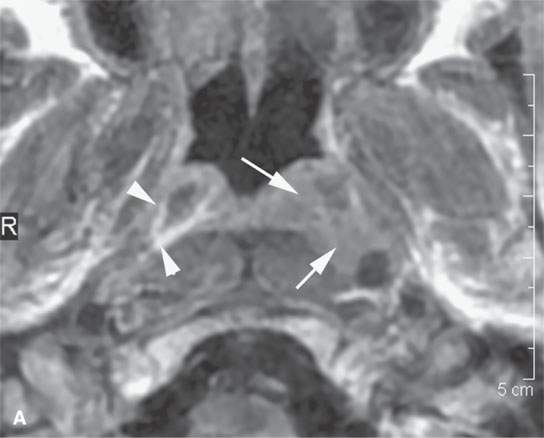
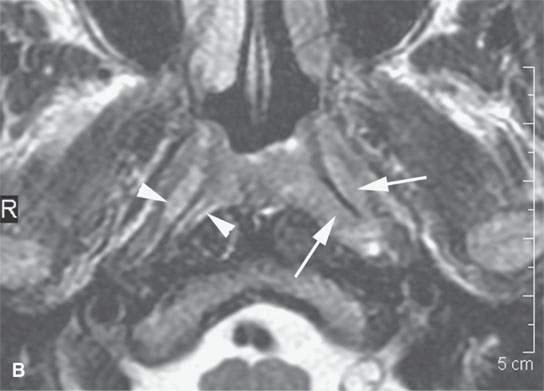
FIGURE 21.2. A patient with submucosal nasopharyngeal cancer not visible to the endoscopist, the patient presenting with chronic middle ear disease. The entirely submucosal squamous cell carcinoma invades the deep tissue planes (arrows) on the left compared to the normal side (arrowheads) on the right on both the contrast-enhanced T1-weighted image (aA) and the T2-weighted image (bB).
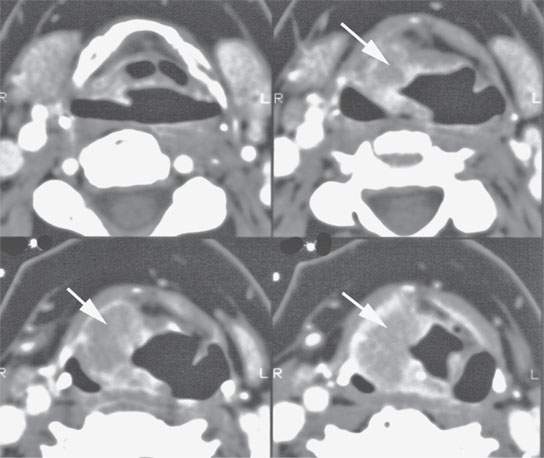
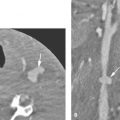
FIGURE 21.3. Contrast-enhanced computed tomography (CT) of the larynx in a patient with submucosal supraglottic cancer not visible to the endoscopist, the patient presenting with hoarseness and right-sided otalgia. This mass (arrows) was likely present for 2 years before a percutaneous CT-guided biopsy, following three negative endoscopic biopsy attempts, confirmed squamous cell carcinoma.
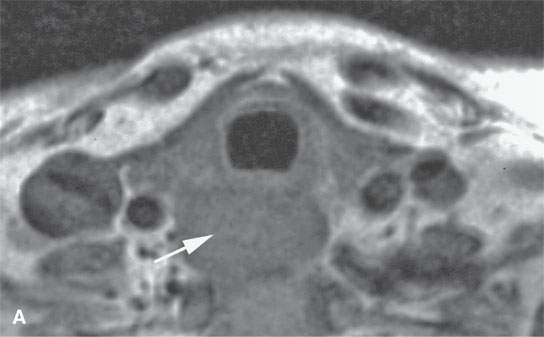
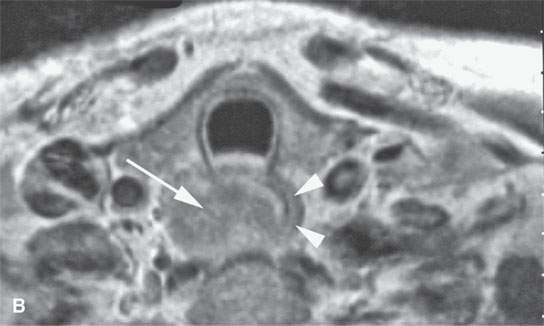
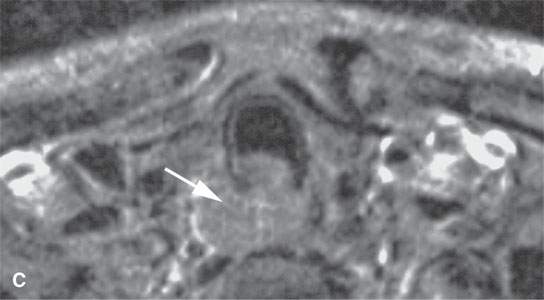
FIGURE 21.4. Contrast-enhanced magnetic resonance of the cervical esophagus in a patient with submucosal esophageal cancer not visible to the endoscopist presenting with chronic dysphagia. All sequences (A–, B and C) show the submucosal esophageal mass (arrows) and very little remaining muscle tissue (arrowheads in B)[SF1]. This mass was likely present for many months before a percutaneous computed tomography–guided biopsy, following two negative endoscopic biopsy attempts, confirmed squamous cell carcinoma.
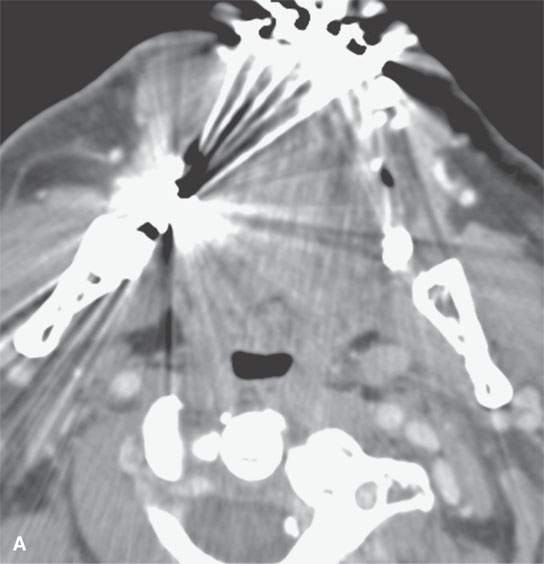
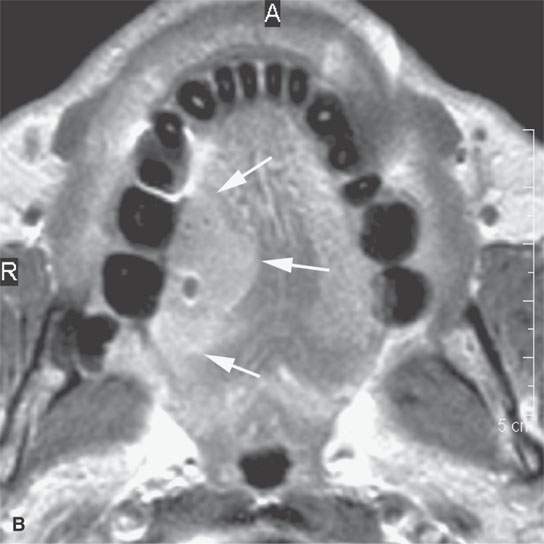
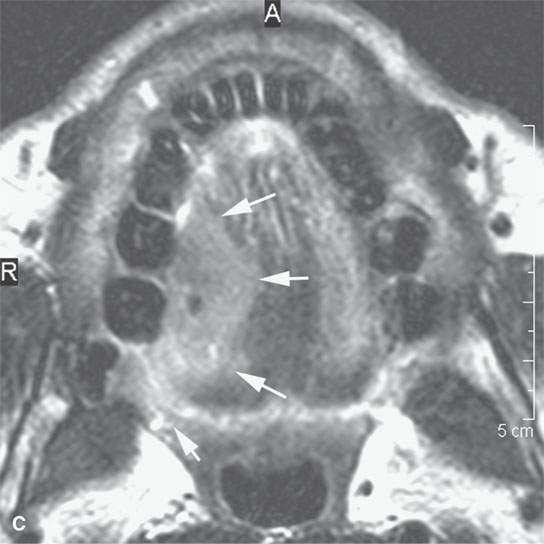
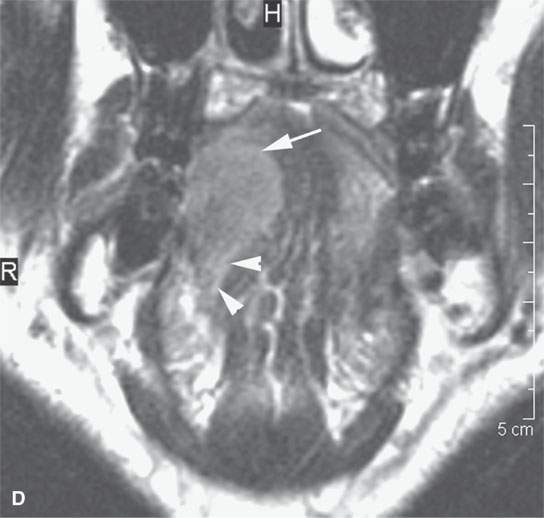
FIGURE 21.5. A patient with oral tongue cancer. The computed tomography (aA) was degraded by unavoidable artifacts. The magnetic resonance images (B–, C,D) mapped the lesion well (arrows), including showing the minor invasion of the floor of the mouth (arrowheads in D). The signal intensity seen on the T2-weighted images (b and dCB, D) and the degree of enhancement as seen on the contrast-enhanced T1-weighted image (A) is fairly typical of squamous cell carcinoma. The margins as seen on these images are typical of a “pushing” as opposed to “infiltrating” margin. Compare this with the margins seen in Figure 21.6.
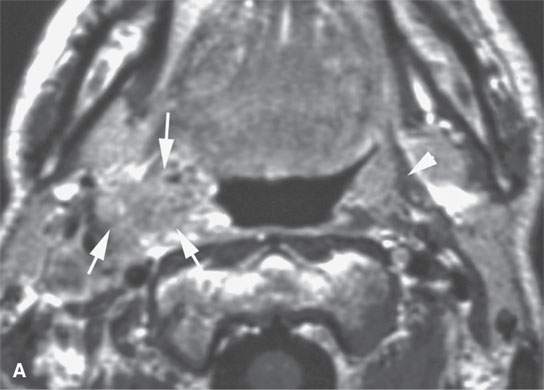
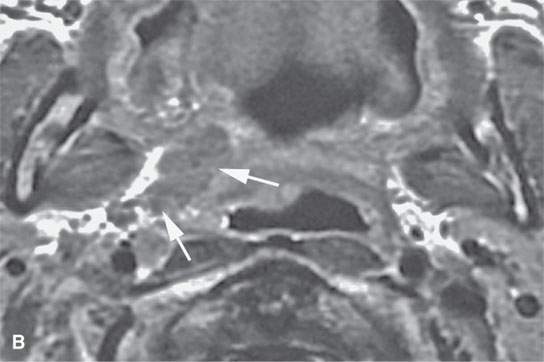
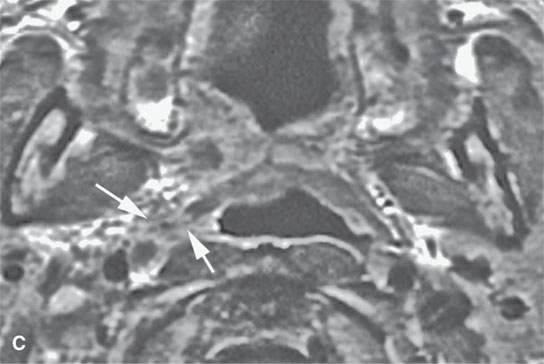
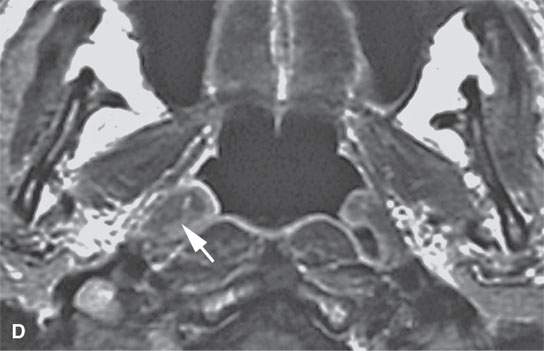
FIGURE 21.6. Contrast-enhanced magnetic resonance in a patient with tonsillar squamous cell carcinoma that was believed clinically to be confined to the tonsillar fossa. The magnetic resonance (MR) images show the lesion to have highly infiltrating rather that “pushing” margins (compare with MR images in Figure 21.5). A: Contrast-enhanced T1-weighted image showing a highly infiltrative mass invading the styloglossus muscle and parapharyngeal fat (arrows). Compare with normal styloglossus muscle (arrowhead) and surrounding anatomy on the left. B–D: Contrast-enhanced T1-weighted images show the continued very aggressive infiltrating margins (arrows) of the lesion extending all the way to the eustachian tube in (dD). Note that while the margins are more aggressive, the signal intensity relative to normal tissues and the degree of enhancement is about the same as seen in the less aggressive lesion in Figure 21.5.
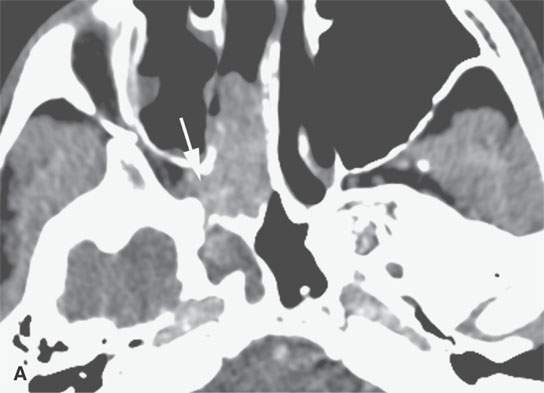
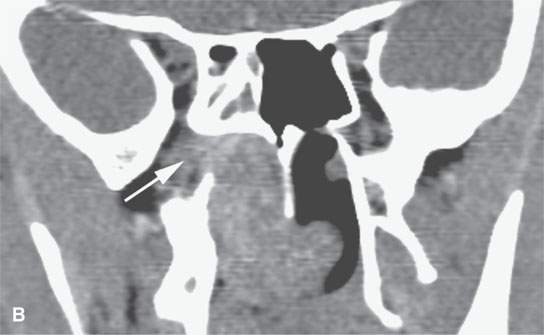
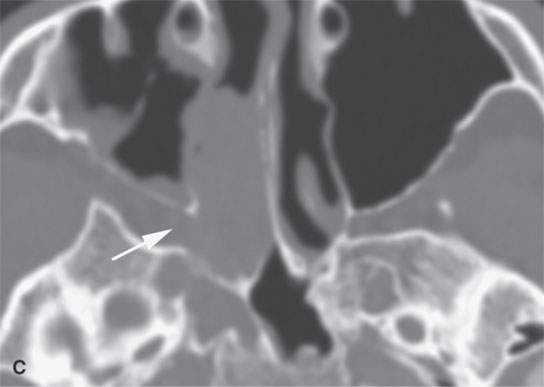
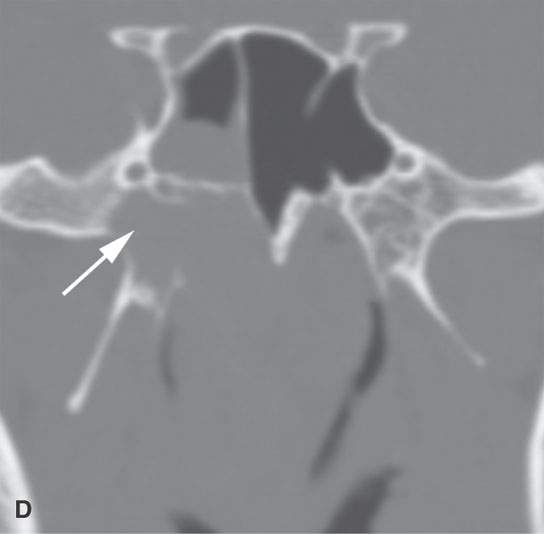
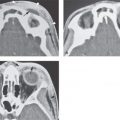
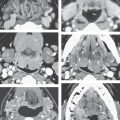
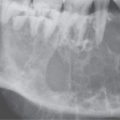
FIGURE 21.7. Non–contrast-enhanced computed tomography of a teenaged male presenting with nosebleeds and a right nasal cavity mass. The mass grows into the pterygopalatine fossa (arrows in A and B) and causes chronic remodeling of the bordering bone (arrows in C and D). Given the clinical situation, the lesion morphology is essentially diagnostic of juvenile angiofibroma and needs only to be confirmed by angiography to decide on how it will be managed.
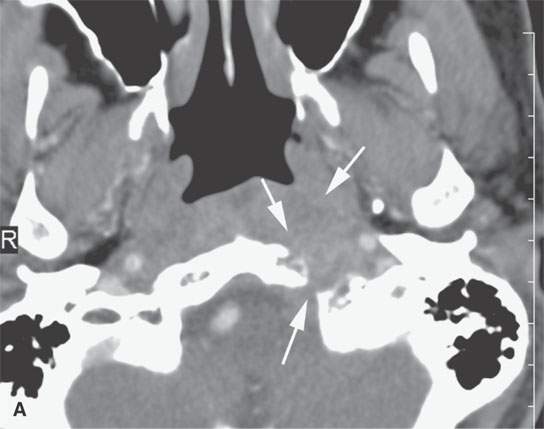
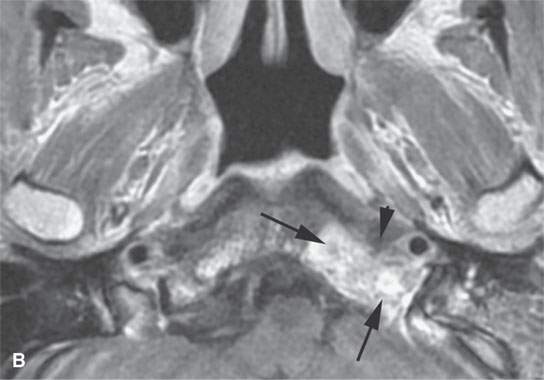
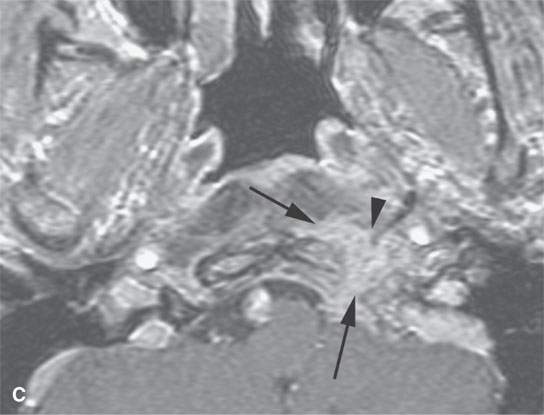
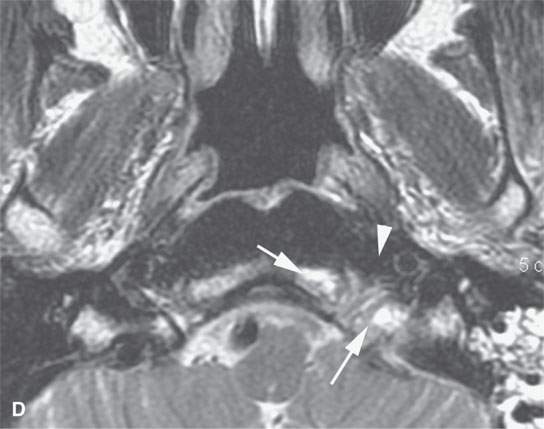
FIGURE 21.8. A patient presenting with unilateral serous otitis media and left Xth and XIIth cranial nerve deficits. A: Contrast-enhanced computed tomography (CT) shows a mass of the left retrostyloid parapharyngeal space invading the skull base (arrows). B: Contrast-enhanced T1-weighted (T1W) image shows the enhancing mass mainly in the skull base (arrow) with a less intense and possibly fibrous component (arrowhead). C: Contrast-enhanced T1W gradient echo image from a three-dimensional Fourier transform acquisition shows the soft tissue component to be more extensive. D: T2-weighted image shows the brighter component (arrows) in the skull base and the darker component (arrowhead) in the retrostyloid parapharyngeal space soft tissues. Based on the imaging, it was elected to do a percutaneous CT-guided biopsy of the component in the clivus. It returned squamous cell carcinoma, and the diagnosis of nasopharyngeal carcinoma with skull base invasion was made. This case illustrates the tendency for enhancing cancers to become isointense with fat within or outside the skull base.
Perineural spread can also take malignancies far from the site of tumor origin and well beyond the limits of even the most skilled clinician’s physical examination (Figs. 21.9–21.11).3
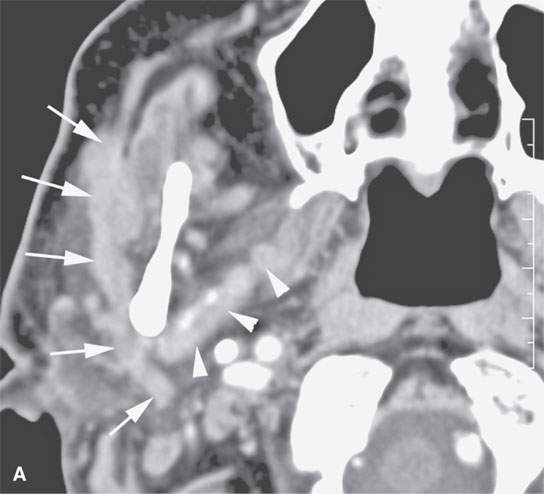
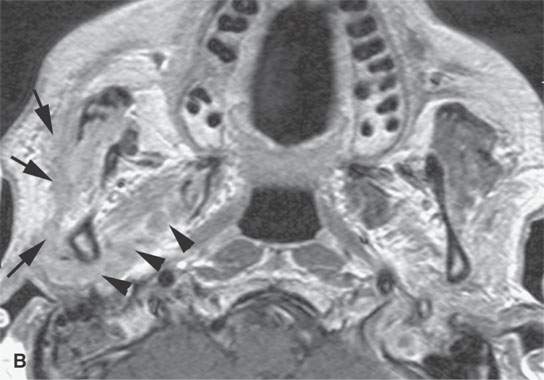
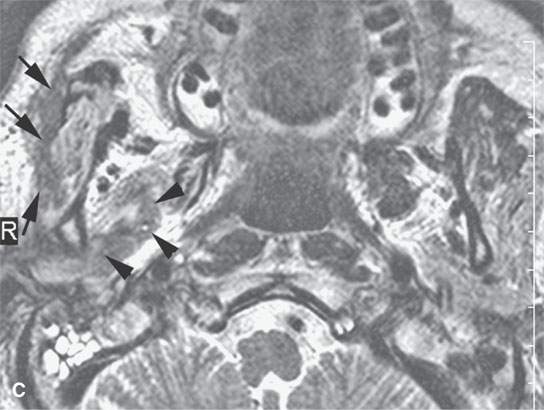
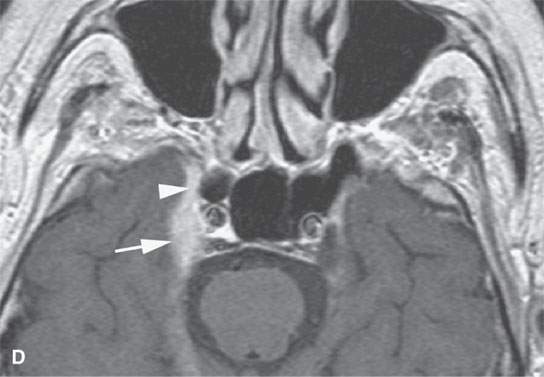
FIGURE 21.9. A patient with peripheral fifth and seventh cranial nerve weakness for over 1 year with two prior magnetic resonance imaging (MRI) studies interpreted as showing only a cavernous sinus mass; the patient was scheduled for a craniotomy. These following computed tomography (CT) and MRI studies done within a month of the latest prior study showed perineural spread of a neurofibrosarcoma along the fifth and seventh cranial nerves. The confirmatory procedure was changed to a percutaneous CT-guided biopsy, but open biopsy of the facial nerve was necessary for a complete final pathologic diagnosis. A: Contrast-enhanced CT shows tumor spreading along the facial nerve (arrows) to its junction with the auriculotemporal nerve and then along the mandibular division of the trigeminal nerve (arrowheads). B: Contrast-enhanced T1-weighted (T1W) image shows tumor spreading along the facial nerve (arrows) to its junction with the auriculotemporal nerve and then along the mandibular division of the trigeminal nerve (arrowheads). C: T2-weighted image shows tumor spreading along the facial nerve (arrows) to its junction with the auriculotemporal nerve and then along the mandibular division of the trigeminal nerve (arrowheads). Note that the tumor is about muscle equivalent in signal intensity—a finding unusual in epithelial perineural spread and related to the fibrous component in this neurogenic sarcoma. D: Contrast-enhanced T1W image shows the tumor to have spread to the trigeminal ganglion (arrow) and then anterograde along V2 to the foramen rotundum (arrowhead).
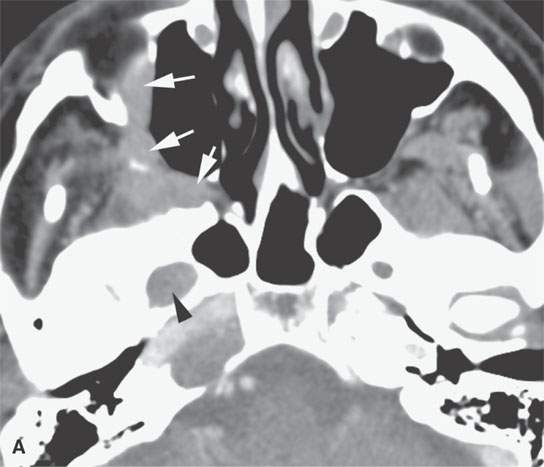
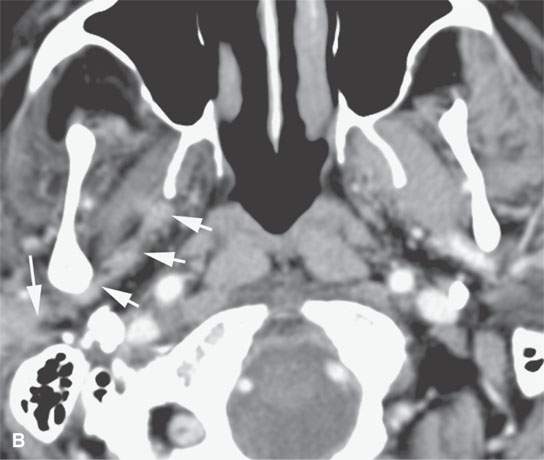
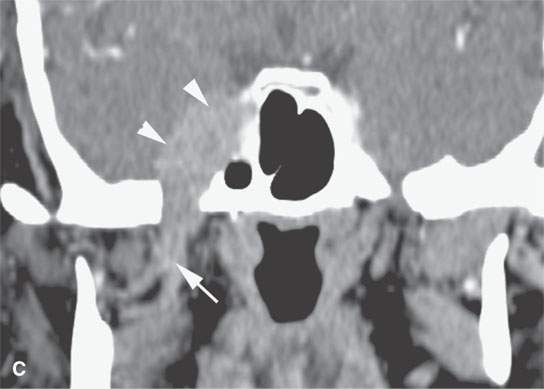
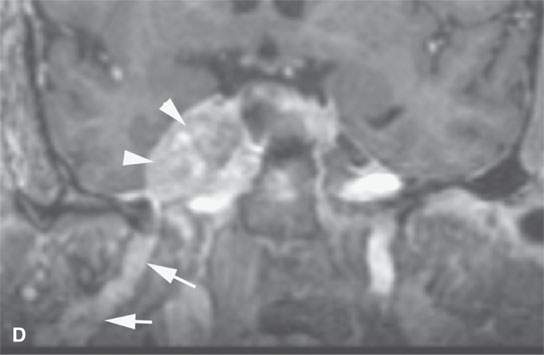
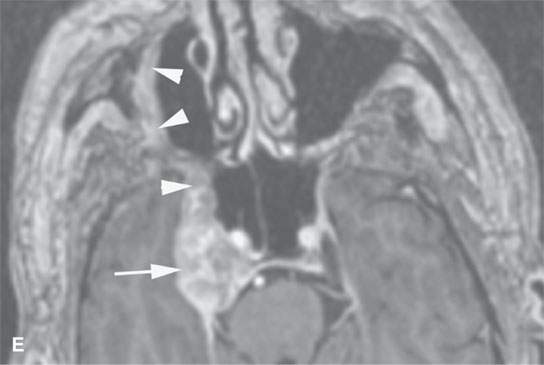
FIGURE 21.10. Imaging studies in a patient with facial pain and a history of remote removal of a skin lesion in the periauricular region of uncertain histology. Prior outside imaging was interpreted as a cavernous sinus meningioma. This study shows an obvious perineural spread pattern. Percutaneous computed tomography (CT)-guided biopsy of the tumor in the pterygopalatine fossa showed perineural malignant melanoma. A: Contrast-enhanced CT shows tumor spreading along the infraorbital nerve (arrows) to the pterygopalatine fossa (arrow) and enlargement of the foramen ovale (arrowhead) B: Contrast-enhanced CT shows tumor spreading along the auriculotemporal nerve and then along the mandibular division of the trigeminal nerve (arrowheads) and toward the foramen ovale. C: Coronal reformations of the CT images show the spread along V3 (arrows) to “blossom” in the cavernous sinus (arrowheads). D: Contrast-enhanced T1W gradient echo coronal image from a 3DFT acquisition shows the tumor to have spread to the trigeminal ganglion arrowheads) along V3 (arrow) E: Contrast-enhanced T1-weighted (T1W) gradient echo axial image from a three-dimensional Fourier transform (3DFT) acquisition shows the tumor to have spread to the trigeminal ganglion (arrow) and then anterograde along V2 through the foramen rotundum and to the peripheral aspect of the infraorbital nerve (arrowheads).
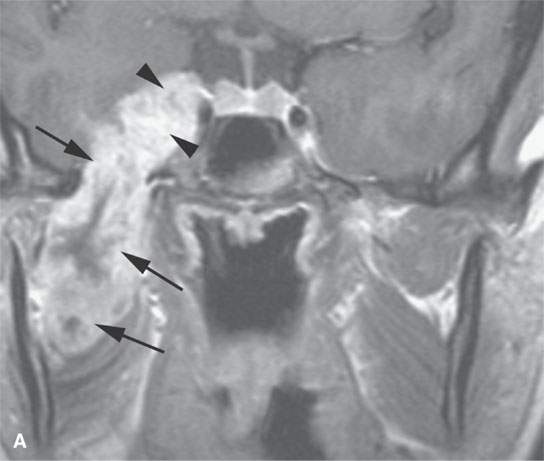
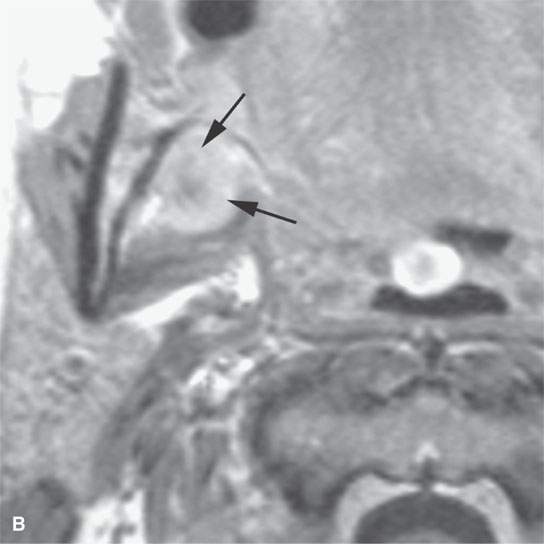
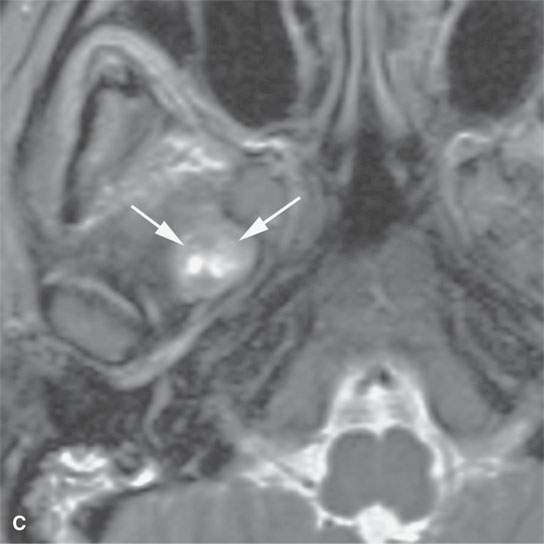
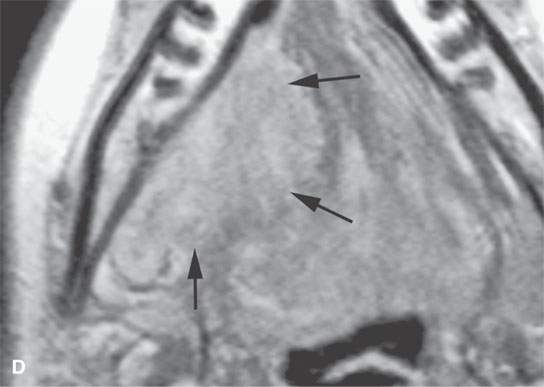
FIGURE 21.11. A young woman with facial pain and what was believed to be a transcranial meningioma based on outside prior imaging studies. This magnetic resonance imaging study showed a primary malignancy of the floor of the mouth with spread along the lingual nerve to V3 and then the trigeminal ganglion. It was believed to be a neurogenic sarcoma on the basis of the imaging but turned out to be a rhabdomyosarcoma of the floor of the mouth with perineural spread of tumor. The imaging findings dramatically altered the treatment plan. A: Contrast-enhanced T1-weighted (T1W) image shows tumor spreading along V3 (arrows) to its junction with the trigeminal nerve ganglion (arrowheads). B: Contrast-enhanced T1W image shows tumor spreading along the lingual nerve (arrows). C: T2-weighted image shows tumor spreading along V3 to the foramen ovale (arrows). D: Contrast-enhanced T1W image shows the tumor’s origin in the floor of the mouth (arrows).
In cancer patients, imaging can also provide an objective assessment of all cervical and retropharyngeal nodes proven for some time, although itself an imperfect method, to be far more accurate than the physical examination (Fig. 21.12).The extent of nodal disease is often crucial to both therapy and prognosis, and high-quality, detailed imaging can improve the accuracy of clinical staging of cervical and retropharyngeal nodal metastasis (Fig. 21.13).
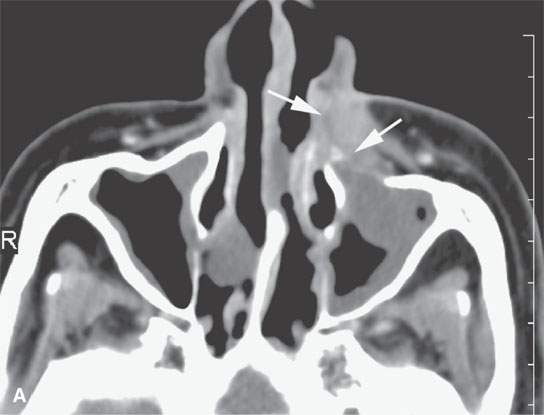
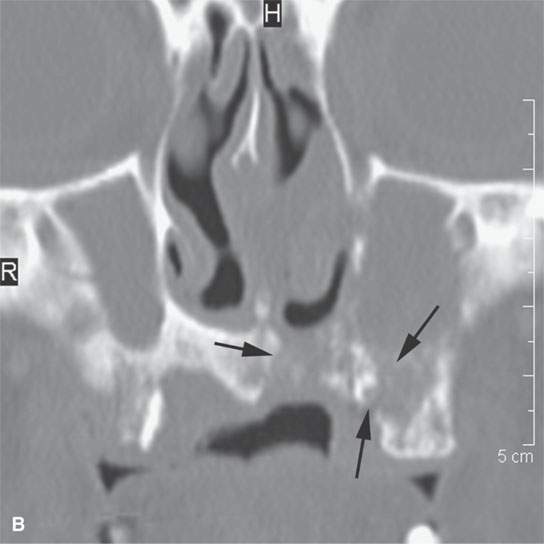
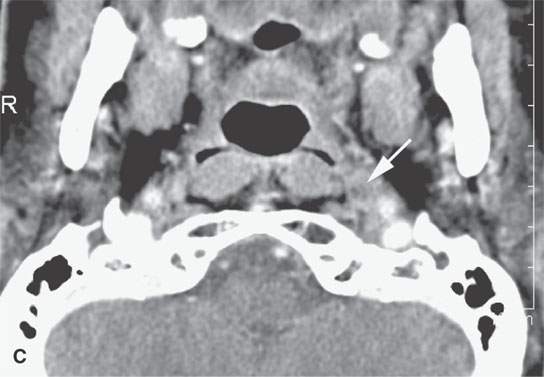
FIGURE 21.12. Contrast-enhanced computed tomography in a patient with nasal vestibule cancer invading deeply and into bone (arrows in A and B). The metastatic retropharyngeal node (arrow in C) significantly altered the postsurgical radiotherapy treatment plan.
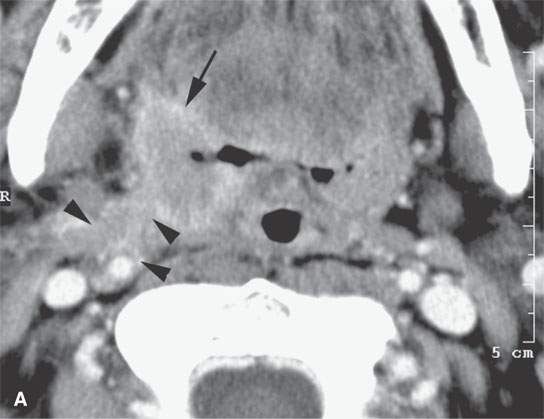
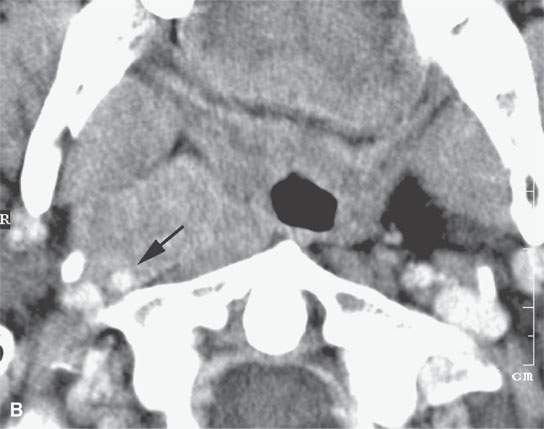
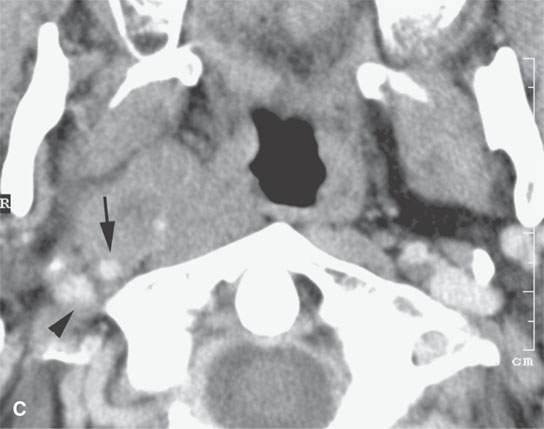
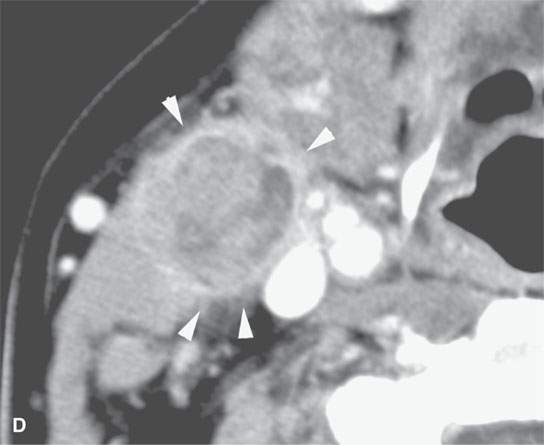
FIGURE 21.13. Contrast-enhanced computed tomography in a patient with tonsillar squamous cell carcinoma. A: The indistinct margins are a sign of aggressive behavior. The tumor breaks out of the tonsillar bed to invade along the stylopharyngeus muscle to the carotid sheath (arrowheads). B, C: The tumor continues to spread in the parapharyngeal space along the carotid sheath within the retrostyloid parapharyngeal space (arrows). D: The metastatic lymph node also reflects the aggressive nature of the cancer showing extranodal spread manifesting as indistinctness in the perinodal soft tissues (arrowheads).
Finally CT, MRI, and FDG-PET may be used to follow patients under treatment to monitor tumor response and try to detect recurrent or persistent disease before it becomes symptomatic and, hopefully, at a time when salvage therapy for cure is possible (Fig. 21.14). Each of these issues will now be considered in more detail.
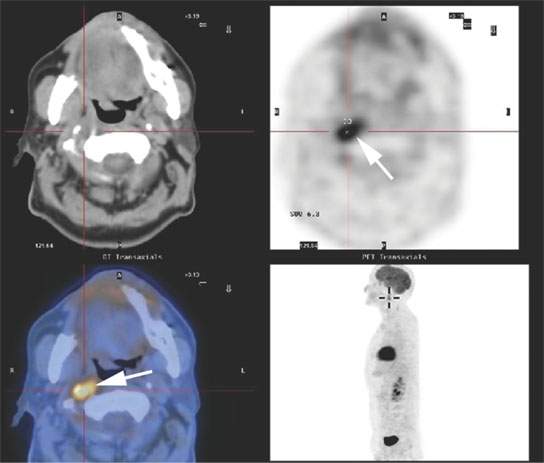
FIGURE 21.14. A patient treated for head and neck cancer developed right suboccipital headaches about 1 year after treatment. Fluorine-18 2-fluoro-2-deoxy-D-glucose positron emissio tomography (FDG-PET) study showed the failure to be in the retropharyngeal node on the right (arrow).
BASIC TUMOR MORPHOLOGY AND SPREAD PATTERNS: MAINLY COMPUTED TOMOGRAPHY AND MAGNETIC RESONANCE APPEARANCE
Frequently, the decision must be made to use either CT or MR as the primary tool for evaluating a particular tumor or site. Several factors contribute to making this choice. The contrast between tumor and normal tissue is one of the more important factors. On non–contrast-enhanced CT, most tumors appear to be roughly the same density as muscle. Vague areas of fluid density somewhat less than the “tissue density” of muscle may be visible within the mass. This trend is of little practical use since non–contrast-enhanced CT is hardly ever used to evaluate cancer. Contrast between fluid and solid elements of the tumor and the much lower density fat will be excellent on CT. Contrast between tumor and lymphoid tissue such as the tonsils and adenoids will generally be poor. The tendency for poor contrast between tumor, muscle, and lymphoid tissue severely limits the value of non–contrast-enhanced CT. If contrast-enhanced computed tomography (CECT) is not possible, then contrast-enhanced magnetic resonance (CEMR) is the preferred imaging tool.
On CECT, most tumors will accumulate iodine to a greater extent than surrounding muscle; thus, CECT improves tumor to muscle contrast (Figs. 21.14 and 21.15). Many tumors will invoke an inflammatory response at their interface with normal tissues. This enhancing margin further improves tumor to muscle contrast and may help in evaluating the aggressiveness of a lesion particularly at tumor–muscle and tumor–fat interfaces. Similar improvement in contrast between tumor and lymphoid tissue may occur, but lymphoid tissue, when inflamed, will also enhance, so there is no guarantee of improved tumor–lymphoid tissue contrast (Fig. 21.15). An exception is the proven value of CECT in demonstrating focal metastatic deposits in normal size, untreated lymph nodes; in these cases, the reactive node parenchyma typically enhances to a greater degree than metastatic foci (Fig. 21.16). Marked enhancement may suggest a more uncommon etiology than the ubiquitous epithelial malignancies that involve the head and neck regions (Fig. 21.17). The degree of enhancement as a marker of perfusion and surrogate for capillary and angiogenesis on CECT has more recently been offered, at least experimentally, as a factor that might help predict response to radiotherapy.
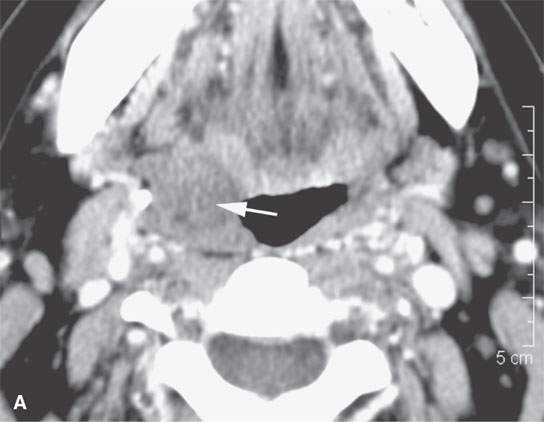
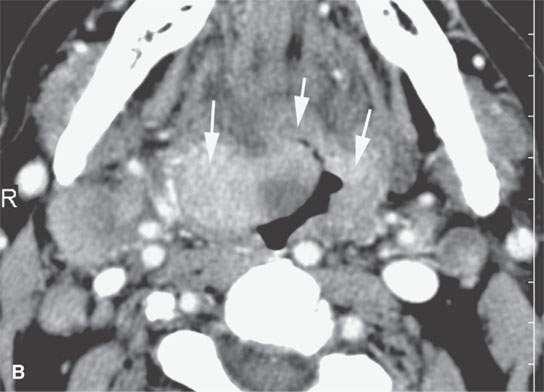
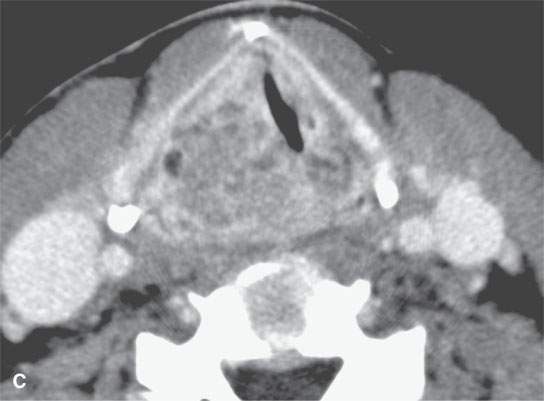
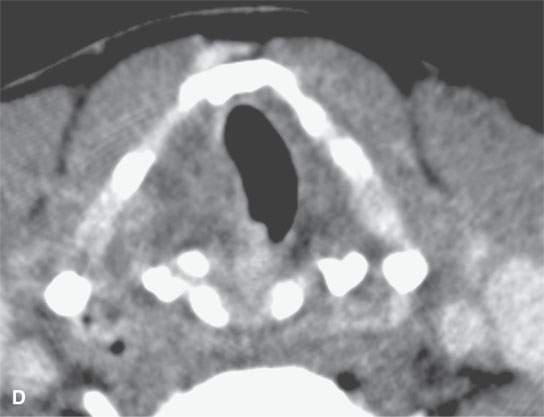
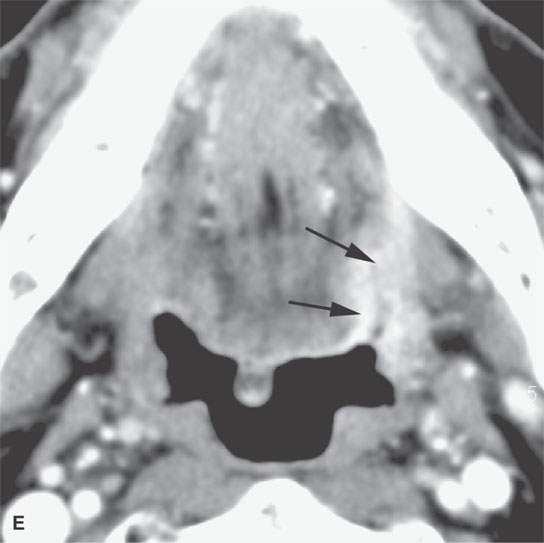
FIGURE 21.15. Contrast-enhanced computed tomography showing the range of enhancement possible in various epithelial-origin mucosal-based cancers. A: Adenoidcystic carcinoma of the tongue base. Note how this microcystic lesion is slightly lower in density than muscle (arrow). B: Tongue base squamous cell carcinoma (SCCA) showing areas of variable enhancement (arrows). C, D: Mixed pattern of enhancement in this poorly differentiated laryngeal cancer. E: Fairly brisk enhancement in this posterior oral tongue SCCA that was ulcerative clinically (arrow).
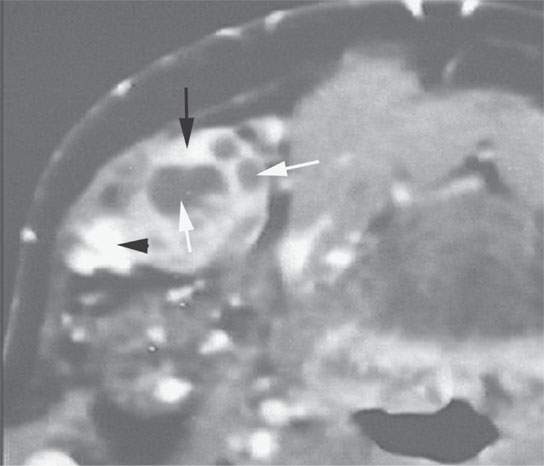
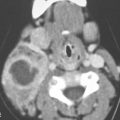
FIGURE 21.16. Contrast-enhanced computed tomography of squamous cell carcinoma metastatic to a level 1 lymph node showing focal enhancement (black arrow), focal lucencies (white arrows), and focal calcification or keratin debris (arrowhead))—all indicators of metastatic disease.
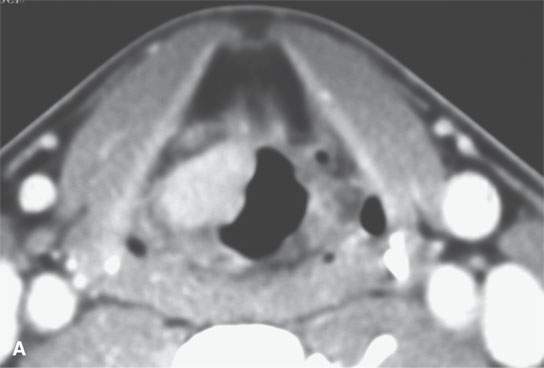
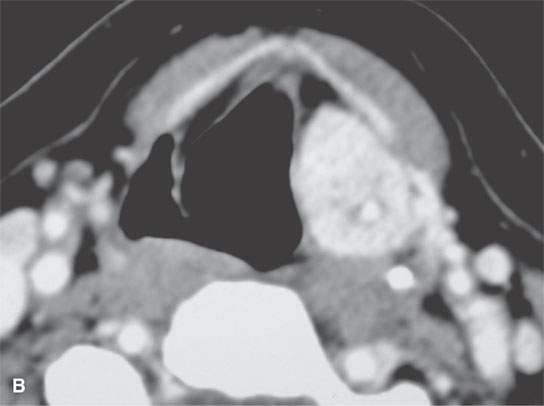
FIGURE 21.17. Contrast-enhanced computed tomography of two markedly enhancing lesions, with the degree of enhancement being somewhat unusual for an epithelial tumor. A: Submucosal laryngeal leiomyosarcoma. B: Paraganglioma of the aryepiglottic fold. Note the very large superior laryngeal vascular pedicle (Arrowsarrows).
A main benefit of MRI is that image contrast is based on several intrinsic factors (T1, T2, proton density, flow) as opposed to one (electron density), as with CT as discussed in Chapters 1–3). Intravenous contrast may also be used with MR, but contrast between tumor and normal tissues can be varied by simply manipulating the pulse sequences. Non–contrast-enhanced T1-weighted (T1W) MR images generally provide suboptimal contrast between tumor and muscle or lymphoid tissue and excellent contrast between tumor and fat (Fig. 21.18 and Table 21.1). Short TI inversion recovery (STIR) images may improve tumor to muscle contrast while maintaining good tumor to fat contrast but are also limited in usefulness for technical reasons. T2-weighted (T2W) fast spin echo (FSE) images provide excellent tumor to muscle contrast; however, T2W FSE images inherently diminish the tumor to fat contrast unless they are fat suppressed using frequency selective fat suppression (Fig. 21.18). Exceptions to this are tumors with areas of necrosis, or micro- or macrocystic components, where these “cystic” components stay relatively hyperintense to fat even on T2W FSE images (Fig. 21.19). Most nonnecrotic solid neoplasms will show signal intensities that roughly parallel that of fat and lymphoid tissue on T2W sequences; however, some may be closer to muscle, especially if there is a relatively fibrous stromal component or the tumor is inherently fibrous (Fig. 21.9C). Contrast between tumor and lymphoid tissue may be poor on T2W MR (Fig. 21.18). The most obvious example of this is lymphoma, but this tendency is found with most other tumors (Fig. 21.20 and Table 21.1)
TABLE 21.1 CONTRAST BETWEEN AN “AVERAGE” LESIONa AND ADJACENT STRUCTURES/TISSUES
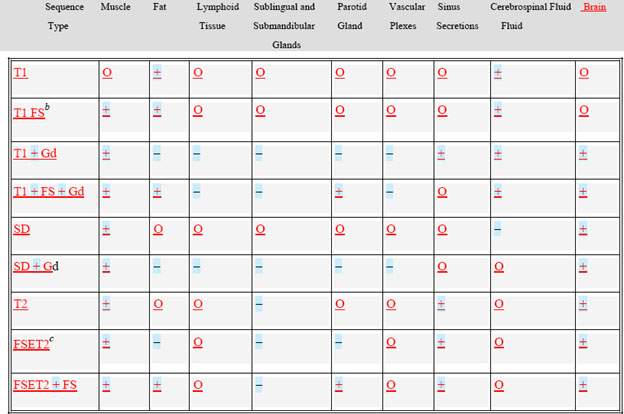
O, not predictable but helpful at times; +, predictably good contrast in most cases; FS, fat suppression; Gd, gadolinium; –, potentially misleading and must usually compare with one or two other sequences to be sure that the pathology is not going unnoticed; SD, spin density; FSE, fast spin echo.
a“Lesion” includes a benign/malignant tumor and inflammatory/infectious processes arising extracranially.
bFat suppression done with frequency selective saturation pulse.
cFSET2 represents fast spin echo T2 without fat saturation.
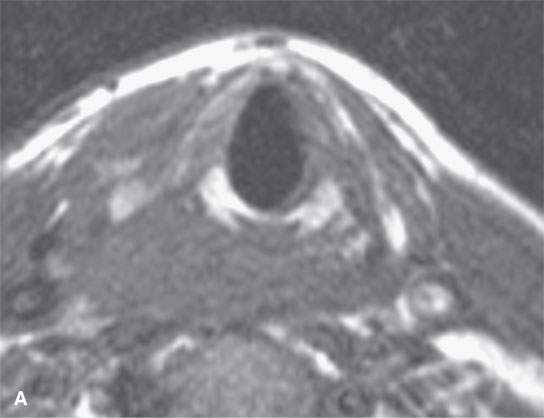
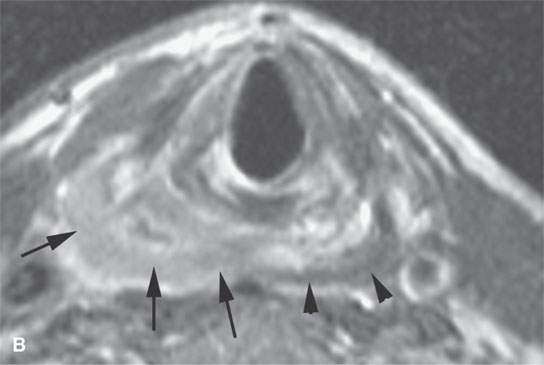
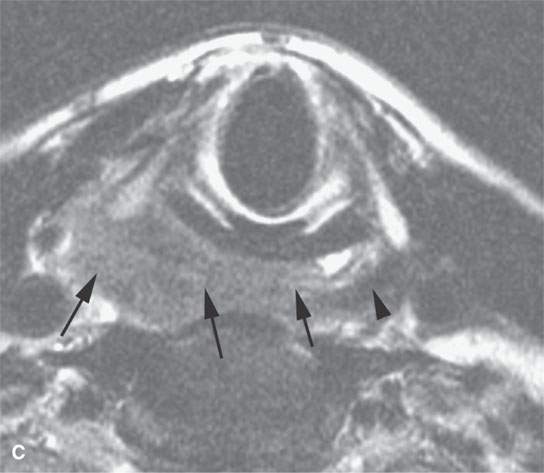
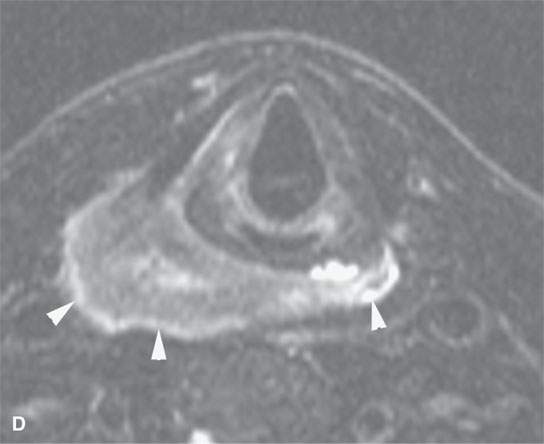
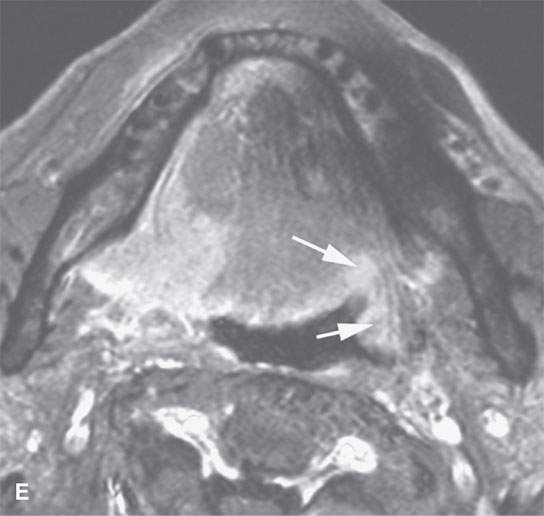
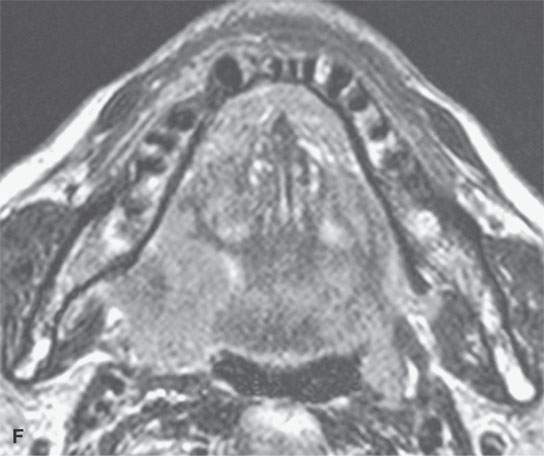
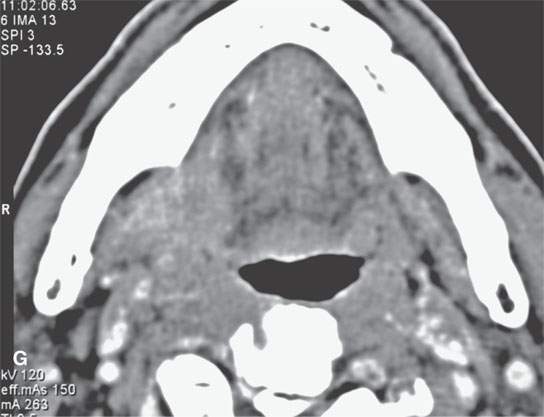
FIGURE 21.18. General trends of contrast enhancement of squamous cell carcinoma (SCCA) and malignancies in general as seen on magnetic resonance imaging in a pyriform SCCA (aA—dD) and tongue base SCCA (eE—gG). A: Non–contrast-enhanced T1-weighted (T1W) image shows poor tumor to muscle contrast. B: Contrast-enhanced T1W image shows enhancing tumor (arrows) contrasts well with muscle (arrowheads). C: T2-weighted (T2W) image shows fairly good tumor (arrows) to muscle (arrowhead) contrast. D: Fat-suppressed T2W image improves on the contrast seen in (cC) and shows peritumoral edema better (arrowheads). E: Contrast-enhanced fat-suppressed T1W image shows excellent tumor to muscle contrast but relative poor contrast with normal lymphoid tissue (arrows). F: T2W image shows good tumor to muscle contrast but relatively poor contrast with normal lymphoid tissue (arrow). G: Contrast-enhanced computed tomography for comparison with (e E) and (fF).
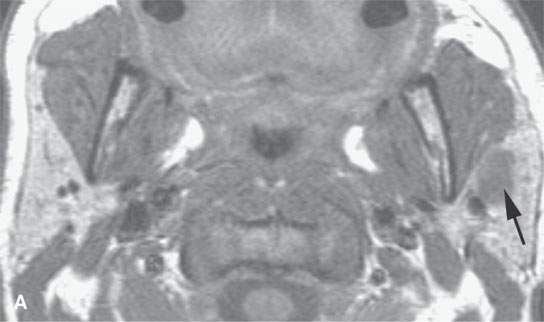
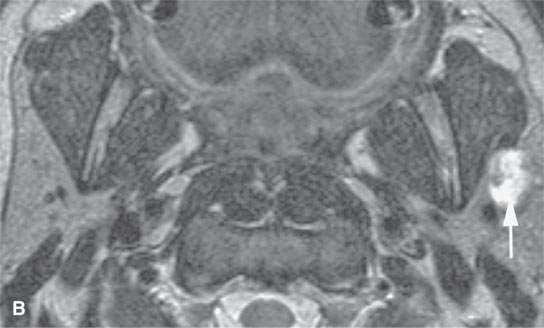
FIGURE 21.19. Magnetic resonance imaging of a patient with a benign mixed tumor of the parotid (arrows), with the microcystic nature of the tumor better appreciated by the increased signal intensity on the T2-weighted image in (bB) compared with the noncontrast T1-weighted image in (A).
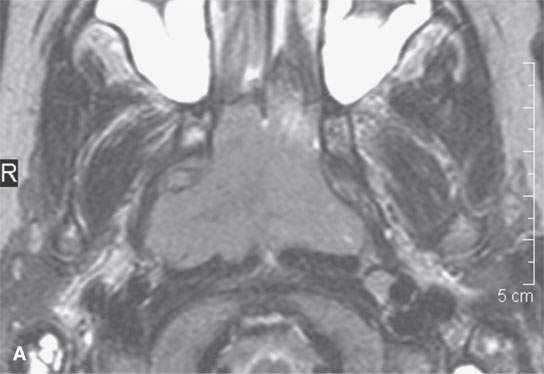
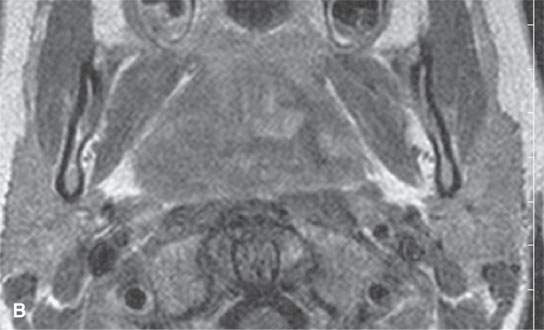
FIGURE 21.20. Magnetic resonance imaging of a patient with Burkitt lymphoma showing that on the T2-weighted image in (aA), the tumor is about the same signal intensity and normal lymphoid tissue but on the T1-weighted contrast-enhanced image (B) shows an inhomogeneous pattern different from that usually seen in normal lymphoid tissue.
Gadolinium CEMR behaves in a manner similar to that described for CECT. Tumor to muscle contrast is improved on contrast-enhanced T1W images with the margins and internal morphology of the lesion becoming more apparent (Fig. 21.18). However, since fat is bright on T1W images, CEMR will diminish the contrast between tumor and surrounding fat. This may cause a significant problem in evaluating tumors in extracranial locations or those invading bones containing fatty marrow such as the mandible and skull base (Fig. 21.8).
Fat suppression techniques can be used with T1 or T2W pulse sequences to overcome some of the difficulties with tissue contrast that were just discussed. Fat suppression techniques are not a cure-all, and the ideal single pulse sequence for evaluating all head and neck neoplasms does not yet exist. Also fat suppression techniques all suffer from problems with susceptibility artifacts.
In summary, the contrast between various tumors and surrounding tissue will vary with the tumor histology, size, growth pattern, and natural history of the lesion. Some specific factors that will influence the appearance of particular tumors to be discussed in subsequent sections of this chapter include cellular elements, stromal elements, an acinar or microcystic morphology, macrocystic components or necrosis and cyst contents, hemorrhage, naturally occurring paramagnetic substances, calcification or ossification, growth pattern and peritumoral reactive changes, prior treatment, and the use of intravenous contrast enhancement. The physical basis of some of these factors is considered in the technical section and other discussions in Chapters 1 through 5 and 10 through 12.
While FDG-PET is useful for decision making in some head and neck cancer patients, it is not on its own sufficient for showing the extent of the primary tumor, including bone destruction and perineural spread. The physiologic data from FDG-PET can be fused to CT and MRI data sets or acquired simultaneously to help refine the gross anatomic limits of metabolically active tumor.
US is only of limited use in evaluating primary malignant and benign tumors. It is used primarily in the thyroid and major salivary glands. Some practices find it useful in the routine evaluation of cervical nodes. Its use in exploring the elastic properties of tumors as a measure of their invasiveness or simply for differential diagnosis is in the early stage of clinical investigation.
INTERNAL MORPHOLOGY OF NEOPLASMS
Most tumors grow as a discrete mass. They are generally shaped like a sphere or solid ellipse, even when malignant, but may be modified by surrounding anatomy; the growth patterns that result are discussed subsequently (Fig. 21.21). The mass will have an internal appearance on CT or MR based on the major factors discussed previously and technical factors related to image acquisition.
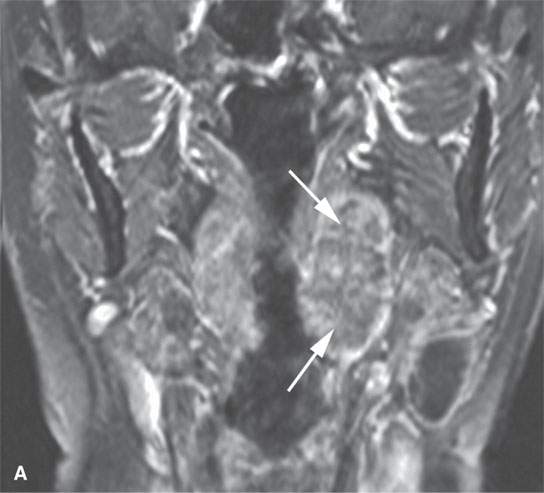
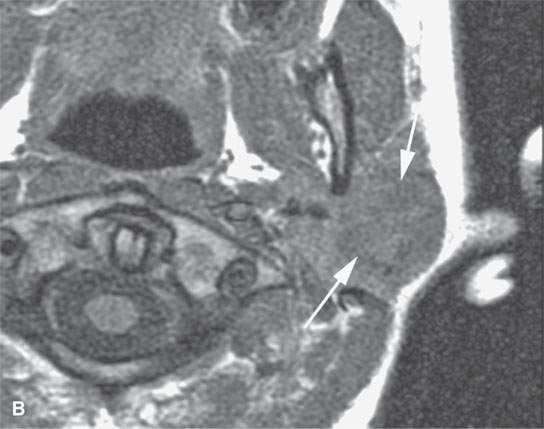
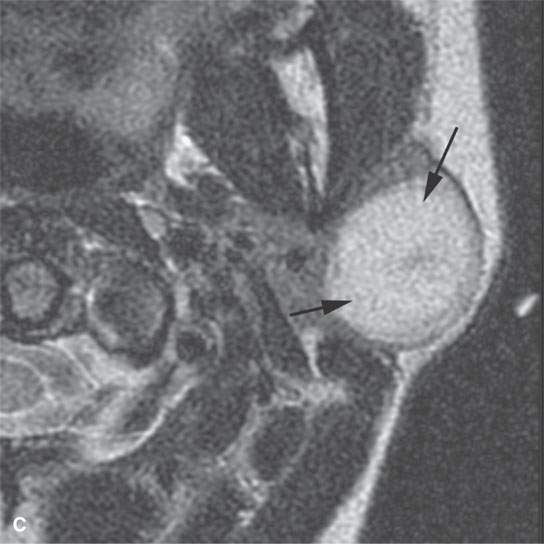
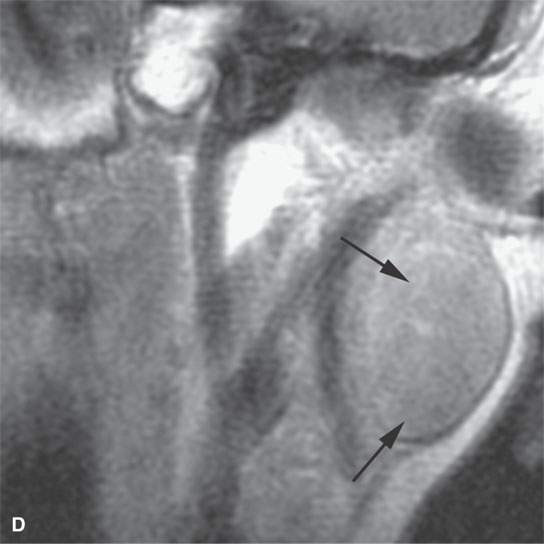
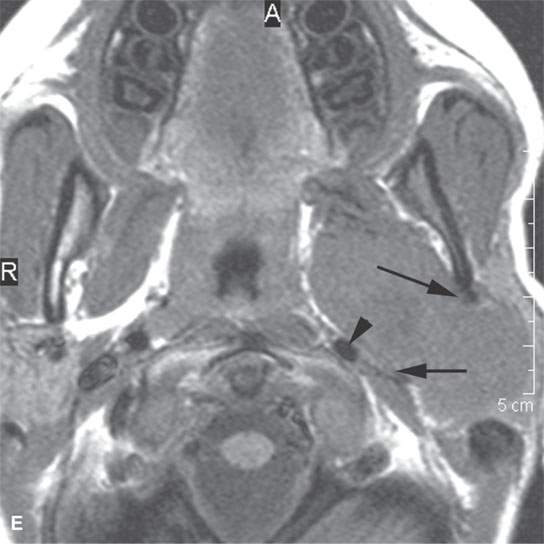
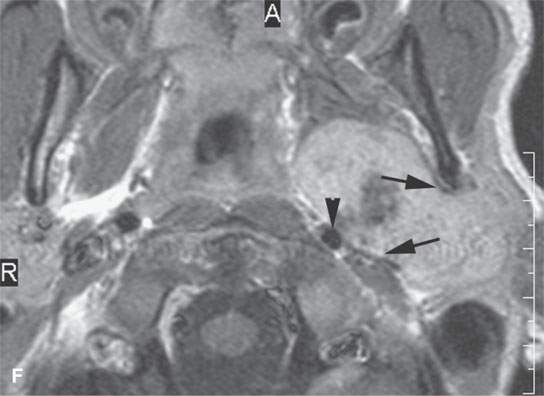
FIGURE 21.21. Magnetic resonance imaging studies showing the general tendency of tumors to grow as a spheroid unless constrained by surrounding anatomy. A: Contrast-enhanced T1-weighted (T1W) image of a tonsillar squamous cell carcinoma (arrows). B–D: Magnetic resonance and acinic cell parotid cancer (arrows))—non–contrast-enhanced T1W, T2-weighted, and contrast-enhanced T1W coronal, respectively. E, F: Non–contrast-enhanced T1W and contrast-enhanced T1W images of a parapharyngeal benign mixed tumor with the large egg-shaped tumor conforming in its midsection (arrows) as it extends through the stylomandibular tunnel. Note the tendency of the mass to displace surrounding structures such as the carotid artery (arrowhead) in a manner that suggests its site of origin and in that alone suggests a narrow differential diagnosis.
Homogeneously solid tumors on gross appearance may show tremendous differences histologically. Such differences in microscopic structure will usually affect the MR appearance of the lesion to a far greater degree than the CT appearance. Tumors composed of tightly packed cells, with relatively little water in the cytoplasm and little stroma, will usually be isodense to muscle on non–contrast-enhanced CT and isointense to slightly hyperintense to muscle on non–contrast-enhanced T1W images (Figs. 21.1A and 21.4A). T2W FSE images will show such a lesion to be roughly isointense to fat, slightly hyperintense to muscle, and likely slightly less intense than lymphoid tissue (Figs. 21.1, 21.2, 21.5, 21.17, and 21.18). These trends are those most commonly present in squamous cell carcinoma (Table 21.1). The tumor cells may also have a large amount of watery cytoplasm. A good example is the heavily mucoid-laden cell population of a chordoma. The more voluminous or watery cytoplasm cause such tumors to have higher signal intensity on heavily T2W images than the more common variety of tumor cell population (Fig. 21.22). Densely cellular tumors with limited stromal volume tend to show restricted diffusion.
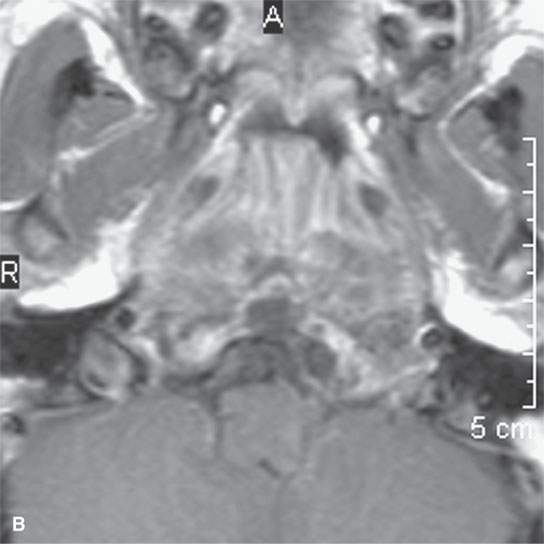
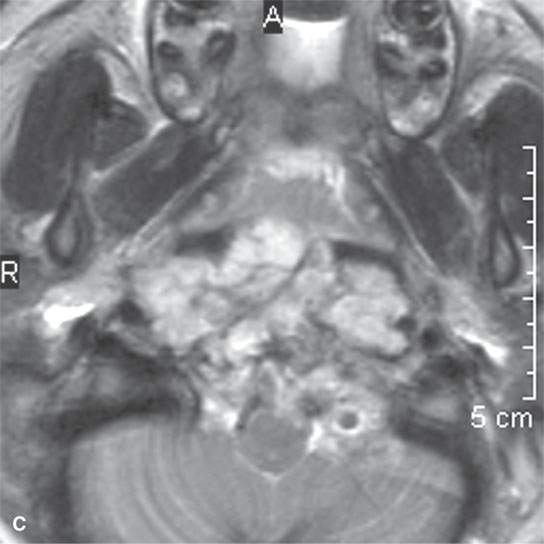
FIGURE 21.22. A–C: Magnetic resonance imaging of a chordoma of the lower clivus, with the “watery” nature of the tumor cells and stroma much more apparent by the way of its signal intensity approaching and matching that of cerebrospinal fluid in some areas on the T2-weighted image in (cC) than on the non–contrast-enhanced (aA) and contrast-enhanced (bB) T1-weighted images.
Tumor cells may be mixed with a neoplastic or reactive stroma. The appearance of CT and T1W images may due to differences in stromal elements as well as the neoplastic cell population. For instance, a water-rich stroma may cause the lesion to appear somewhat hypointense to muscle on T1W images. Variations in stromal structure can greatly alter the appearance on T2W images. At the extremes of this are the very watery mucoid matrix of chordoma that causes the tumor to appear bright (Fig. 21.22) and often partially calcified fibrous matrix of fibro-osseous lesions that make them appear sometimes muscle equivalent on heavily T2W images (Fig. 21.23). Reactive fibroproliferative processes that may mimic tumor can have even a more densely collagenous makeup and profoundly low signal intensity on T2W images—a characteristic that is distinctly uncommon in all but a very few benign and malignant neoplasms (Fig. 21.24). One can extrapolate from these extreme examples the varied appearances that result from lesser amounts of fluid, cells, or fibrosis in a tumor matrix or stroma.
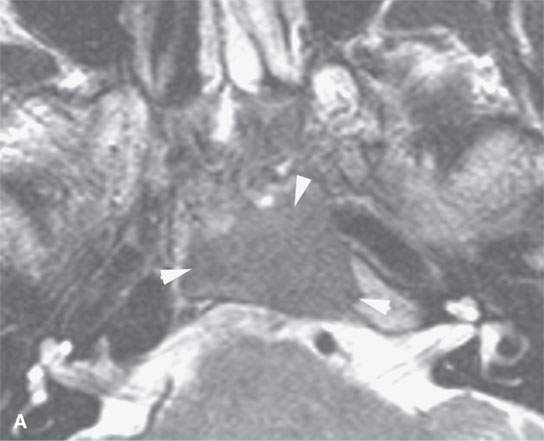
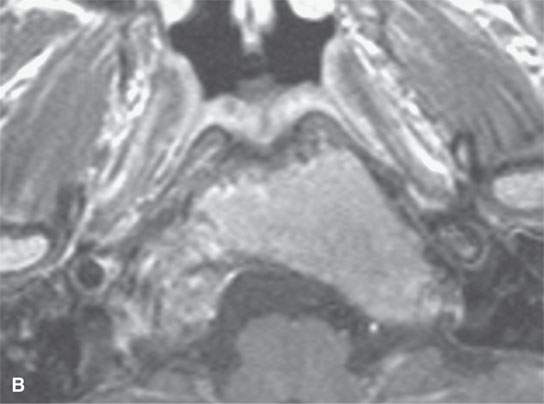
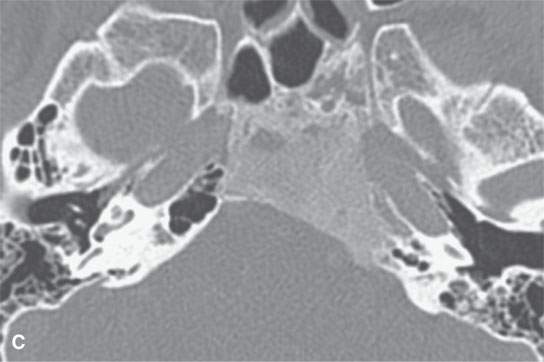
FIGURE 21.23. Magnetic resonance imaging of fibrous dysplasia of the lower clivus, with the fibrous and mineralized matrix nature of the process (arrowheads) much more apparent on the T2-weighted image by way of its diminished signal intensity relative to fat and near to that of muscle in (aA) than in the contrast-enhanced (bB) T1-weighted image. C: Computed tomography for comparison.
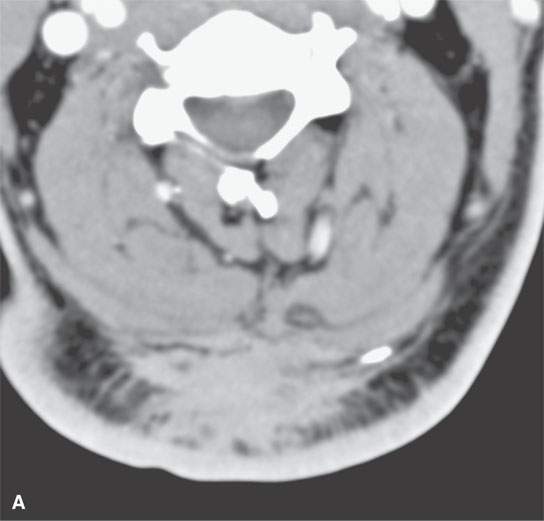
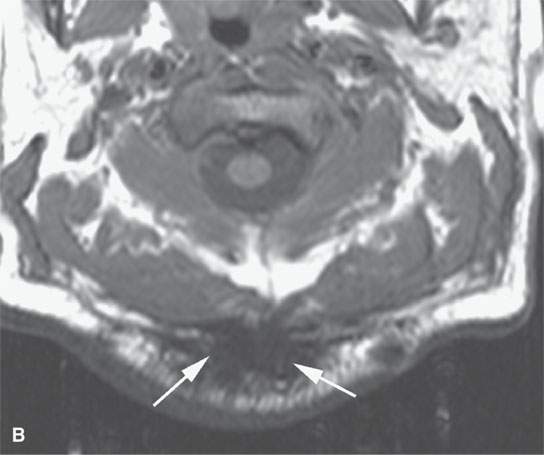
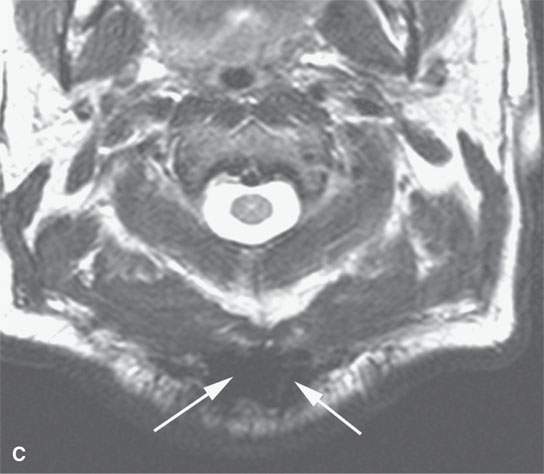
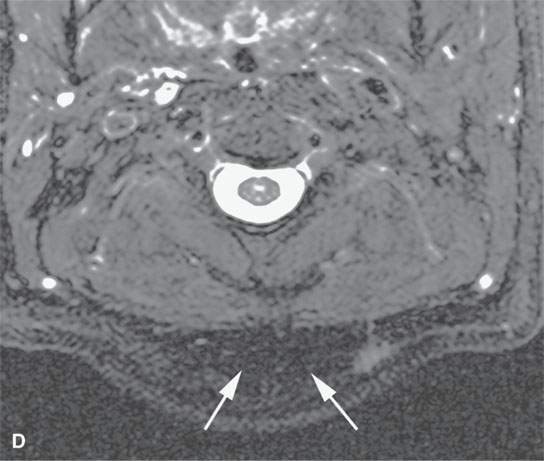
FIGURE 21.24. A–D: A patient with very intense fibroproliferative changes, with the fibrous nature of the mass much more obvious on magnetic resonance imaging (b-dB–D) than computed tomography (CT) (aA) based on its markedly diminished signal intensity relative to muscle on all pulse sequences (arrows). On CT, its density is actually slightly greater than that of muscle. Also note the very aggressive margins in this benign process compared with the pushing, well-defined margins of many malignancies illustrated in this chapter.
Tumors may be nearly entirely or partially microcystic. A classic example is the proliferative hemangioma (Fig. 21.25). These true neoplasms may appear slightly hypointense to muscle on T1W images. The effect of the increased fluid in myriad microscopic vascular spaces is most noticeable as markedly increased signal intensity on heavily T2W images. This reasoning can be extrapolated to thyroid adenomas and papillary-follicular carcinoma and epithelial salivary gland tumors (Chapter 22) among others. These tumors may contain colloid, microcysts, acini, or vascular spaces filled with fluid-rich contents that will have high signal intensity on T2W images with the actual signal intensity seen dependent on the relative amount of macromolecules and bound and unbound water present in the respective “cystic spaces.”
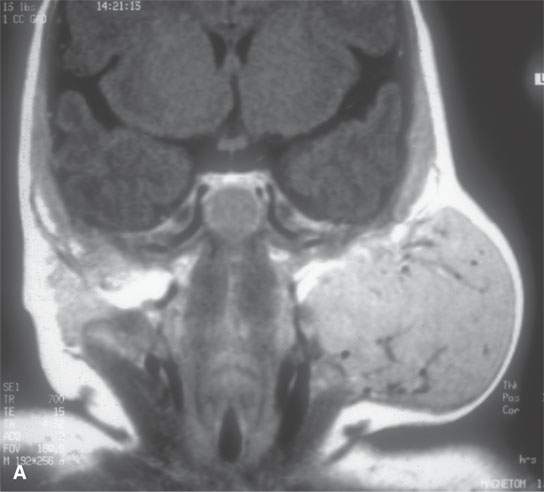
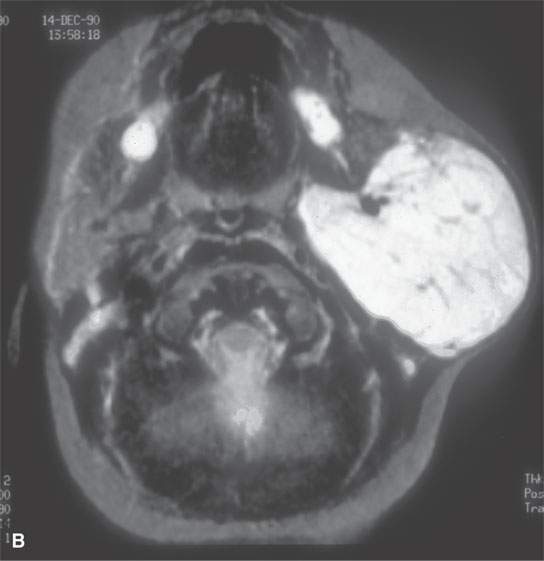
FIGURE 21.25. Magnetic resonance imaging of a parotid proliferative hemangioma, with the contrast-enhanced T1-weighted image in (A) reflecting the blood pool nature of its many tiny cystic spaces filled with relatively static blood and the T2-weighted image in (B) showing the intensely bright signal again reflecting the basically microcystic nature of the mass.
Related posts:
 Preseptal Compartment: Acute and Chronic Infections and Noninfectious Inflammatory Conditions
 Necrotizing (“Malignant”) Otitis Externa
 Cervicothoracic Junction: Brachial Plexus Trauma
 Oropharynx: Introduction
 Branchial Apparatus Developmental Anomalies
 Mandible and Maxilla: Odontogenic Tumors and Cysts
Stay updated, free articles. Join our Telegram channel

Full access? Get Clinical Tree


