Etiology
Although benign hepatic tumors have been classified into several histiotypes according to their cell of origin (i.e., hepatocytes, biliary epithelium, or mesenchymal cells), our focus in this discussion is on those lesions most frequently encountered in clinical practice, including simple (nonparasitic) cyst, hemangioma, hepatocellular adenoma, focal nodular hyperplasia (FNH), large benign regenerative nodules, and hepatic abscess ( Table 36-1 ).
| Neoplasm | Sex | Age | Capsule | Size | Number | Calcifications | Fat | Scar | Bleed | Associated Signs and Predisposing Factors |
|---|---|---|---|---|---|---|---|---|---|---|
| Hepatic cyst | F > M | 5th-6th decade | No | Variable | One or few | Rare (peripheral) | No | No | Rare | Congenital |
| Cavernous hemangioma | F > M | 2nd-5th decade | No | Variable (3-20 cm) | One or few | Sometimes in large ones | No | Rare (larger lesions) | No | Congenital |
| Capillary hemangioma | F > M | 2nd-5th decade | No | Usually smaller than 2 cm | One or few | No | No | No | No | Congenital |
| Focal nodular hyperplasia | F ≫ M | 3rd-4th decade | No | 3 cm (1-14 cm) | One or few | 1% | Very rare | Present in 50% Hyperintense on T2-weighted images and on delayed post–gadolinium T1-weighted images | No | Vascular abnormality |
| Hepatocellular adenoma | F ≫ M | 3rd-4th decade | 25% | 5.5 cm | One or few | 5% | Often | No | Yes | Oral contraceptives assumption |
| Large benign regenerative nodules | F > M | 3rd-4th decade | No | 0.5-4 cm | Multiple | No | No | Larger lesions | No | Budd-Chiari syndrome and other vascular disorders |
| Pyogenic abscess | F = M | 5th-7th decade | Yes | Variable | One or few | No | No | No | No | Bacterial |
Clinical Presentation
Most benign hepatic tumors are an incidental finding in asymptomatic patients during imaging workup for an unrelated medical problem. Larger lesions may occasionally produce signs and symptoms related to mass effect, such as abdominal discomfort and pain.
Hepatocellular adenoma (HCA) can manifest as acute onset of abdominal pain after intratumoral hemorrhage, whereas hepatic abscess is often accompanied by fever and leukocytosis.
Imaging
Although combining multiple imaging studies allows a confident diagnosis in the majority of cases, atypical lesions may still represent a diagnostic challenge.
Computed Tomography
With the advent of multidetector computed tomography (MDCT), remarkable improvements have been accomplished with scanning speed, scan volumes, and image quality. As a result, CT currently represents the most commonly used imaging modality for evaluating the liver.
Besides lesion detection, the main goal of CT is to firmly establish a diagnosis of benign hepatic tumors. Indeed, mistaking an incidental benign lesion for a malignant tumor may lead to unnecessary aggressive management or possibly preclude surgery when benign and malignant lesions coexist within the same liver. Although simple cysts can be confidently characterized based only on their appearance on precontrast and single-phase contrast-enhanced CT during the portal venous phase, reliable diagnosis of other benign hepatic tumors generally requires assessment of lesion enhancement pattern with multiphasic contrast-enhanced CT (i.e., hepatic arterial phase, portal venous phase, and delayed phase).
Magnetic Resonance Imaging
Magnetic resonance imaging (MRI) represents a powerful technique for the detection and characterization of either benign or malignant liver tumors. MRI protocol includes pulse sequences that assess different tissue characteristics such as T1 and T2 contrast of liver tumors, as well as assessment of tumor-specific enhancement patterns after intravenous administration of gadolinium-based contrast agents. Diffusion weighted imaging measures the microscopic movement of water molecules, which is related to tissue cellularity and organization. Hepatobiliary contrast materials (gadobenate dimeglumine [Gd-BOPTA] and gadolinium ethoxybenzyl diethylenetriamine pentaacetic acid [Gd-EOB-DTPA]) distribute in the extracellular fluid compartment first and subsequently enter functioning hepatocytes. This provides additional information, especially to differentiate lesions with functioning hepatocytes (i.e., lesions with organic anionic transport proteins) from hepatocellular lesions without organic anionic transport proteins and nonhepatocellular lesions.
Ultrasonography
Because of its high contrast resolution, low cost, and wide availability, ultrasonography frequently represents the primary modality for the study of the liver. However, operator dependency, substantial image degradation in obese patients, and a limited field of view, represent major limitations that explain the low appeal of ultrasonography among referring physicians and surgeons.
Some benign liver tumors, such as simple cysts or hemangiomas, typically demonstrate a classic, virtually diagnostic appearance on ultrasonography. Some other lesions (e.g., FNH) may, however, be difficult to distinguish from normal liver owing to their hepatocellular nature.
Microbubble contrast agents have substantially enhanced the available diagnostic information. Besides the evaluation of tumor enhancement pattern during both arterial and portal venous phases, contrast-enhanced images also can be acquired during a late parenchymal phase with potential improvement of lesion detection.
Specific Lesions
Simple (Bile Duct) Cyst
Etiology
Simple (nonparasitic) cysts likely result from a congenital defective development of the intrahepatic biliary ducts.
Prevalence and Epidemiology
Simple hepatic cysts are among the most common liver lesions, with an estimated incidence of 2.5% in the general population. Although cysts can occur in both sexes at all ages, middle-aged women are more frequently affected (male-to-female ratio, 1:5).
Clinical Presentation
Typically, cysts are incidental imaging findings in asymptomatic patients. Occasionally, larger lesions may produce signs and symptoms related to mass effect, such as abdominal discomfort, chronic pain, nausea and vomiting, or early satiety because of compression of the stomach. Rarely, acute pain can develop after intralesional hemorrhage, spontaneous or traumatic rupture, or secondary infection.
Pathophysiology
Simple cysts originate twice as frequently within the right lobe of the liver than the left lobe.
Pathology
Typically, simple cysts manifest as either solitary or multiple, well-defined lesions, varying in size from a few millimeters to several centimeters. Cysts do not communicate with the biliary tree and typically contain clear fluid. Occasionally, however, cystic content may be mucoid, purulent (if the cyst is infected), or hemorrhagic.
On histologic examination the cyst lining consists of a single layer of columnar or cuboid epithelium, which is identical to bile duct epithelium. Epithelial cells rest on a basement membrane surrounded by a thin fibrous stroma.
Liver Function
Liver function test results are generally unremarkable, although larger cysts may produce mild increase of alkaline phosphatase and bilirubin levels if there is mild mass effect on the intrahepatic biliary ducts.
Imaging
Because of the high incidence in the general population, simple hepatic cysts are frequently discovered on ultrasonography, CT, or MRI of the liver.
Computed Tomography.
On precontrast CT, cysts manifest as rounded or oval, thin-walled, well-defined, water-attenuating (from −10 to +20 Hounsfield units) lesions. Although most cysts are unilocular in appearance, multiple lesions that are clustered together may produce the appearance of a single, multiloculated lesion.
On contrast-enhanced CT, neither the cyst content nor the peripheral wall shows perceptible enhancement ( Figure 36-1 ). Rarely, complicated cysts may show atypical appearances, such as parietal calcifications, mural nodularity, or fluid levels that may resemble a cystic liver tumor or hepatic abscess.
Magnetic Resonance Imaging.
Because cysts are composed almost entirely of fluid, their T1 and T2 values are extremely long, thus explaining the very low signal intensity on T1-weighted images and markedly high signal intensity on T2-weighted images ( Figure 36-2 ). Characteristically, cysts further increase their relative signal on T2-weighted images at longer echo times because of signal suppression from most abdominal parenchymal tissues. Hemorrhagic cysts can show variable signal intensity on T1- and T2-weighted images according to the age of hemorrhage and a fluid/fluid level as a result of mixed blood product. On diffusion weighted images, cysts typically show signal intensity decrease with increasing b-values, and strong hyperintensity on apparent diffusion coefficient (ADC) map.
As in the case of contrast-enhanced CT, simple cysts do not enhance on gadolinium-enhanced MRI. On hepatobiliary phase, cysts remain hypointense relative to the liver and biliary system. The lack of communication between cysts and the biliary tree can be demonstrated on T1-weighted magnetic resonance cholangiopancreatography (MRCP) after administration of hepatobiliary contrast agents, which demonstrate markedly increased signal intensity of the biliary tree and gallbladder but not of the noncommunicating liver cyst.
Ultrasonography.
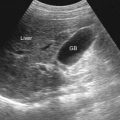
Typically, hepatic cysts manifest as well-defined, anechoic lesions with well-defined margins and posterior acoustic enhancement on gray-scale ultrasonography (see Figure 36-1 ). Complicated cysts may show atypical appearances, such as internal septations, debris, and a thickened wall with or without calcification.
Imaging Algorithm.
An ideal algorithm is presented in Figure 36-15 , at the end of this discussion.
- •
Thin wall
- •
Anechoic cystic content and posterior echo enhancement
- •
No contrast enhancement after intravenous injection of a contrast agent
- •
Fluid filled
- •
Homogeneous
Differential Diagnosis
Clinical findings usually do not contribute to the diagnosis of simple hepatic cysts. Strong hyperintensity on heavily T2-weighted MR images allows differentiation from most hepatic metastases, with the exception of those originating from neuroendocrine tumors. Unlike hepatic abscesses or cystic neoplasms, hepatic cysts manifest with a very thin, almost imperceptible nonenhancing wall, as well as lack of intralesional septa and mural nodules. Polycystic liver disease usually consists of numerous cystic lesions, with size varying from a few millimeters to several centimeters, and is associated with autosomal dominant polycystic kidney disease. Hydatid cyst usually contains several daughter cysts and is surrounded by calcified walls. Biliary hamartomas are usually numerous and smaller than 15-mm cystic lesions, whereas Caroli’s disease will consist of multisegmental biliary dilatation, typically showing the “central dot sign,” owing to a portal venous branch surrounded by a cystic lesion secondary to arrested development of the intrahepatic biliary tree ( Figure 36-3 and Table 36-2 ).
| Features | Hydatid Cyst | Simple Cyst | Pyogenic Abscess | Biliary Cystadenoma | Polycystic Liver Disease | Biliary Hamartomas | Caroli’s Disease |
|---|---|---|---|---|---|---|---|
| Sex | F = M | F > M | F = M | F > M | F > M | M > F | F > M |
| Age | 3rd-4th decade | 5th-6th decade | 5th-7th decade | 2nd-5th decade | 5th-6th decade | Any age | 2nd-3rd decade |
| Frequency | Depend on geographic area | Very common | Common | Rare | Rare | Common | Very rare |
| Clinical Features | Asymptomatic | Asymptomatic | Fever, pain | Asymptomatic | Mass effect | Asymptomatic | Fever (cholangitis) |
| Location | Right lobe > left | All liver segments | Right lobe > left | Right lobe > left | All liver segments | All liver segments | All liver segments |
| Number | Multiple (60%) | Solitary > Multiple | Multiple | Solitary | Multiple | Multiple | Multiple |
| Size | 3-30 cm | 0.5-30 cm | 0.5-10 cm | 1-20 cm | 1-10 cm | <15 mm | 0.5-5 cm |
| Wall calcification | Yes | Rare, peripheral | No | Rare | Rare | No | No |
| Septations | Present | Absent | Present | Present | Absent | Absent | Absent |
| Gas | No | No | Present (20%) | No | No | No | No |
| Inflammatory changes | Absent | Absent | Present | Absent | No | No | No |
| Multiplicity | Possible | Absent | Present | No | No | No | Yes |
| Signs at imaging and associated conditions | Intralesional daughter cysts and wall calcifications | Increased through-transmission on ultrasonography, hypoattenuation to blood pool on unenhanced CT | Cluster sign | Adult recessive polycystic kidney disease | Multiplicity and small (<15 mm) size, congenital hepatic fibrosis, Caroli’s disease | Dot sign, congenital hepatic fibrosis, biliary hamartomas |
Treatment
Medical Treatment.
Because simple cysts are rarely complicated, they should be treated conservatively.
Surgical Treatment.
Percutaneous catheter drainage with alcohol sclerosis can be an effective therapy for larger, symptomatic cysts. Rarely, hepatic cysts are treated surgically, most commonly via laparoscopic fenestration.
- •
Simple cysts are among the most common liver lesions.
- •
Conservative management is warranted with the exception of larger, symptomatic cysts.
- •
Ultrasonography is usually sufficient to confirm or rule out the diagnosis.
Hepatic Hemangioma
Etiology
Hemangiomas are probably congenital in origin, and no definite predisposing factors have been identified. Because they increase with multiparity, female sex hormones have been suggested as a cause.
Prevalence and Epidemiology
Hemangioma is the most common benign hepatic tumor, with an estimated incidence of 5% to 20% in the general population. Although hemangiomas can occur in both sexes at all ages, middle-aged women are more frequently affected, perhaps reflecting the causative effect of female sex hormones.
Clinical Presentation
Typically, hemangiomas are incidental imaging findings in asymptomatic patients. Occasionally, larger lesions may produce signs and symptoms related to mass effect, such as upper abdominal mass, abdominal discomfort, and pain. Rarely, sudden onset with acute pain can develop after either spontaneous or traumatic rupture of larger lesions. Giant hemangiomas can manifest as thrombocytopenia and consumptive coagulopathy (Kasabach-Merritt syndrome).
Pathophysiology
Hemangiomas can occur in all liver segments with equal frequency.
Pathology
Characteristically, hemangiomas manifest as either solitary or multiple, well-defined masses, varying in size from a few millimeters to several centimeters. Hemangiomas are infrequently detected or are generally smaller when occurring within a cirrhotic liver, probably owing to progressive tumor shrinkage by liver fibrosis. On sectioning, hemangiomas show a typical red-blue appearance with a spongy or honeycombing surface. Organized thrombi, fibrosis, and calcification may be noted grossly, particularly in the central area of larger lesions. Occasionally, sclerosis may involve the entire lesion, which manifests as a firm, gray-white nodule of fibrous tissue (the so-called sclerosed hemangioma ).
Association of hemangioma with other benign liver lesions, such as FNH and hepatocellular adenoma, has been described.
On histologic examination, hemangioma consists of several communicating blood-filled spaces, lined by a single layer of flat endothelial cells, which are supported by a thin basement membrane.
Liver Function
Liver function test results are generally unremarkable, although patients with giant hemangiomas occasionally can have a mild increase in alkaline phosphatase level.
Imaging
Because of the high incidence in the general population, hemangiomas are frequently discovered incidentally on ultrasonography, CT, or MRI of the liver.
Computed Tomography.
On precontrast CT, most hemangiomas manifest as hypoattenuating lesions relative to the liver. However, because lesions may be hyperattenuating if occurring in the setting of diffuse fatty liver disease secondary to uniformly decreased attenuation of the hepatic parenchyma, a more reliable criterion for the diagnosis of hemangioma is isoattenuation to the aorta and intrahepatic vessels. Central calcifications may occur in giant hemangiomas.
With contrast-enhanced CT, hemangiomas classically show early, discontinuous, peripheral, nodular enhancement, with centripetal progression. The enhancing areas of hemangiomas are isoattenuating to the aorta during the hepatic arterial phase and to blood pool during the portal venous phase and delayed phase ( Figure 36-4 ). When all typical criteria are observed, lack of complete lesion enhancement on the delayed phase should not dissuade from the diagnosis of hemangioma. Giant hemangiomas usually lack complete enhancement on delayed phase imaging owing to thrombosis or sclerosis of the central portion of the tumor.
Small hemangiomas (<2 cm)—also known as capillary hemangiomas or flash filling hemangiomas —may enhance rapidly and homogeneously during the hepatic arterial phase ( Figure 36-5 ), thus mimicking other benign or malignant hypervascular liver tumors ( Tables 36-3 and 36-4 ). Transient peritumoral enhancement during the hepatic arterial phase is frequently observed owing to associated arteriovenous shunt.
| Features | Capillary Hemangioma | Cavernous Hemangioma | Metastases | Focal Nodular Hyperplasia | Large Benign Regenerative Nodules |
|---|---|---|---|---|---|
| Sex | F > M | F > M | M = F | F ≫ M | F > M |
| Age | 2nd-5th decade | 2nd-5th decade | 6th-7th decade | 3rd-4th decade | 3rd-4th decade |
| Ultrasound findings | Hypointense with hyperechoic border | Hyperechoic | Hypoechoic | Isoechoic | Variable |
| Sustained enhancement on portal venous and delayed phases | Yes | Yes | No | Yes | Yes |
| Isoattenuating to vessels on CT | Yes | Yes | No | No | No |
| Hyperintensity on T2 | Strong | Strong | Mild * | Mild | No |
| Homogeneous enhancement on hepatic arterial phase | Yes | No | No | Yes | Yes |
| Enhancement | Homogeneous | Peripheral, discontinuous | Peripheral, ringlike | Homogeneous | Homogeneous |
| Calcifications | No | Central if present | No † | 1% | No |
| Scar | No | Rare (larger lesions) | No | Yes | Larger lesions |
| Necrosis | No | No | Yes | No | No |
| Number | Single > multiple | Single > multiple | Multiple | Single (75%) | Multiple |
| History of malignancy | No | No | Yes | No | No |
Stay updated, free articles. Join our Telegram channel

Full access? Get Clinical Tree


