Two-dimensional imaging, even with multiple views, does not provide accurate three-dimensional information concerning radionuclide distribution. Because two-dimensional imaging more or less integrates the information from the third dimension (depth), it results in lower contrast of lesions (see Chapter 13). With the advent and success of computed tomography (CT) in diagnostic radiology in the early 1970s, similar concepts and techniques have been applied in nuclear medicine as emission computed tomography (ECT). Tomography, in general, is divided into two categories, transverse and longitudinal. It is the transverse tomography that has found success in routine clinical and research use. Transverse tomography can be performed with radionuclides emitting single photons (x- or γ-rays) or with radionuclides emitting positrons. Transverse tomography with single photon emitters is commonly known as single-photon emission computed tomography (SPECT), whereas with positron emitters it is known as PET.
This chapter describes the principle of transverse tomography, instruments commonly used for SPECT and PET, and the relative merits of the two types. The mathematical techniques used in reconstruction of a tomogram are highly sophisticated and are beyond the scope of this book. Therefore, I limit myself to a phenomenological description only. Also discussed briefly are the combined instruments, PET and CT, and SPECT and CT.
Principles of Transverse Tomography
In its simplest form, a detector acquires data from a thin axial section containing radioactivity by linear scanning from multiple directions around the cross section, as shown in Figure 14.1. In its complex form, mainly to reduce the data acquisition time, data are acquired from multiple thin cross sections and multiple directions simultaneously by using a large number of detectors as in PET or a scintillation camera as in SPECT. In either case, the principle of transverse tomography is the same and consists of two steps: acquisition of linear projection data of a thin cross section from multiple directions and reconstruction of the cross section or cross sections from these data. In PET, the data, as explained later, are acquired in a coincidence mode that is different than SPECT, but the same following considerations apply.
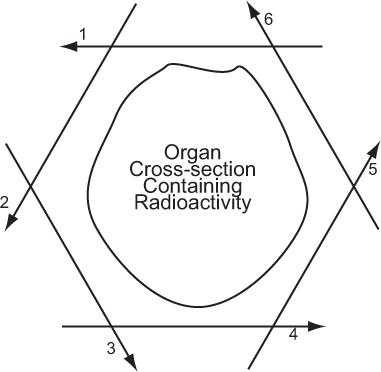
Fig. 14.1. Principle of axial tomography. A thin cross section of an organ is scanned from several tangential directions (in this example, six). From these scans, the cross-sectional radioactive distribution is reconstructed, using a variety of superimpositional techniques.
Considerations in Data Acquisition
Pixel Width, Matrix, and Number of Projections Let us consider a simple case where a single detector scans a cross section linearly from many directions. Let us also assume that as the detector moves from one position to the next along a line, it receives counts from N columns that are perpendicular to the direction of a scan and chosen to be equally spaced. This is shown in Figure 14.2 for the two positions of the detector in two different linear scans. Two columns perpendicular to each other have only a small area in common. This area is called a pixel, and the entire cross section can be imagined to consist of these small pixels distributed in a square matrix of size N × N. When scans are performed from different directions, different combinations of pixels, but always perpendicular to the direction of scan, contribute to the counts of the detector at different positions along a scan line. These are called projections of a plane on a line, and the number M of these projections is a critical parameter in the reconstruction of the cross section. For accurate and artifact-free reconstruction, M should be nearly equal to N. From the projection data, the radioactivity of each pixel is computed using the method described in the next section.
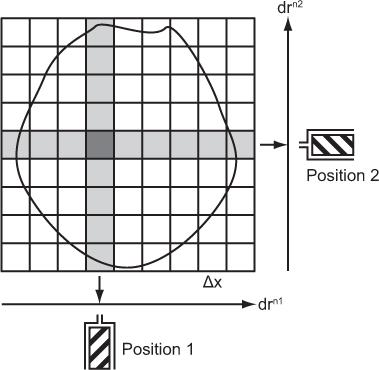
Fig. 14.2. Data acquisitions in transverse tomography. drn1, drn2 stand for scan directions 1, 2, and so on.
Data acquisition with a single detector is very time-consuming. A variety of methods has been developed to reduce the acquisition time or to increase the overall sensitivity. For example, to avoid the linear motion, a linear array of detectors N can be used simultaneously to gather data from a projection. This increases sensitivity N-fold compared with a single detector. Further gains can be achieved by using multiple linear arrays gathering data simultaneously from multiple directions as well as from many cross sections. Of course, such an increase in sensitivity is accompanied by an increased complexity and cost of such a device. Sensitivity is the main reason why data acquisition with a scintillation camera for SPECT is routinely used in clinical nuclear medicine. In cardiac applications, recently other novel methods of data collection, as described later in this chapter, have been quite successful.
The number of pixels in a cross section is determined by the number of columns, N, in a scan direction and is simply N × N. In the case of Figure 14.2, this number is 9 × 9 = 81. In a given cross section, the number of pixels and the size of the pixel Δx are inversely related. The smaller the pixel size is, the larger the number of pixels or matrix size is. In routine clinical nuclear medicine, the matrix size is either 64 × 64 or 128 × 128, resulting in 4096 or 16,384 pixels, respectively. What determines the pixel size is discussed next.
Pixel Width, Resolution, and Sensitivity Pixel width, Δx (and therefore the matrix size N × N and number of linear projections M) is an important consideration in data acquisition because it pertains to the amount of time required to complete a scan. Pixel width depends on the resolution obtainable in the tomogram, which in turn depends on the resolution of the collimator used in SPECT or the size of the detector used in PET. A rule of thumb is that the pixel width Δx should be less than or equal to the resolution of the collimator employed in the SPECT or the size of the detector employed in the PET. In general, improving the resolution necessitates reducing the pixel width Δx and vice versa. Thus, to improve resolution, one has to reduce the size of the hole in the collimator of the detector (SPECT) or use smaller size detectors (PET), which reduces the sensitivity of the detector. As a result, to achieve the same statistical reliability, one has to spend more time at each location. In addition, the reduction in Δx as a result of higher resolution increases the number of pixels N along the scan line that necessitates more linear projections M from different angles for optimum sampling. This again requires more time. Thus, we face a similar (actually worse) dilemma in transverse tomography as we face in areal scanning; that is, improvement in resolution costs dearly in terms of sensitivity and a compromise has to be made between the two.
In CT, where, because of the large number of photons available from an x-ray tube, the typical resolution or pixel size is about 1 mm, the number of linear scans performed is 180 or more. In nuclear medicine, where the available number of photons in a typical cross section is relatively small, typical resolution for SPECT is in the range of 1 cm and the number of linear scans needed is in the vicinity of 64 (128 for higher resolution). For PET, typical resolution is about 6 mm. Newer cardiac specific SPECT systems also have resolution of about 6 mm.
Other Requirements Besides the width Δ x of the columns, the other important requirements of collimation are
1. An individual detector at a given location picks up counts from only one column (perpendicular to the scan direction);
2. There are no variations in counts detected from a uniform cross section at different locations along scans from multiple directions;
3. The same activity in any pixel in a column contributes equally to the counts at a given location (i.e., the detector response should be uniform with depth);
4. All counts come from only the cross section under consideration and not from adjacent cross sections.
These requirements are not easily achieved in nuclear medicine because of the nature of collimation and attenuation and scatter in the patient, particularly for SPECT (Fig. 10.1 and p. 106).
A major difference between CT and ECT in data acquisition is that in CT, data are acquired within a 180 degree rotation of linear scans, whereas in SPECT (except for heart studies where 180 degree is preferable), a complete rotation (360 degree) of linear scans around the cross section is used.
Reconstruction of the Cross Section Reconstruction of a cross section from its multiple linear projections around the cross section is a general problem that is encountered in diverse fields. First analytic solution of this problem was provided by Radon as far back as 1917. However, because of the complexity involved in the computations, practical realization of the solution was achieved only in recent years with the advent and easy access to large digital computers. There are basically two classes of algorithms, analytic and iterative. Of the analytic methods, the most successful method is known as filtered back projection, which is a modified form (therefore more accurate) of back projection. This is widely used in CT, SPECT, and PET. Recently iterative methods have also been successful, particularly in cardiac nuclear medicine.
Reconstruction with Back Projection (a Simple Explanation) Let us consider a simple cross section containing two radionuclide sources as depicted in Figure 14.3A. When data are acquired from this cross section with an appropriate detector and by linear scanning from multiple directions, the responses of the detector are shown as scan 1, scan 2, scan 3, scan 4, and so on. Notice that in this case, the detector receives counts only at one or two discrete locations in each scan, and these locations are determined by the intersection of the scan directions and the perpendicular lines from each source to the scan direction, respectively. In the back projection method of reconstruction, as the name implies, data received at one location of a linear scan is back projected in the column right above that location and so on. Because no prior knowledge exists about which or how many pixels in that column contain radioactivity (actually, that is what we would like to know), one assumes that counts received at that location came in equal amounts from each pixel in that column. This is done in Figure 14.3B. Counts received by the detector in scan 1 at the two locations are distributed equally in the 12 pixels of columns 3 and 7, respectively. When a similar procedure is repeated for other scans (2, 3, 4, etc.), the reconstruction of the cross section is complete. As can be seen, two radioactive sources have been reproduced at the correct locations, although not as point sources but as star patterns. As a result, a number of pixels (shown as shaded) that contained no radioactivity in the original cross section are reconstructed inaccurately as containing small amounts of radioactivity (starlike artifact).
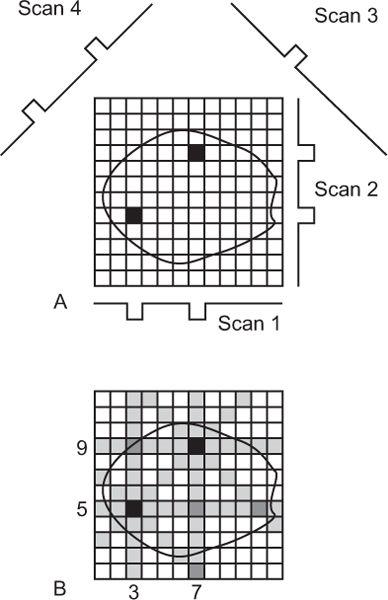
Fig. 14.3. Reconstruction of a cross section using simple back projection method.
Filtered Back Projection (a Better Reconstruction Method): Actual Steps In a more refined approach, known as filtered back projection, the star artifacts are reduced by adding and subtracting fixed fractions of the counts from the column under consideration to several adjacent columns on both sides. When this is done, a quite accurate and almost artifact-free reconstruction is obtained. Because data acquired are large and the mathematical operations needed for reconstruction are huge, a large digital computer is essential to store and process the data quickly. In practice, the filtered back reconstruction is performed in frequency or Fourier space (similar to modulation transfer function MTF discussed in Chapter 12) where the filter function takes a much simpler form and therefore computations become easier and faster. The following steps are taken:
1. Compute Fourier transform of individual projection data;
2. Multiply it by the filter function;
3. Compute inverse Fourier transform;
4. Back projection to get the cross section.
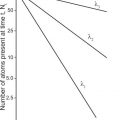
Filter function is an important parameter in ECT because it affects the noise and resolution characteristics of the reconstruction. A number of filters—ramp, Hanning, Butterworth, and Metz—have been used. Choice of filter depends on the acceptable noise and resolution in the image. Of these, Hanning and Butterworth are most common in clinical nuclear medicine. Figure 14.4 shows a ramp filter and two Butterworth filters, each with a different amount of smoothing. A ramp filter produces an image with the best resolution but with the most noise. Butterworth filter 2 produces the least noisy image but the resolution is worst. Butterworth 1 is a good compromise between loss of resolution and reduction in noise.
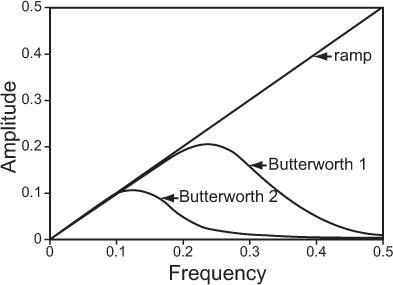
Fig. 14.4. A typical filter routinely used in reconstruction of tomographic images in nuclear medicine.
Attenuation Correction in Filtered Back Projection The requirements for accurate reconstruction of a cross section—the sensitivity for each pixel in a column is the same and the counts at each location originate only from that column—are not met in SPECT because the γ-rays originating from different pixels pass through different thickness of tissues and therefore are attenuated to different degrees. As a result, when reconstruction is done from the data obtained from a cross section of uniform radioactive distribution, it is highly nonuniform. Several methods have been used to solve these problems. These can be classified as analytical or empirical. Analytical methods make some simplifying assumptions about attenuation (e.g., uniformity of attenuating medium) and are incorporated prereconstruction (Sorenson method), simultaneous with reconstruction (Gulberg method), or postreconstruction (Chang method). Of these, the Sorenson and Chang methods are widely available commercially. These methods fail utterly when the attenuating medium is highly inhomogeneous, such as the thorax. With empirical methods, the actual attenuation map is obtained by taking multiple transmission scans from multiple projections (similar to a CT). These methods in theory produce the best results but require additional setup and scan time, and exposure to the patient.
Scatter Correction in Filtered Back Projection Compton scattering of γ-rays originating outside the column of interest into the detector and the diverging field of view of a collimator make it hard to collect data at a given location from one column (and one cross section) only (see Figure 10.2). As was suggested in Figure 10.2, the best method to reject scattered events is by using either a narrow window or multiple (two or three, routinely) windows and subtracting the scattered events.
Iterative Methods Besides the filtered back projection, a number of iterative methods have been used to reconstruct cross sections from the projection data. Their principal drawback is the computer time needed for reconstruction. However, with the vast improvements in computer data processing speed per unit cost, it is no longer a problem, and these methods have replaced filtered back projection method, particularly in specific applications. The main advantage of these methods is that all the problems encountered in the data acquisition, attenuation and scatter in the patient, collimator response (resolution and its depth variation, septal penetration etc.), and detection characteristics of the detector can be exactly modeled in the algorithm. As resolution recovery is modeled in the algorithm, it allows the use of coarser-resolution collimators. Coarser-resolution collimators have higher sensitivity. The resulting images have better resolution and less noise. There are no streaking artifacts as encountered in filtered back projection. The net result is that images are more quantitative than those produced by filtered back projection. The improvement in noise and resolution comes at the cost of the need of high computer processing power.
In iterative reconstruction, one starts with a gross estimate of the distribution of the radio-nuclide in the cross section. Projections calculated from the estimated distribution (back projection) are arithmetically compared with measured data. The result is used to update the next estimate (forward projection). This process continues till the errors in the measured projection data and the estimated projection data are minimized. Corrections for attenuation, scatter, and spatial resolution are made by mathematically modeling these factors into the forward and back projection calculations.
Among the iterative methods, maximum likelihood expectation maximization and its relative ordered-subset expectation maximization, and maximum a posteriori expectation maximization algorithms are widely used. There is ongoing work to make these algorithms even more efficient.
Single-Photon Emission Computed Tomography
Current SPECT techniques employ two methods for data acquisition, with scintillation camera or with multiple detectors arranged in a variety of geometric pattern. The latter are dedicated SPECT systems and do not generate longitudinal projecion images and are mainly used in cardiac applicaions.
Data Acquisition with a Scintillation Camera Of the two current approaches for perorming SPECT, using multidetectors or a scintillation camera, the latter is more popular because most of the equipment needed (e.g., a scintillaion camera and a computer) is already available in nuclear medicine departments. Additionally, a rotating gantry on which a scintillation camera head can be mounted and a soft ware program to acquire data and reconstruct the cross sections are needed. To reduce the acquisition time further, SPECT systems with two or three scintillation camera heads are preferred. A commercial dual headed scintillation camera is shown in Figure 14.5.
In this setup (Fig. 14.6), a scintillation camera head (or heads) rotates in a circle around a patient, making a number of stops for a given time to acquire data from multiple directions (64 or 128 in routine procedures). This is a step-and-shoot data acquisition. No data are gathered during its movement from one position to the next. To avoid this dead time and increase sensitivity further, acquisition protocols have been developed where data are either gathered continuously (without a stop) or in a combination of the two (continuous + step-and-shoot). The orbit of detector heads does not have to be circular. Elliptical or body contour orbits, because of their improved sensitivity and resolution characteristics, are now standard features.
Because a scintillation camera acquires data simultaneously from a large area of an organ as opposed to a thin section, data acquired are planar projections of a volume rather than line projections of a cross section. Therefore, it can be easily formatted to produce different cross sections (axial, coronal, sagittal, or oblique) of an organ from just a single acquisition. This is another advantage of scintillation camera–based SPECT over multidetector-based SPECT system that presently reproduce only axial slices.
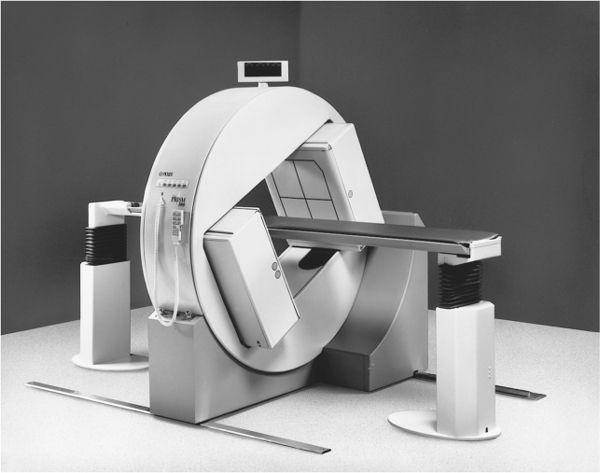
Fig. 14.5. A commercial dual-head scintillation camera (courtesy of Marconi Medical Systems). (From Bushberg JT, Siebert JA, Leidholdt EM Jr, et al. The Essential Physics of Medical Imaging. 2nd ed. Philadelphia: Lippincott Williams & Wilkins, 2002, with permission.)
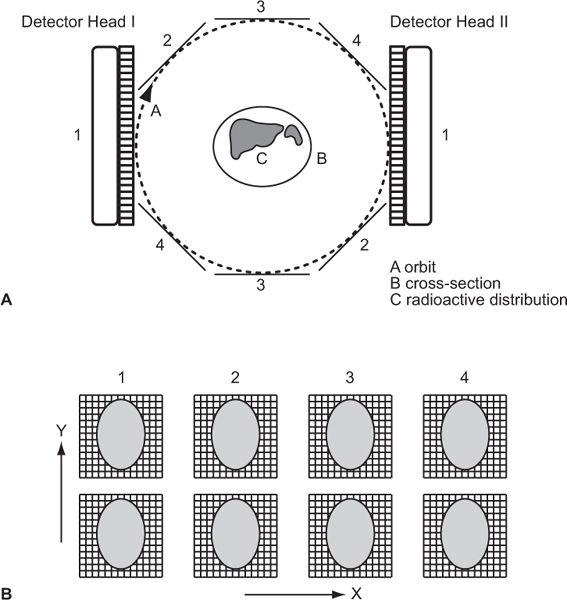
Fig. 14.6. (A) Data acquisition with a dual-head scintillation camera making a circular orbit around a patient containing radioactivity. In this example, four pairs of areal projections are acquired. In actual case 32 or 64, such pairs are obtained. (B) Corresponding rows in the four pairs of images (first row in each image, etc.) represent linear projections for an axial cross section at the level represented by that row. These data are then used in reconstruction of that cross section. The thickness of the cross section can be increased by combining adjacent rows.
Collimators For optimal performance of SPECT with a scintillation camera, choice of a collimator is very important. For routine use, a general purpose parallel-hole collimator is preferred. A high-resolution parallel-hole collimator may be used in special situations. Special collimators designed for SPECT are also increasingly becoming available. As stated earlier, iterative reconstruction algorithms allow for the use of coarser (wider radius and shorter length holes) resolution collimators.
Other Requirements or Sources of Error For accurate reproduction of a radioactive cross section, the following sources of error are unique for a scintillation camera–based SPECT:
1. Center of rotation: Proper alignment of the center of electronic position- (x, y) determining circuit with the center of rotation. In areal imaging, a shift by one or two pixels in the x or y direction is hardly noticeable, but in SPECT, such a misalignment produces recognizable artifacts (e.g., a point source is reconstructed as a ring). Proper alignment can be achieved by placing a point source at the center of rotation, imaging it from two opposite directions, and determining the pixel location of the source in the two images. If these are identical, then there is no need for adjustment and the electronic center is properly aligned with the center of rotation. However, if the pixel location of the source is not identical, these are made identical by electronically off setting X or Y voltage, as the case may be.
2. Uniformity: Uniformity of response of a scintillation camera. This requirement is much more stringent in SPECT than routine imaging because errors propagate rapidly in reconstruction of the image. Although in areal imaging uniformity in the range of ±5% is acceptable, in SPECT it should be under ±2%. As explained earlier (p. 134), newer scintillation cameras are capable of such a performance.
3. Invariance of uniformity at different angles: Because images are acquired at a large number of angles, the uniformity of a scintillation camera should be maintained at each angle. The main reason for changes in the uniformity response at different angles is the change in the photo-multiplier PM tube gain that occurs when it is oriented at different angles in the earth’s magnetic field. In newer cameras where PM tubes are shielded by μ-metal, these effects are reduced considerably.
4. Detector head alignment with the axis of rotation.
Thus, clinical success of SPECT depends on a stringent quality control program; acquisition of a sufficient number of counts in each image; use of properly designed collimators; and proper correction for attenuation, scatter, and, if possible, for system resolution. With proper attention to these points, good quality reconstructed SPECT images can be realized routinely in a clinical nuclear medicine department (Fig. 14.7). However, these images, although useful clinically, still fall short where accurate quantitative measurements are required.
Dedicated SPECT Systems Dedicated systems using multiple scintillator detectors had been tried for many years without any clinical success. However, recently with the emergence of semiconductor detector, CZT, these have made a come back. Primarily, because of smaller size of these detectors, novel geometric arrangements and collimator designs can be utilized to produce clinical images in shorter time (up to 10 times less than the standard scintillation camera–based systems) and with better resolution than those that are produced with scintillation camera–based SPECT. However, because of technical problems, presently these are limited to cardiac applications only. The two commercially successful systems are D-SPECT and GE-Discovery NM 530c.
The D-SPECT (Fig. 14.8) consists of nine detector columns each mounted in an arc mimicking the shape of human torso around the heart as shown in Figure 14.9. Each detector column works like a small scintillation camera except that it uses CZT detectors and not a NaI detector and are capable of imaging heart size objects only. The detector columns are capable of rotation and translation to image from different directions (different projections). Thus nine detector columns (cameras) can generate a large number of projections of heart (more than enough to reconstruct the tomographic slices of the heart). Each detector column (Fig. 14.10) consists of 1024 CZT detectors (each 2.46 x 2.46 in area and 5 mm in thickness). These are arranged in a matrix 16 x 64 making a rectangle of 4 x 16 cm. Collimator on each detector column is a parallel-hole collimator with one rectangular hole for each detector. The size of the hole is larger than the one used in a conventional scintillation camera parallel-hole collimator and the length of the hole is also smaller than the one used in standard parallel-hole collimator, thus producing a poorer resolution than the standard parallel-hole collimator. It sacrifices resolution for a sensitivity gain of up to 10 times; resolution is recovered during the reconstruction, the net effect being up to a 2x increase in resolution over conventional scintillation camera.
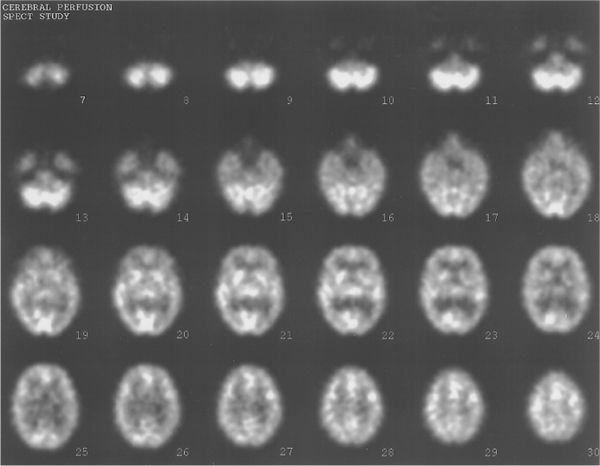
Fig. 14.7. Typical SPECT images. Thirty transverse slices showing brain perfusion.
GE-Alcyone NM system employs a large numbers pin holes (at least 27, in a two-dimensional array of 3 x 9) to image the heart from multiple directions, thus gathering enough data for the reconstruction of tomographic slices of the heart without any motion either of the detectors or of the patient. Each pinhole projects heart’s image on a 16 x 16 matrix of CZT detectors (each about 2.5 x 2.5 x 5 mm thick) that acts like a small scintillation camera. The transaxial images of the heart are reconstructed using a three-dimensional algorithm.
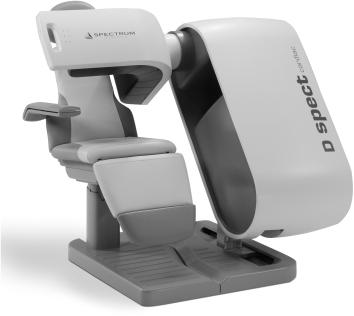
Fig. 14.8. A commercial dedicated SPECT system (From D-SPECT with permission).
Positron Emission Tomography
Why PET? As was discussed in Chapter 5 under radiopharmaceuticals for PET, most radionuclides used in nuclear medicine (e.g., 99mTc, 67Ga, 201Tl) are not isotopes of physiologically important elements such as hydrogen, carbon, nitrogen, or oxygen. The only γ-emitting isotopes of these elements are actually positron emitters (11C, 13N, and 15O) that have short half-lives (in minutes). Fluorine-18, a positron emitter, even though not a physiologically important element, can replace hydrogen in many important biological molecules without changing their function significantly. Therefore, if one is interested in measuring the distribution, physiology, and/or metabolism of a large number of important biomolecules noninvasively, there is no alternative but to use these positron emitters in conjunction with PET. For over the last 25 years, PET has been yielding a wealth of information as a research tool but now with the easier availability of 18F-deoxyglucose, PET has finally become an important instrument in a clinical nuclear medicine department.
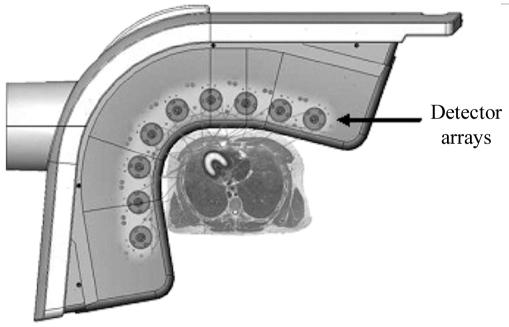
Fig. 14.9. Geometric arrangement of the 9 detector heads around the heart of a patient (From D-SPECT with permission).
Principles of PET Positron-emitting radio-nuclides as such do not emit γ-rays, but when an emitted positron has lost its energy by interaction with surrounding medium within a short distance of the site of emission (average range is 0.22 mm in the case of 18F, see Table 5.2), it annihilates by combining with an electron, and two γ-rays with energies of 511 keV each are produced simultaneously (see Figure 6.2). Such a pair of γ-rays produced by annihilation of a positron always travels in opposite (180 degree apart) directions. In PET or positron scanning, these two γ-rays are used in a coincidence mode where both γ-rays are detected by a pair of detectors (e.g., BGO or LSO) simultaneously. One or more pairs of small detectors face each other on either side of a radioactive organ as in Figure 14.11 where two such pairs of detectors are shown (detectors 1 and 2 form one pair and detectors 3 and 4 form the second pair). Output of each pair of detectors is relayed to a coincidence circuit to determine whether the output of each detector originated simultaneously or within a short time of each other (10−9 seconds, it is called the resolution time of the coincidence circuit). In this case, output of the detectors 1 and 2 are fed to coincidence circuit 1 and output of the detectors 3 and 4 are fed to coincidence circuit 2, respectively.
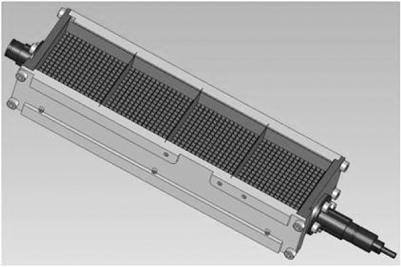
Fig. 14.10. The detector head containing the CZT detectors and collimator (D-SPECT with permission).
True Coincidences For the annihilation marked a, the two γ rays will interact with the detectors 1 and 2, respectively, and almost simultaneously, and therefore a true coincidence output will result in coincidence circuit 1. As can be seen, this detector pair will produce a true coincidence output only when the annihilation occurs in the area shown by dotted lines between these two detectors. Thus, this detector pair has defined a detection field of view (within the dotted lines) without the presence of a collimator as is required if these detectors were used only in single mode (without coincidence mode). For the annihilation marked b, the two γ-rays will interact in the detectors 3 and 4, respectively, and a true coincidence output will result in coincidence circuit 2. In this case, the detection field of view of this pair of detectors is shown by the dotted lines between these two detectors. A similar consideration applies for the annihilation marked a, where a true coincidence occurs between detector pair 1 and 2. A coincidence will be detected in coincidence circuit 1 from annihilation occurring only in the area shown by dotted lines between detector 1 and 2. Thus, simultaneous detection of the two annihilation γ-rays by a pair of cylindrical detectors defines uniquely a nice cylindrical (as opposed to a cone for a single detector with a collimator) field of view without the aid of a collimator.
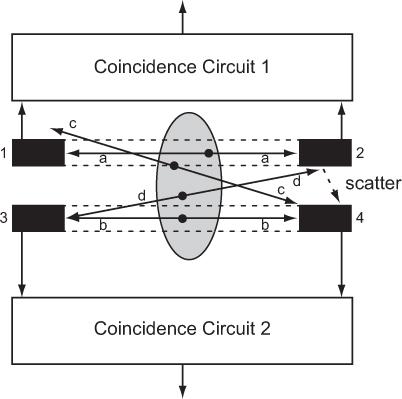
Fig. 14.11. Coincidence mode of detection of a positron-emitting radionuclide.
Sensitivity Sensitivity of coincidence detection increases with the number of detector pairs employed. To increase the sensitivity of these detector pairs further in the above example, we could connect the output of detectors 1 and 3 in another coincidence circuit 3 and outputs of the detectors 2 and 4 in coincidence circuit 4. This would define two new fields of view, one connecting detectors 1 and 3 and the other connecting detectors 2 and 4 (not shown here but actually done in commercial systems). Thus, two detector pairs with four coincidence circuits produce four distinct areas of detection. The use of multiple coincidence circuits with each detector increases the sensitivity of the coincidence detection mode greatly when a large number of detectors are used as is the case in commercial PET devices.
Resolution The resolution of a coincidence pair is more or less determined by the area of the two detectors. For a square detector, it is the length or the width of the detector. In most commercial systems, it is between 5 to 8 mm. The thickness of the detector determines the intrinsic sensitivity as was discussed in Chapter 8. Also note that in this setup, the sensitivity and resolution in the field of view of such a pair of detectors does not vary significantly with the location of the radioactive source in its field of view. This, as was stated earlier, is an important requirement for ECT that is difficult to achieve in SPECT but is fulfilled easily in PET.
Two other factors that ultimately limit the lowest achievable resolution are the range of positrons and the distance between the detector pair. Range of the positron because the annihilation only occurs at the end of the range. The distance between the detector pair, because the two 511 keV γ rays do not exactly go in opposite direction (the angle is very slightly less than 180 degree. However, in present clinical PET systems, the detector size is the major contributor to the resolution.
Accidental Coincidences Annihilations marked c and d cannot produce a true coincidence output in either of the detector pairs as only one γ-ray strikes a detector in each case. However, if by chance the two annihilations c and d occur simultaneously, then one γ-ray produced by annihilation c can interact with one detector (here detector 4) and one γ-ray produced by annihilation d can interact with the other detector (here detector 3) simultaneously and thus producing a coincidence in circuit 2. Such an event is not a true coincidence and is called accidental coincidence. These events are undesirable as they originate outside the field of view of the detector pair. There are two ways to minimize the number of the accidental coincidence: one is to have the coincidence resolution time as short as possible and the other is to keep the radioactivity to be detected small. The second alternative is not a viable option as it will increase the imaging time. However and fortunately, the accidental events can be easily and accurately measured and subtracted. Accidental events are measured by employing another coincidence circuit in parallel to a true coincidence circuit but with a small delay between the outputs of the detector pair. Counts obtained in the accidental coincidence circuit are then subtracted from the counts obtained in the true coincidence circuit.
Scatter Coincidences Just as scatter of γ-rays in SPECT is a serious source of concern, it is also a serious problem in PET. Two types of scatter events occur. One type of scatter is demonstrated by the annihilation marked d in Figure 14.11. One of the annihilation γ-rays interacts with detector 3 and the other with detector 2. As such, there will be no coincidence. However, if the second γ-ray is scattered by the detector 2 as shown by a dotted arrow in the figure, then a coincidence count will be produced in circuit 2. This is a scatter coincidence and is not a desirable event; it has to be reduced and, if possible, corrected. One way to reduce this kind of scatter is to use shielding between the detectors. The second kind of scattered events occur when the scattering takes place in the patient. Both types of the scattered events are reduced by employing energy discrimination as was discussed in Chapter 10. As LSO detectors have significantly better energy resolution than BGO, LSO detectors are better than BGO in rejecting scattered events.
Attenuation Correction The two annihilation γ-rays taken together pass through the same thickness of tissue irrespective of location of the annihilation in the field of view of the detector pair. Therefore, it is much easier and more accurate to correct for attenuation in PET. First, one measures the attenuation through different locations of the patient by using an external source. This can be done fairly accurately. Then, true coincidences are corrected point by point for the attenuation. Corrected data are then used to reconstruct the image using the filtered back projection method. Again, accurate correction of the attenuation is one more advantage over SPECT.
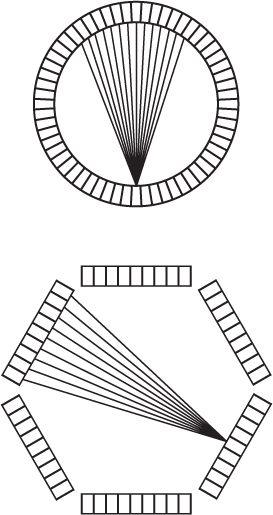
PET Instrumentation To perform PET, one can acquire data from a thin cross section with a pair of detectors by linearly scanning a cross section from multiple directions. However, the sensitivity of such a device will be low. To increase the sensitivity, multiple pairs of detectors, either in a ring or a hexagonal array, are used in commercially available systems, as shown in Figure 14.12. To increase the sensitivity of these devices, more than one array or ring is sometimes used to acquire data from multiple cross sections simultaneously. A commercial PET instrument is shown in Figure 14.13. The instruments are quite complex as a large number (sometimes exceeding 5000, about 5 mm × 5 mm × 30 mm in size) of BGO or LSO crystals are used. It is not practical to use 5000 PM tubes. Instead, to reduce the electronic complexity of the instrument as well as to reduce the cost of the instrument, a large crystal block shown in Figure 14.14, is divided into smaller sections (each serves as one independent detector) by making slits into the crystal block. The block shown is divided into 8 × 8 sections, thus producing 64 detector elements of about 4 to 5 mm width and 3 cm thickness. The large crystal block is coupled to four PM tubes as shown in Figure 14.14. Using the Anger logic similar to a scintillation camera, each crystal can be uniquely identified by the pulse height distribution generated in the four PM tubes. Thus, this type of arrangement reduces the number of PM tubes by a factor of 16 compared to if one employed one PM tube for each crystal element. Besides reducing the cost, it increases the electronic stability and performance of the PET instrument. When these crystal blocks are arranged in a circular or hexagonal array, they produce eight or more axial cross sections at the same time.
Related posts:


Stay updated, free articles. Join our Telegram channel

Full access? Get Clinical Tree


