Breast cancer is a heterogeneous group of neoplasms originating from the epithelial cells lining the milk ducts. This heterogeneity has been observed in histology for a long time and formed the backbone of the traditional pathology-driven classification of breast cancer. Multiple studies have shown that this heterogeneity in the histopathologic features of breast cancer was associated with clinical outcomes. More recently, the pathology-driven classification has been replaced by molecular classifications based on hormone receptors, human epidermal growth factor receptor 2 (HER2), and Ki-67 status. These molecular classifications reflect genetic tumor heterogeneity and have strong associations with the prognosis of various breast cancers. As a result, there is hope that the development of targeted therapies to these molecular subtypes will lead to improved outcomes of breast cancer. Additionally, a lot of research has been performed to identify imaging features on breast imaging examinations, such as breast magnetic resonance imaging (MRI), that may serve as imaging biomarkers for these molecular subtypes of breast cancer. This chapter reviews the current understanding of the intrinsic molecular subtypes of breast cancer, with emphasis on the imaging features of these molecular subtypes on breast MRI and diffusion-weighted imaging (DWI).
Background
In 2022 an estimated 287,850 new cases of invasive breast cancer are expected to be diagnosed in women in the United States, along with 51,400 new cases of noninvasive (in situ) breast cancer. An estimated 43,250 women are expected to die in 2022 from breast cancer, making it the second-leading cause of cancer death among women in the United States. 1 Death rates have been steady in women under 50 since 2007 but have continued to drop in women over 50. The overall death rate from breast cancer decreased by 1.3% per year from 2013 to 2017. These decreases are thought to be the result of treatment advances and earlier detection through screening. Although screening mammography accounts for most of this early detection, studies have found that screening with breast MRI leads to earlier detection of biologically relevant cancers among high-risk and average-risk women, which are often occult on mammography.
Breast MRI is an indispensable modality, along with mammography and ultrasound (US). Its clinical indications are staging of known cancer, screening for breast cancer in women at increased risk, and evaluation of response to neoadjuvant chemotherapy. Unlike conventional mammography and US, MRI is a functional technique. Contrast material-enhanced MRI evaluates the permeability of blood vessels by using an intravenous contrast agent (gadolinium chelate) that shortens the local T1 time, leading to a higher signal on T1-weighted images. The underlying principle is that neoangiogenesis leads to formation of leaky vessels that allow for faster extravasation of contrast agents, thus leading to rapid local enhancement and the detection of breast cancer.
In the specific setting of MRI for high-risk screening in BRCA1/2 mutation carriers, the reported sensitivities are between 75.2% and 100% and specificities between 83% and 98.4%. The cancer detection rate among known BRCA1/2 carriers was 26.2 per 1000, compared with 5.4 per 1000 in high-risk nonmutation carriers. Compared with the earlier trials, the sensitivities and specificities of breast MRI continue to improve due to two major factors. First, MRI scanners, coils, and scan protocols have evolved, leading to marked improvement in image quality and spatial resolution. Second, radiologists have gained significantly more experience in the interpretation of breast MRI examinations. Despite this progress, false-positive findings remain a limitation of breast MRI examinations.
False-positive MRI lesions have indeterminate morphological and kinetic features that turn out to be benign at biopsy but cannot be classified as certainly benign based upon the imaging examination alone. Because benign breast lesions are frequent, a multiparametric breast MRI examination that includes DWI assists with lesion characterization. DWI can help visualize and quantify random movement of water molecules in tissue, influenced by tissue microstructure and cell density. This is achieved by applying motion-sensitizing gradients (described by the b value) to an essentially T2-weighted echo-planar imaging sequence. Breast cancers show decreased water diffusion, primarily attributed to increased cell density, leading to higher signal intensity on DWI. The apparent diffusion coefficient (ADC) is a quantitative measure of diffusivity derived from DWI. Values are usually expressed in 10 −3 mm 2 /s. Because of the hindered diffusion in cancers, mean ADCs are generally low (range 0.8–1.3 × 10 −3 mm 2 /s) compared with those in benign lesions (range 1.2–2.0 × 10 −3 mm 2 /s). Consequently, cancers have a low signal intensity on the derived ADC maps, and this feature allows DWI to improve the differentiation between benign and malignant breast lesions. Additional roles for DWI include lesion detection on a screening MRI, using DWI as a prognostic indicator, and predicting response to treatment. This chapter will explain how quantitative DWI findings provide information on prognosis and prediction factors of breast cancers and help lesion management. Please see related chapters on breast lesion characterization (see Chapter 3 ), monitoring response to treatment (see Chapter 5 ), and multiparametric imaging, radiomics, and artificial intelligence (see Chapter 10 ).
Classification of Breast Cancer
Breast cancer is a heterogeneous disease comprising several molecular and genetic subtypes, each with characteristic biological behavior and imaging patterns. Traditional classification of breast cancer is based on the clinicopathologic analysis of tumors, with classes of breast cancer defined by histopathologic features, including the pattern of architectural growth (e.g., cribriform, papillary) and the nuclear grade (low, intermediate, or high). Treatment choices are partially determined by the tumor size, local invasion, and lymph node involvement or distant metastases, as defined by the American Joint Committee on Cancer’s (AJCC) TNM staging classification (7th edition). However, this traditional classification of breast cancer, based on the histopathologic features, offers limited prognostic value. Although survival rates correlate best with tumor size and the presence of axillary metastasis, breast cancer patients at the same anatomical stage of disease can have markedly different clinical courses and clinical outcomes. Fortunately, developments in the field of molecular biology have allowed breast cancers to be analyzed by their expression of specific biomarkers. As a result, the eighth edition of the AJCC’s TNM staging classification incorporates this genetic information into the traditional classification scheme.
Genomic Expression Pattern Analysis and Molecular Subtype of Breast Cancer
Technical developments in DNA microarrays, specifically genomic expression pattern analysis using hierarchical clustering, are the basis for the molecular classification of major subtypes of breast cancer. In 2000 Perou and colleagues tested 65 breast tumors against DNA microarrays representing 8102 genes. These investigators noted that the molecular portraits of the tumors, derived from patterns of gene expression, disclosed some groupings. Tumors were clustered in terms of growth rate, activation of specific signaling pathways, and cellular composition. For example, the more proliferative tumors overexpressed genes such as Ki-67, a marker of cellular proliferation; this expression correlated with increased mitotic indexes at histopathologic examination. Based on the persistent differences in their gene expression patterns, the authors divided breast cancers into two large categories based on their pattern of gene expression. When tumor cells manifested characteristics similar to the epithelial cells lining the milk ducts, expressing, for example, cytokeratin 8/18 and genes associated with the estrogen receptor (ER), the cancers were labeled luminal cancers. Alternatively, when cancer cells displayed characteristics similar to myoepithelial cells (also known as basal cells) that line the inner surface of the basement membranes, expressing, for example, cytokeratin 5/6 and laminin, the cancers were grouped into the basal category.
As a result, two large categories of luminal breast cancers and basal breast cancers were defined and dichotomized on the basis of the presence or absence of ERs. ER biology was identified as a key player in breast carcinogenesis, defining the morphology and the clinical behavior of the final tumor, whereas other parameters, such as tumor grade, were found to be less important. Luminal tumors also were generally characterized by an absence of overexpression of the HER2 gene, a proto-oncogene that stimulates cellular growth. Based on genomic profiling at the DNA, microRNA, and protein levels, researchers in The Cancer Genome Atlas (TCGA) Network refined these classifications into four intrinsic molecular subtypes of breast cancer: luminal A, luminal B, HER2-enriched (HER2+), and triple-negative (TN) and/or basal-like tumors ( Table 4.1 ). Since then, multiple studies confirmed that each subtype of breast cancer has a unique response to therapy, disease-free survival (DFS), and overall survival (OS). As a result, subtype-based recommendations for systemic therapies have been implemented in clinical practice.
| Intrinsic Subtype | Subtype | ER | PR | HER2 | Ki-67 | Histological Grade | Recurrence Risk Score | Frequency (%) | Comments |
|---|---|---|---|---|---|---|---|---|---|
| Luminal A | Luminal A-like | Positive | Positive>20% | Negative | Low | Generally Grade 1 or 2 | Low | 50–55 | Best prognosis |
| Luminal B | Luminal B-like (HER2−) | Positive | Negative or low <20% | Negative | High | Generally Grade 3 | High | 20 (both types of luminal B) | Less favorable than luminal A |
| Luminal B-like (HER2+) | Positive | Any | Overexpressed or amplified | Any | Generally Grade 3 | High | |||
| ErbB2 overexpression | HER2+ (nonluminal) | Negative | Negative | Overexpressed or amplified | Any | Generally Grade 3 | N/A | 15 | Improved with HER2-targeted therapy |
| Triple negative | Triple negative | Negative | Negative | Negative | Any | Generally Grade 3 | N/A | 10–20 | May improve with novel agents a |
a Immunotherapy, antibody-drug conjugates (ADCs), and poly (adenosine diphosphate-Q22 a ribose) polymerase inhibitors.
Distribution and Prognosis of Molecular Subtypes of Breast Cancer
These subtypes are unevenly distributed in breast cancer patients and associated with different tumor phenotypes and distinct variations in response to therapy and survival. Patients with luminal A tumors have the most favorable prognosis, followed by those with luminal B tumors, who have an intermediate prognosis. On the other end of the spectrum, TN and HER2+ subtypes are associated with an unfavorable prognosis, but with the introduction of targeted drugs, such as trastuzumab or pertuzumab, the natural course of disease of the HER2+ subtype is nowadays more favorable, whereas the triple-negative subtype is associated with an unfavorable prognosis.
In the clinical and research settings, molecular subtypes are derived by invasive sampling. Several molecular assays are commercially available, including Oncotype DX (Genomic Health, Redwood City, CA); MammaPrint (Agendia, Irvine, CA); Mammostrat (Clarient Diagnostic Services, Aliso Viejo, CA); PAM50 (Prosigna; NanoString, Seattle, WA); EndoPredict (Sividon/Myriad Genetics, Salt Lake City, UT); and MapQuant Dx Genomic Grade index (Ipsogen/QIAGEN; Venlo, the Netherlands). Oncotype DX and MammaPrint, both of which are approved by the Food and Drug Administration, have shown predictive and prognostic abilities for evaluating the risk of developing distant metastasis and predicting the benefit of adjuvant chemotherapy. However, biopsies of small tumor regions may not be representative of the genetic, epigenetic, and/or phenotypic alterations of the entire tumor. A common alternative is to use immunohistochemical (IHC) surrogates for the definition of molecular subtypes (see Table 4.1 ). There is variable agreement between classifications via these surrogates and formal genetic testing (41%–100%). Given these limitations and the relatively high cost of assays, there is a strong demand for more accurate, noninvasive means of differentiating molecular subtypes, which presents a unique opportunity for advanced medical imaging, specifically with breast MRI and DWI.
Luminal Tumors
Luminal A tumors are the most common type of breast cancer, accounting for 50% to 55% of all tumors. They are characterized by high genetic expression of the ER and progesterone receptors (PRs), as well as many other genes expressed by the epithelial cells that line the lumen of the terminal duct lobular unit, where most breast cancers arise. These cancers are usually low-grade tumors, without amplification of the HER2/neu proto-oncogene and with a low Ki-67 proliferative index. Overall, luminal A breast cancer is associated with the most favorable prognosis, with a 5-year OS and relapse-free survival rate of more than 80% in 2001. This excellent prognosis is in part because expression of steroid hormone receptors is predictive of a favorable response to hormonal therapy. Luminal A tumors progress slowly over time, and the chance of DFS survival is higher than with other subtypes.
Luminal B tumors account for 20% of all tumors. These cancers also express ERs and PRs but have greater proliferative activity, as can be assessed through Ki-67 levels; these cancers are usually mid- to high-grade tumors. Luminal B breast cancers characteristically do not overexpress HER2/neu, but approximately 30% of them will be HER2-enriched. The prognosis of patients with luminal B breast cancer is often poorer than that for patients with luminal A tumors. Five-year OS and relapse-free survival rates were approximately 40% in 2001. Although ER status and PR status are predictors of response to endocrine therapy, the clinical outcome cannot reliably be predicted solely from the ER and PR status, and analysis of other cellular markers and tumor characteristics is required for optimal assessment of outcome and to determine the need for chemotherapy.
Mammography, Ultrasound, and Magnetic Resonance Imaging Features of Luminal Tumors
Luminal A tumors are most commonly screening-detected masses with spiculated margins and associated architectural distortion. Luminal B masses exhibit indistinct, microlobulated, or spiculated margins but are less likely to demonstrate distortion. Ko and colleagues reported on the appearance of 93 ER-positive (ER+) HER2-negative (HER2-) breast cancers at mammography. These cancers appeared most often as irregular masses (45%) or irregular masses with calcifications (28%). Overall, microcalcifications were seen in 41% of these cancers. The typical sonographic appearance of luminal tumors is an irregular mass with angular or microlobulated margins, with posterior acoustic shadowing.
On MRI, luminal A and luminal B tumors often present as an enhancing irregular mass with spiculated margins and uncommonly as nonmass enhancement. Uematsu and colleagues described the appearance of 117 ER+ HER2- breast cancers at MRI. Forty-six percent of these lesions were unifocal, 44% were multifocal, and 9% were multicentric. These investigators reported mass enhancement in the majority of these tumors (67%), with the remainder being areas of nonmass enhancement (33%), most often segmental. The masses were most often irregular (32%) or oval (38%) in shape, with irregular margins in 86%. Heterogeneous internal enhancement was seen in 97% of the tumors, with plateau or washout kinetics in 79%. Eighty-five percent of the ER+ HER2-tumors were iso- to hypointense on T2-weighted MR images.
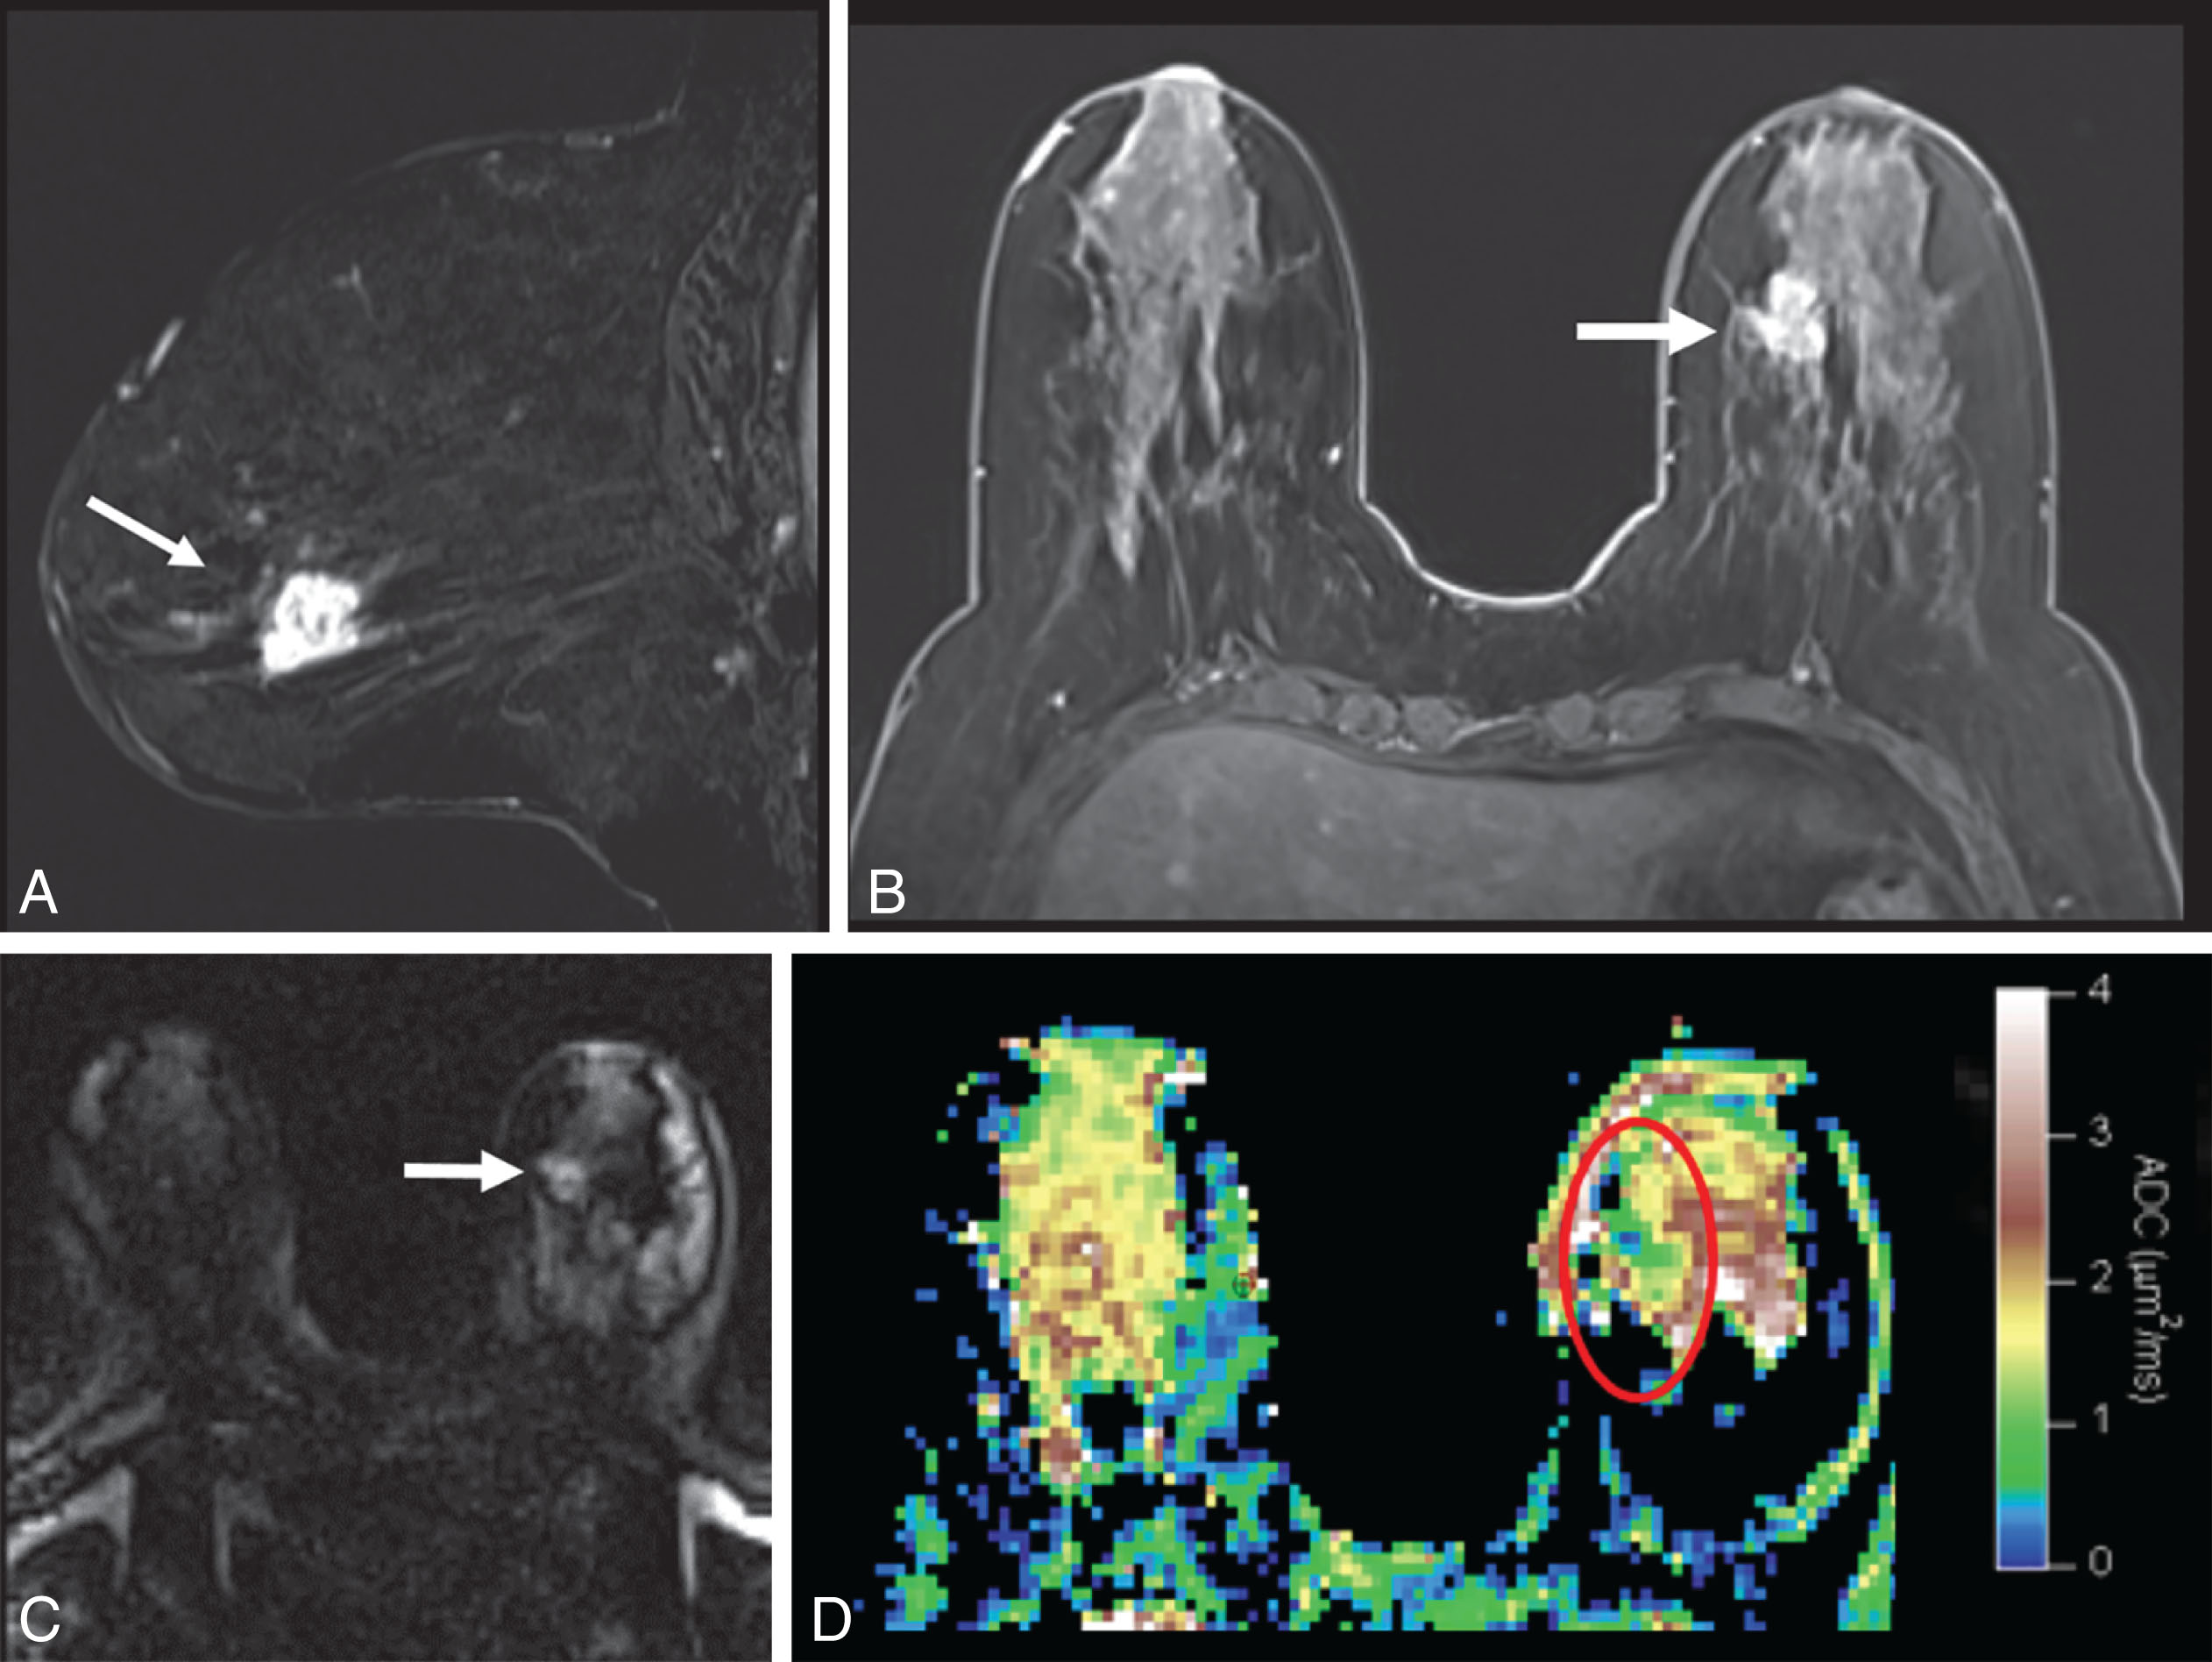
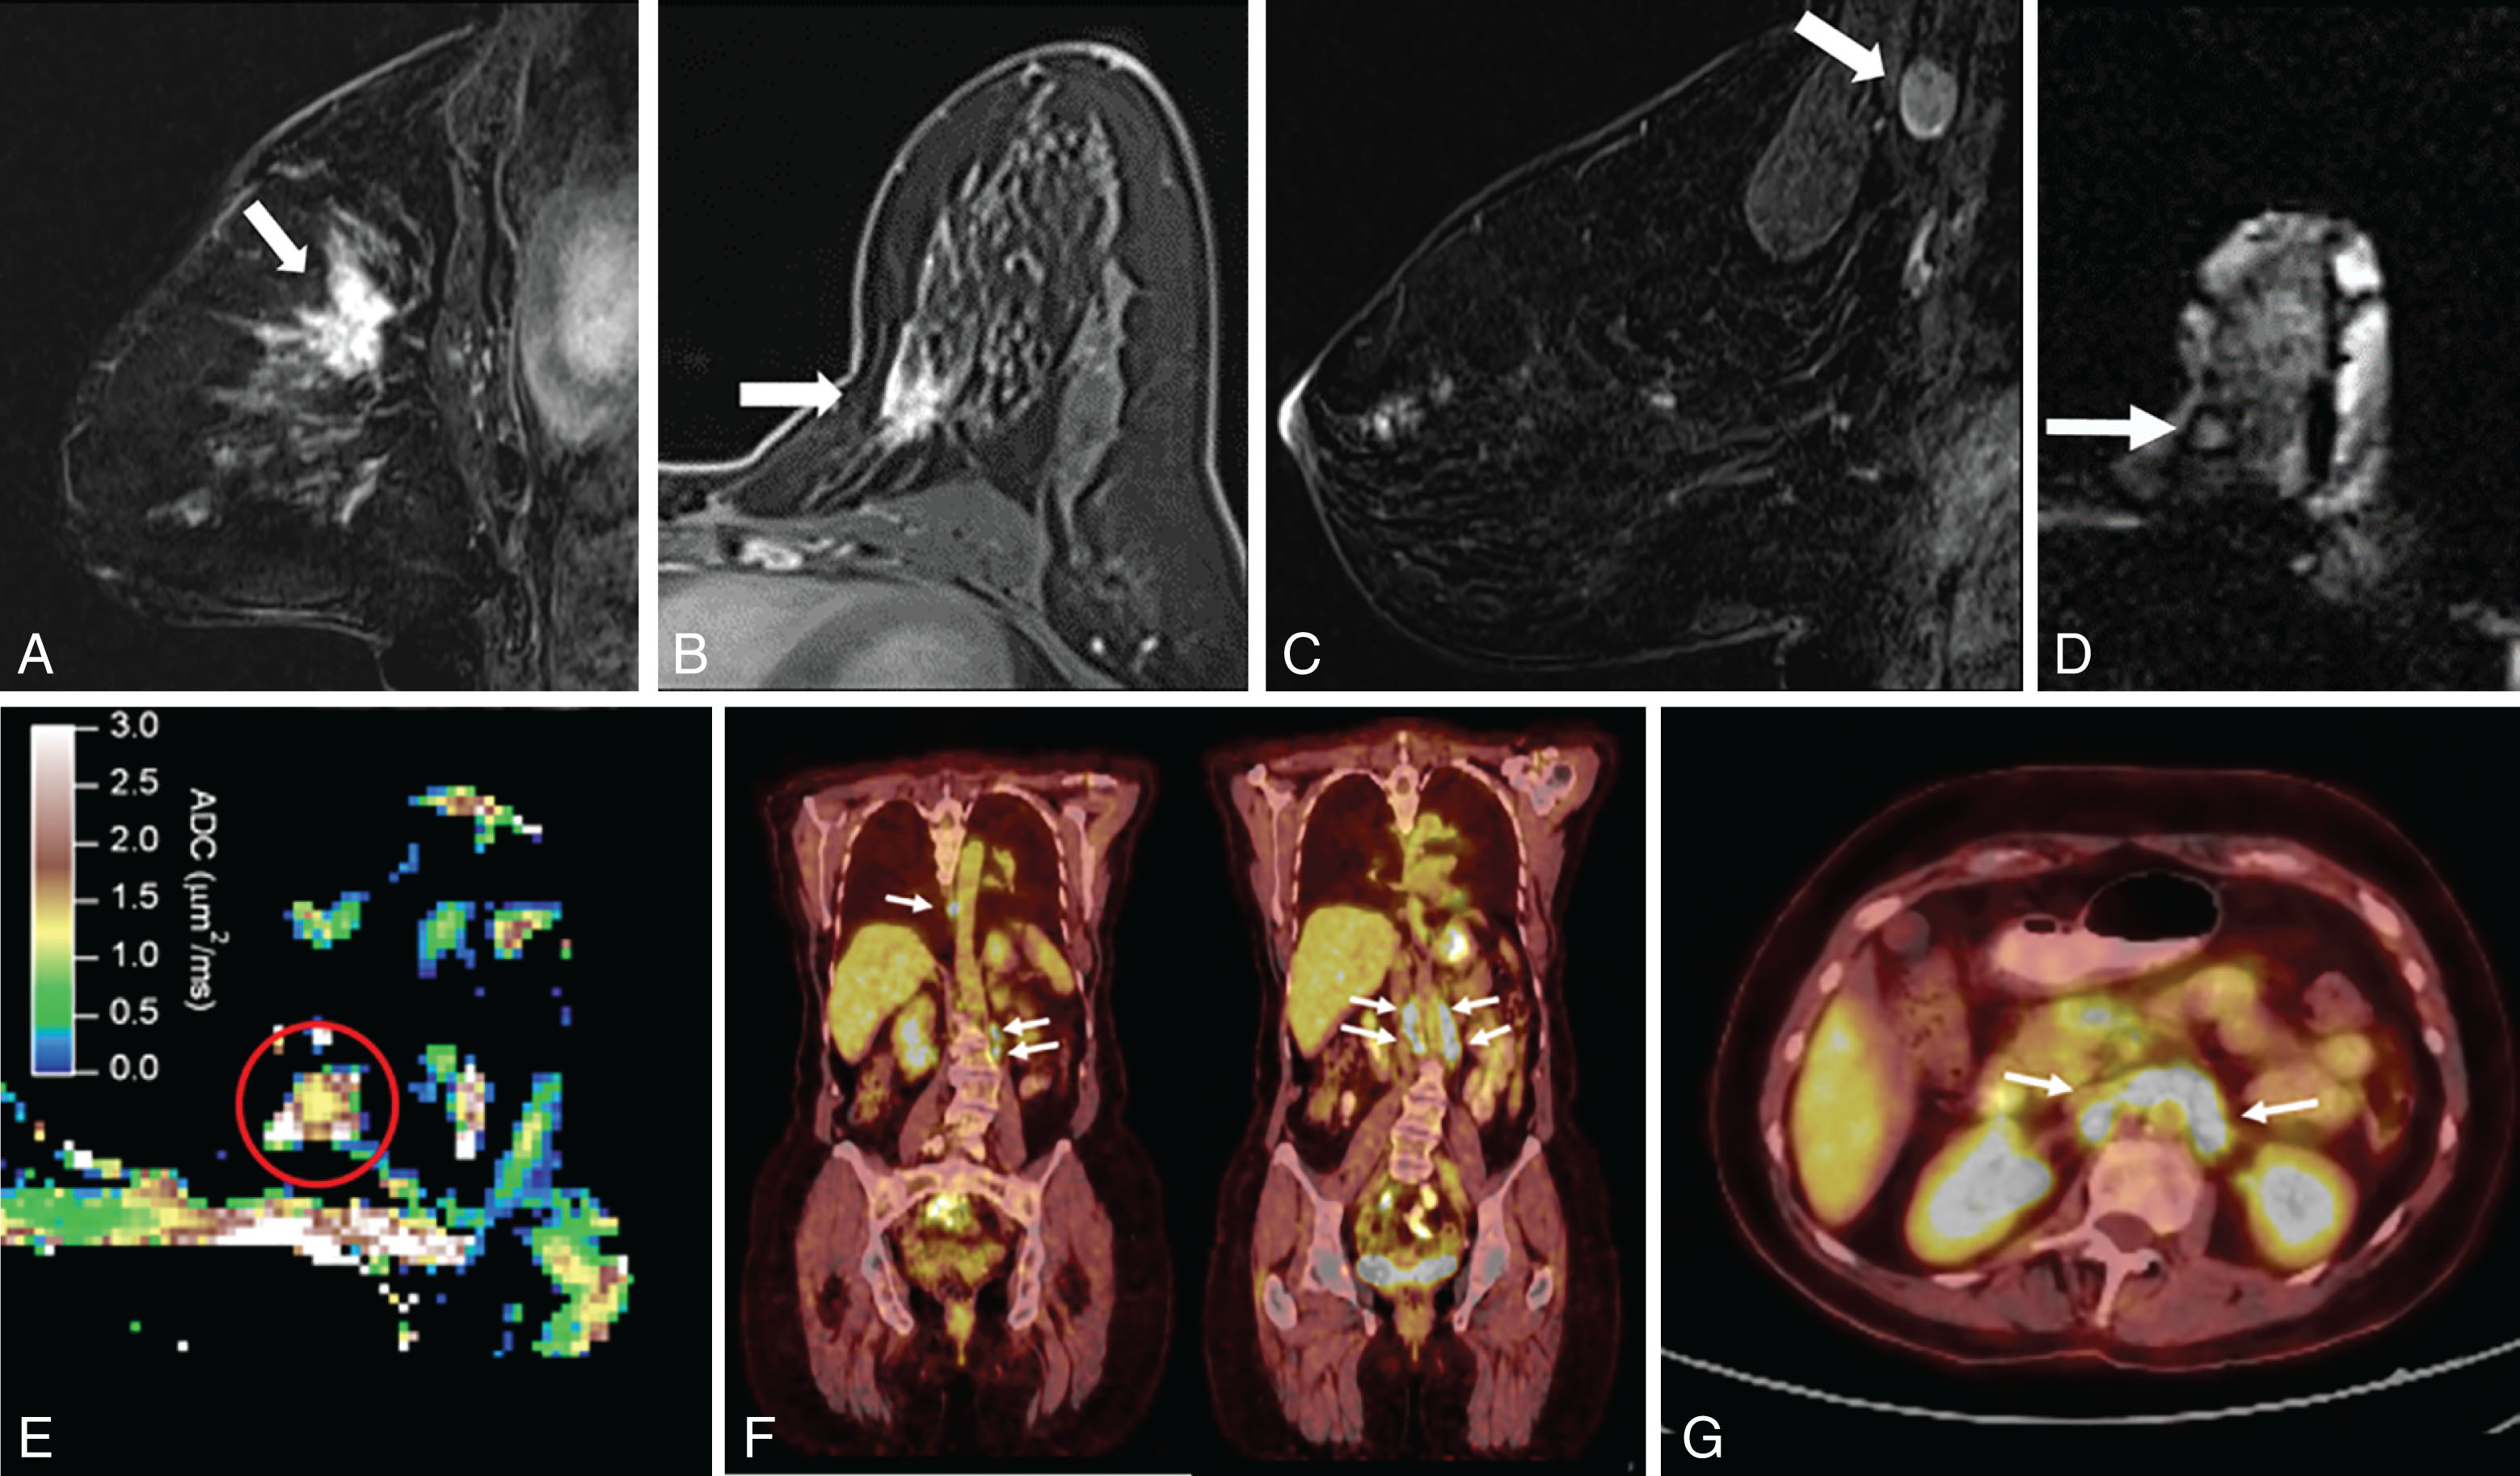
Diffusion-Weighted Imaging of Luminal Tumors
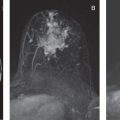
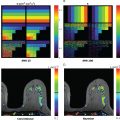
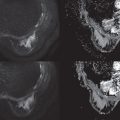
DWI is a useful tool to differentiate malignant lesions from benign lesions. It also provides information on tumor biology and microstructural features. As a result, studies were conducted to correlate ADC values and breast cancer prognostic factors. We will review the literature on the association of DWI with luminal tumors. Examples of luminal A and luminal B breast cancers evaluated on DWI are illustrated in Figs. 4.1 and 4.2 , respectively.
The ability of DWI to serve as an imaging biomarker that is associated with particular molecular subtype and to prognosticate the response to treatment is an area of robust research. Most of these DWI studies are summarized in Table 4.2 . Some investigators found that the percent of ER or PR expression accounted for differences in ADC values.
| Reference | Patients ( n ) | Field Strength (T) | b -values | Significant Parameters | Significant Outcomes | Nonsignificant Outcomes |
|---|---|---|---|---|---|---|
| Kim et al. 2009 | 67 | 1.5 | 0, 1000 | Median ADC | ER (marginal significance) | PR, HER2, p53, Ki-67, EGFR |
| Jeh et al. 2011 | 107 | 1.5, 3 | 0, 1500 for 1.5 T;0, 750 for 3 T | Mean ADC | ER, HER2 | PR, Ki-67, EGFR |
| Choi et al. 2012 | 355 | 1.5 | 0, 1000 | Mean ADC | ER, PR, Ki-67 | HER2, LN |
| Martincich et al. 2012 | 190 | 1.5 | 0, 900 | Median ADC | ER, HER2, HER2+ subtype vs. luminal | |
| Kamitani et al. 2013 | 81 | 1.5 | 0, 500, 1000 | Mean ADC | ER, PR, LN | HER2, nuclear grade, vascular invasion |
| Cipolla et al. 2014 | 92 | 3 | 0, 1000 | ADC | Histological grade | |
| Kim et al. 2015 | 173 | 3 | 0, 750 | ADC histogram parameters | HER2, Ki-67, LN, subtypes | HG, ER, PR |
| Park et al. 2015 | 110 | 3 | 0, 1000 | Mean ADC | HER2 | HG, LN, ER, PR |
| Belli et al. 2015 | 289 | 1.5 | 0, 1000 | Mean ADC | HG, LN | Tumor size |
| Molinari et al. 2015 | 115 | 1.5 | 0, 1000 | ADC | Ki-67, HG, luminal B vs. other subtypes | |
| Arponen et al. 2015 | 112 | 3 | 0, 200, 400, 600, 800 | ADC | LN, HG, PR, NPI | ER, HER2, Ki-67 |
| Cho et al. 2016 | 50 | 3 | 0, 30, 70, 100, 150, 200, 300, 400, 500, 800 | ADC, IVIM parameters (Dt, Dp, fp) | ER, PR, HER2, Ki-67, subtypes | |
| Kim et al. 2016 | 275 | 3 | 0, 30, 70, 100, 150, 200, 300, 400, 500, 800 | ADC, IVIM parameters (Dt, fp) | Ki-67, luminal B vs. other subtypes | |
| Durando et al. 2016 | 212 | 3 | 0, 1000 | ADC | LVI | Tumor size, HG, ER, PR, HER2, LN |
| Kitajima et al. 2016 | 214 | 3 | 0, 1000 | Mean ADC | Ki-67, tumor size, LN, TNM stage, IDC vs. ILC | ER, PR, HER2, subtype |
| Shin et al. 2016 | 138 | 3 | 0, 1000 | ADC | Tumor cellularity, Ki-67, PLI | TILs, LN, tumor size |
| Lee et al. 2017 | 72 | 3 | 0, 25, 50, 75, 100, 150, 200, 300, 500, 800 | ADC, IVIM parameters (Ds) | ER, HG, subtype, Ki-67 | |
| Kawashima et al. 2017 | 134 | 3 | 0, 20, 40, 80, 120, 200, 400, 600, 800 | ADC, IVIM parameters (D) | Luminal A vs. luminal B, Ki-67 | |
| Suo et al. 2017 | 101 | 3 | 0, 10, 30, 50, 100, 150, 200, 500, 800, 1000, 1500, 2000, 2500 | ADC, α, Df, Ds, f, DDC, MD | Ki-67, LN, ER | |
| Fan et al. 2017 | 82 | 3 | 50, 1000 | ADC (tumor, peritumoral) | Ki-67 | |
| Vidic et al. 2018 | 51 | 3 | 0, 10, 20, 30, 40, 50, 70, 90, 120, 150, 200, 400, 700 | Combined diffusion model | HER2 status of ER+ tumors | |
| Iima et al. 2018 | 199 | 3 | 5, 10, 20, 30, 50, 70, 100, 200, 400, 600, 800, 1000, 1500, 2000, 2500 | sADC 200–1500 | PR, subtypes | |
| Fan et al. 2018 | 126 | 3 | 50, 1000 | Mean ADC | Subtypes | |
| Liu et al. 2018 | 151 | 3 | 0, 1000 | ADC | ER, PR, HER2 | |
| Amornsiripanitch et al. 2018 | 107 | 3 | 0, 800 | ADC mean, CNR | HG, Ki-67, Oncotype DX RS | |
| Shen et al. 2018 | 71 | 3 | 0, 600 | ADC | Ki-67, subtypes | |
| Zhuang et al. 2018 | 80 | 3 | 0, 800 | Min ADC, max ADC, ΔADC | Ki-67 | |
| Surov et al. 2018 | 870 | 1.5, 3 | 0, 1000; 0, 900 for 1.5 T; 50, 1000; 0, 0, 800; 0, 1000 for 3 T | Mean ADC | Ki-67 | Nuclear grade |
| Thakur et al. 2018 | 31 | 3 | 0, 600, 1000 | Mean ADC | Oncotype DX RS | |
| Igarashi et al. 2018 | 140 | 1.5 | 0, 1000, 1500 | ADC (tumor, peritumoral), ratio | LVI | |
| Suo et al. 2019 | 134 | 3 | 0, 800, 1500 | Mean ADC, entropy of ADC | ER, PR, HER2, Ki-67, luminal vs. HER2+ subtypes | |
| Horvat et al. 2019 | 107 | 3 | 0, 850 | Mean ADC, max ADC | ER, PR, luminal vs. nonluminal subtypes | |
| Kim et al. 2019 | 258 | 3 | 0, 1000 | ΔADC | Distant metastasis-free survival | |
| Fogante et al. 2019 | 125 | 1.5 | 0, 800 | Mean ADC | TILs, IDC vs. ILC | |
| Tang et al. 2020 | 114 | 1.5 | 50, 800 | ADC histogram parameters | TILs, Ki-67 |
Related posts:
 Disease and Treatment Monitoring
 Diffusion MRI as a Stand-Alone Unenhanced Approach for Breast Imaging and Screening
 Conventional Breast Imaging
 Diffusion-Weighted Whole Body Imaging With Background Body Signal Suppression (DWIBS)
 Diffusion-Weighted Imaging (DWI) for Breast Lesion Characterization: The Olea Medical Perspective and the Utilization of Olea Sphere Software
 Breast Diffusion MRI Acquisition and Processing Techniques: The GE Healthcare Perspective
Stay updated, free articles. Join our Telegram channel

Full access? Get Clinical Tree


